
16 min read
Morningstar Markets Observer: Q4 2026
Market Overview
Bond Prices Fall and Stocks Sputter in the Third Quarter
Bond markets across the board fell in the third quarter as inflation, deficit concerns, and the September Federal Reserve rate hike stretched yields and depressed prices.
Equity markets sputtered in the third quarter but remain broadly positive for the year.
Small-cap US stocks fell 5.6% in the third quarter as investors favored larger companies in the rising rate environment.
Commodities recovered in the third quarter as oil prices rose amid the ongoing conflict in the Middle East.
Market Dashboard: Return (%)
3-Month Return (%)
1-Year Return (%)
5-Year Return (%)
Source: Morningstar Direct. Data as of Sept. 30, 2026.
Bitcoin Bounces Back
Bitcoin surged 42.6% in the third quarter, quickly reversing a steady decline in the cryptocurrency’s price that began inOctober 2025.
Oil prices also bounced back, climbing 41.9% in the last three months. US home prices remain close to record highs, but some markets are seeing some strain with mortgage rates near or at recent highs. The federal-funds rate increased following the Federal Open Market Committee’s unanimous vote to hike the benchmark rate in September.
Market Thermometer
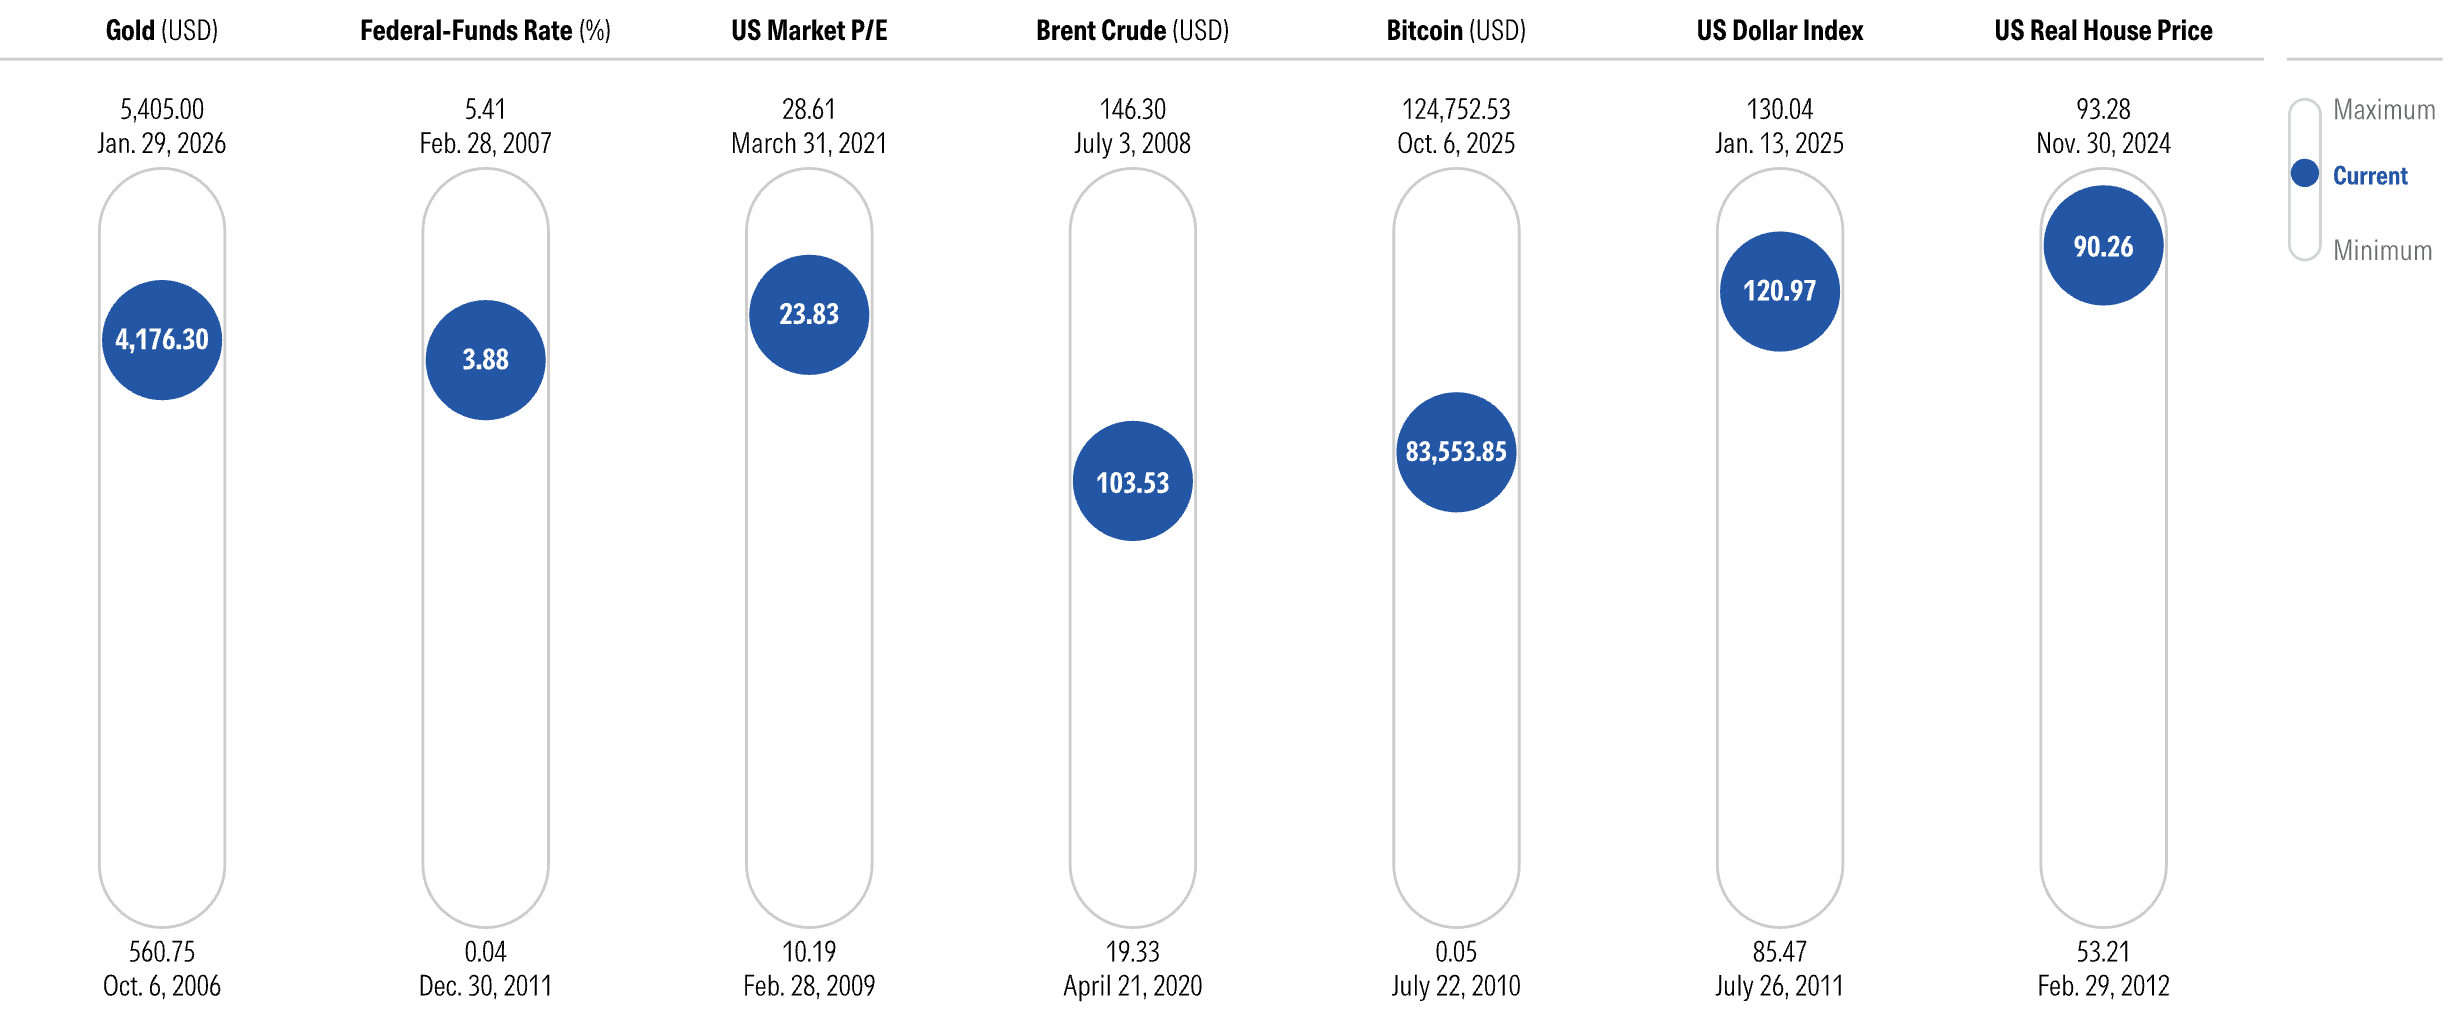
Source: Morningstar Direct, Federal Reserve Bank of St. Louis, National Association of Realtors, Macrobond. Minimums and Maximums for the period Oct. 1, 2006, to Sept. 30, 2026.
US Stock Market Continues Expansion Despite Uncertainty
US stocks continued their rise in the third quarter of 2026, bringing the current expansion to 33 months. Since 2022's downturn, the US market has gained 30.7% annualized and 108.8% total. The US stock market was resilient in the third quarter despite rising bond yields, continued inflation uncertainty, and rising energy prices.
Not all stocks are going up, though. A few market leaders—mostly artificial intelligence stocks—have pushed benchmarks higher while many smaller stocks have comparatively struggled.
US Market Downturns, Recoveries, and Expansions
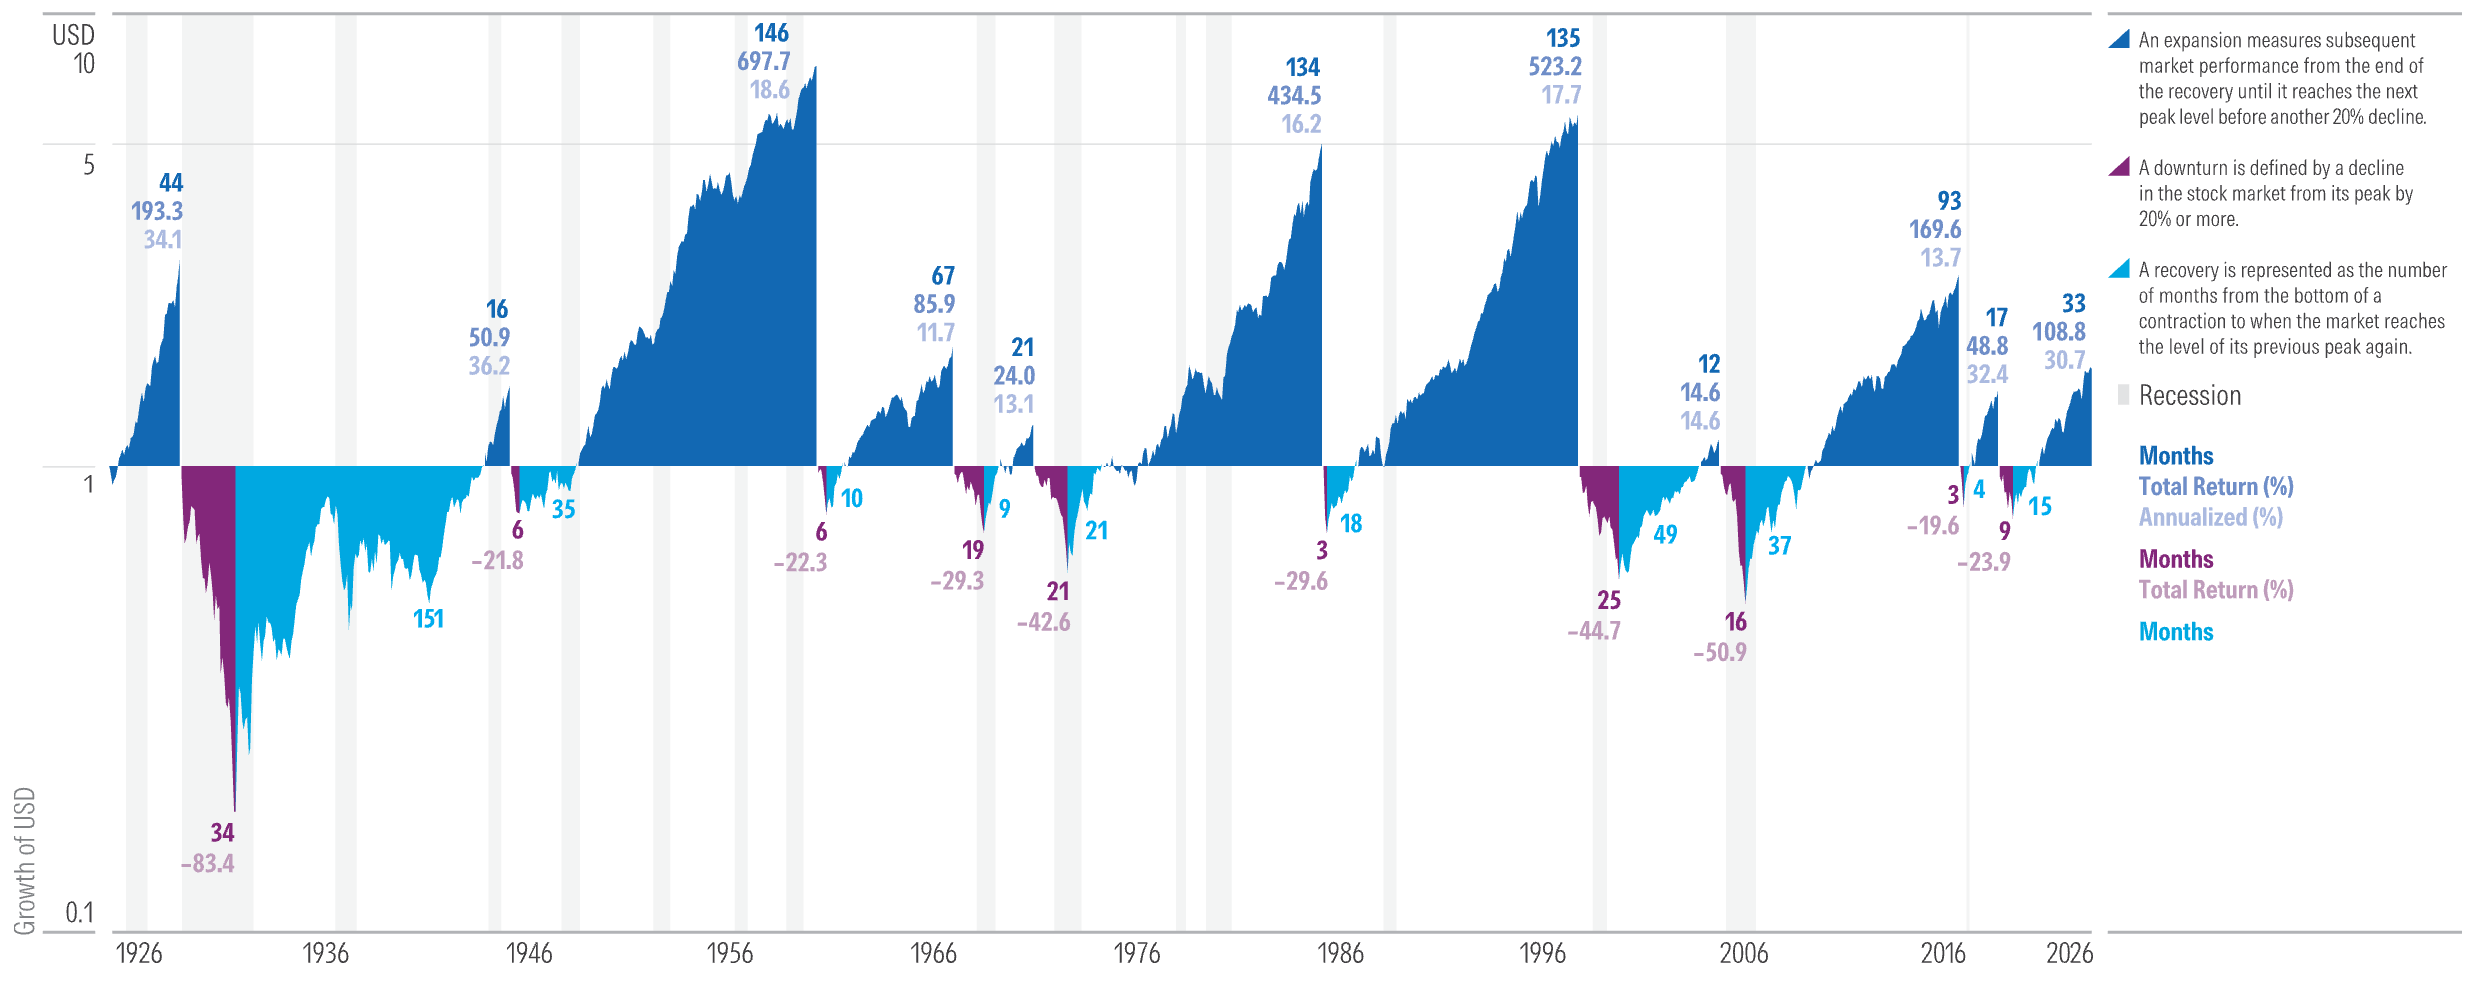
Source: Stocks—Ibbotson Associates SBBI US Large Stock Index. Recession data from the National Bureau of Economic Research. Data as of Sept. 30, 2026.
Commodities Recover and Bonds Stumble
Commodities recovered following June’s trough, gaining 39.7% as oil prices surged. Emerging markets remain the best-performing global market over the last 12 months despite a pullback in July and ongoing volatility.
US bonds entered negative territory for the trailing 12 months as yields increased because of the Federal Reserve’s rate hike. Developed-market stock returns converged with their US counterparts as the former declined in September, and the latter remained relatively steady.
Source: US stocks—Morningstar US Market Index. Developed-markets stocks ex-US—Morningstar Developed Markets ex-US Index. Emerging-markets stocks—Morningstar Emerging Markets Index. US bonds—Morningstar Core Bond Index. Emerging-markets stocks—Morningstar Emerging Markets Composite Bond. Commodities—Bloomberg Commodity Index. Data as of Sept. 30, 2026.
Energy Dominates as Oil Surges
The US Market gained about 1% in the third quarter and roughly 12% year to date. Energy, technology, and healthcare sector returns drove these results. Energy stocks were up 15% in the third quarter and nearly 40% for the year. This rally reflects the sharp rise in oil prices as the Iran war rages on past the seven-month mark. Utilities and industrials both fell by around 12% over the quarter as higher interest rates weighed on rate-sensitive areas of the market.
Source: Morningstar Sector Indexes. Data as of Sept. 30, 2026.
Inflationary Pressures and Tech Volatility Led to Mixed Results for Foreign Stocks
International stock markets saw mixed results in the third quarter of 2026. Developed markets gained 1.3% while emerging markets dropped 0.9%, in stark contrast to gains of 9.5% and 22.4% in the prior quarter, respectively. Developed Asia ex-Japan and Japan led the quarter among non-US regions, supported by strong results in Singapore and Hong Kong and encouraging earnings in Japan. Meanwhile, inflationary pressures suppressed results in Europe ex-UK, and technology-related volatility undercut prior gains in Asian emerging markets.
Source: Morningstar Indexes. All returns are calculated in US dollars. Data as of Sept. 30, 2026.
Valuation-Implied Returns: Further Moderation for Foreign Stocks, Growing Expectations for US High Yield
Valuation-implied returns serve as a useful measure for cross-asset-class comparisons. Emerging market stocks maintain the second-highest 10-year expected returns as of September 2026, 3 percentage points below September 2025, following a relatively volatile quarter.
US high-yield bonds hold the highest expected returns over the next decade, with VIRs growing by 1.4 percentage points despite a challenging quarter for fixed income amid persistent inflationary concerns and a rate hike.
High-yield bonds held up better thanks to their shorter duration and higher coupons.
Source: Morningstar Investment Management LLC. Data as of Sept. 30, 2026.
Equities
Global Market Barometer
Global equity markets continued their strong run through the first three quarters of 2026. South Korea again led other major markets by a wide margin, up 74.5% on the continued rally in semiconductor and memory-chip companies. Thailand, Peru, Greece, and Egypt also stood out with gains of more than 25%. On the other hand, China, India, and South Africa remained in negative territory, with China declining to 14.1%. India and South Africa each fell by more than 6%.
YTD Returns of Morningstar Country Indexes in Base Currency (%)
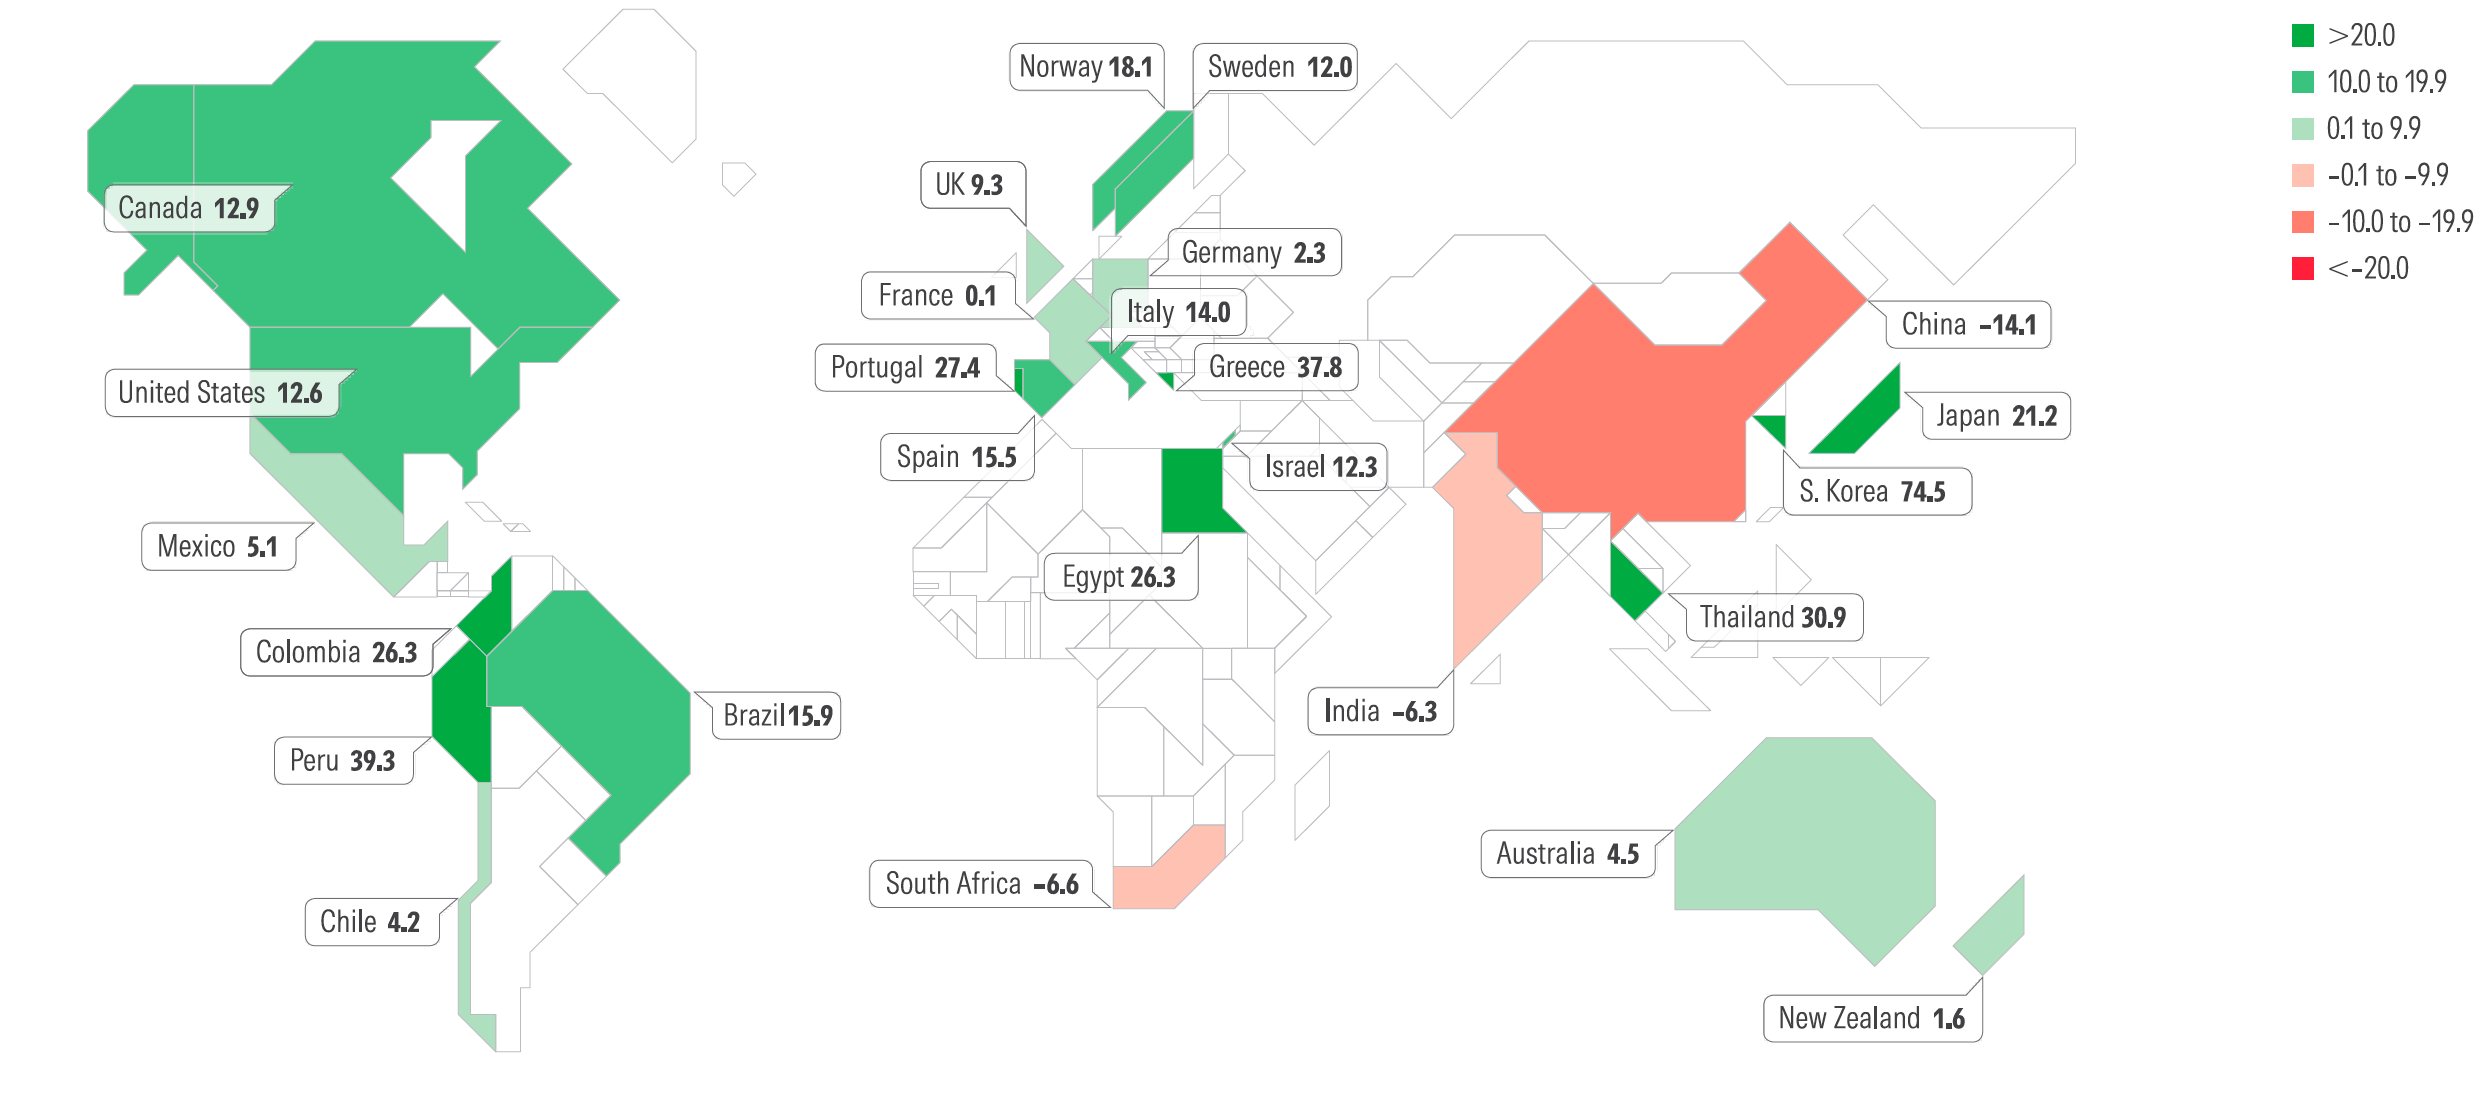
Source: Morningstar Country and Region Indexes. Data as Sept. 30, 2026.
Global Stock Market Performance Decomposition
Asia ex-Japan and emerging markets continued to dominate throughout 2026, fueled by improved margins despite a drop in P/E multiples. The US delivered more modest returns, also relying on margin expansion and strong revenue growth to offset compressing valuations. On the other hand, currency pressure combined with relatively weaker margin expansion found Europe ex-UK at the bottom of the pack.
Source: Morningstar Direct. Data as of Sept. 30, 2026.
Sector Performance Decomposition
Sector returns in 2026 have been shaped by both improving fundamentals and shifting investor sentiment. Energy and technology led the market, fueled by strong sales growth and expanding margins, while industrials and healthcare posted more moderate gains, supported in part by valuation tailwinds. P/E multiple compression remained a headwind across much of the market, however. Consumer discretionary was hit hardest, as a sharp decline in valuation multiples more than offset improving profitability.
Source: Morningstar Direct. Data as of Sept. 30, 2026.
Morningstar Price/Fair Value
The median stock in the Morningstar US Market Index remained undervalued throughout the third quarter of 2026, ending September at an 8.1% discount to fair value.
Communication services was the most undervalued sector at the end of September, followed by consumer cyclicals and real estate. Technology also traded at a meaningful discount, highlighting the schism between a few high-priced AI stocks and many more lagging names.
In contrast, healthcare was the most overvalued sector. Energy, industrials, and consumer defensive stocks traded close to fair value.
Source: Morningstar fair value data. Data as of Sept. 30, 2026.
What's Cheap? Size and Industry Valuations Diverge
The premium of US large-cap stocks over US small-cap stocks has narrowed in the past several years, briefly dipping below its average level for the first time in July since May 2021. However, this compression may be short-lived as the premium rose again in September. Within technology, the recent rise of semiconductor stocks above software stocks reversed sharply starting in June, as concerns around AI spending and earnings triggered a sharp selloff and valuation rese
Source: Morningstar Direct. Indexes: Morningstar US Large Cap, Morningstar US Small Cap, Morningstar Global Semi Group, and Morningstar Global SoftwareData as of Sept. 30, 2026.
Value is Back In Style
Value and momentum have been the standout factors over the past year, although momentum weakened notably as some of the best-performing names at the start of the year pulled back in the third quarter. The yield factor also fared well more recently, while quality, low volatility, and size all posted modestly negative returns over the period.
Source: Morningstar Direct. Value—Morningstar US Value Factor Index, Yield—Morningstar US Yield Factor Index, Momentum—Morningstar US Momentum Factor Index, Quality—Morningstar US Quality Factor Index, Low Volatility—Morningstar US Low Volatility Factor Index, Size—Morningstar US Size Factor Index Market—Morningstar Market Index. Data as of Sept. 30, 2026.
Korea and Taiwan Drive Emerging-Market Outperformance
Taiwan and Korea have dominated headlines and emerging-market indexes recently as both have benefited from major gains in a handful of semiconductor-related stocks. Those few stocks fueled much of the Morningstar Emerging Markets Index’s rise over the last 12 months. India and China are typically two of the largest countries in the index and negatively contributed to its returns. The index’s strong run despite these juggernauts struggling underscores the outsize influence of just a handful of stocks in Korea and Taiwan.
Source: Morningstar Direct. Indexes: Morningstar Emerging Markets Index, Morningstar Korea, Morningstar Taiwan, and Morningstar Global Markets ex-US. Active return is the difference in return between an index and its benchmark over a specified period, generated by allocation and selection decisions. Data as of Sept. 30, 2026.
Markets Historically Fare Well After Midterm Elections
Midterm election years, on average, have been followed by stronger stock market returns than presidential election years or nonelection years going back 50 years. One possible explanation is that midterm elections often don’t deliver a sweep for one party, decreasing the likelihood of sweeping policy changes and increasing political predictability.
Source: Morningstar Direct. Displays average rolling 12-month returns starting November 1975 through October 2025 for the S&P 500 Index.
Fixed Income
Most Bond Sectors See Red Amid Rate Hikes
With significant interest rate increases along the yield curve during the third quarter, fixed-income sectors sold off across the board except for leveraged loans, which are not harmed by rising rates like other sectors.
In addition to rising yields, municipal bonds were hurt by surging new-issue supply, causing them to cheapen relative to Treasuries.
The recent bond selloff has pushed most fixed-income sectors into negative return territory over the trailing 12 months, with credit-heavy and less interest rate-sensitive sectors being the main exception.
Source: Morningstar Indexes. Data as of Sept. 30, 2026.
The Treasury Yield Curve Shifted Higher
The US Treasury yield curve experienced a bear steepening in the third quarter, meaning long-term yields increased more than short-term rates and drove bond prices down. The movement was driven by renewed inflation fears from higher oil prices stemming from the Iran war, heavy debt-funding spending from AI data center construction, and the Federal Reserve's decision to resume tightening with a 25-basis-point rate hike in September.
Source: Macrobond. Data as of Sept. 30, 2026.
Fixed-Income Yields On The Rise
Yields climbed across the board as bonds sold off globally in the third quarter. The Federal Reserve's September rate hike and the market's anticipation of it contributed meaningfully, as did widening credit spreads and surging mortgage rates. Supply outpaced demand in most fixed-income sectors late in the quarter, also contributing to yield increases. Many bond sectors are at or near their highest yield levels in a decade, including US Treasuries, global core bonds, and municipal bonds. Yields across sectors remain above 10-year median levels.
Source: Morningstar Indexes. Data as of Sept. 30, 2026.
Global Yields Continue to Climb
The 10-year US Treasury yield reached a multidecade high and finished the quarter at 5.29%. Globally, yields increased during the quarter because of renewed geopolitical conflict, persistent inflation and stronger growth, and central banks pivoting to rate increases. Alongside the Federal Reserve, the European Central Bank, Bank of Japan, and Reserve Bank of Australia each raised their key rate by 25 basis points, while the Bank of England kept its benchmark interest rate steady during the quarter.
Source: Macrobond. Data as of Sept. 30, 2026.
Higher Real Yields, Not Inflation Fears, Drove Most of 2026’s Rise in 10-Year Yields
The 10-year real yield (what the bond pays after inflation) climbed sharply in 2026 while the 10-year breakeven (the market’s inflation forecast) rose only slightly. This suggests investors are not bracing for runaway inflation. A stronger economy, heavy borrowing to fund AI and data center spending, and more price-sensitive buyers are behind this. This matters for investors because the rise reflects growth and competition for capital, not a loss of faith in US debt. For bond buyers, Treasuries now pay meaningfully more than the inflation rate.
Source: ICE Indexes. Data as of Sept. 30, 2026.
Asymmetric Stories in the Bank Loan Universe
Spreads on BB and B rated bank loans, which make up more than 90% of the Morningstar LSTA Leveraged Loan Index, were flat or tightened throughout the third quarter. However, spreads on CCC rated bank loans widened meaningfully, reaching levels last seen shortly after the 2020 pandemic selloff. The last time CCC rated bank loans were this wide was in 2009. Fundamentals in this part of the market have been noticeably worse; many of these lower-rated issues were originated in 2021 and 2022 at lower rates and are approaching maturity with significantly higher default risk.
Source: Morningstar Indexes. Data as of Sept. 30, 2026.
Investors Anticipate and React to the Fed’s Rate Hike
The Federal Reserve's September rate hike negatively impacted most fixed-income sectors. As the expectations of a rate hike increased meaningfully in the weeks before the Fed's September meeting, bond markets priced in the hike ahead of time and experienced losses in the process.
The probability of another rate hike in October decreased in the last two weeks of September, however, and longer-term bonds sold off as intermediate- and long-term rates rose more than the short end of the curve.
Sources: Morningstar Indexes. CME FedWatch. Data as of Sept. 30, 2026.
Mortgage Market Mayhem
Mortgage rates also increased substantially during 2026’s third quarter, particularly in September, surpassing 7.25%, the highest level since 2023. During the last week of September alone, mortgage rates increased by 25 basis points, the largest weekly increase since 2022.
Mortgage-backed securities, in turn, experienced meaningful losses, not only because of increased rates, but also rate volatility in general, which is especially damaging to the negative convexity of mortgages.
As mortgages sold off in September, agency mortgage spreads widened, further contributing to losses.
Sources: Morningstar Indexes. Freddie Mac via FRED®. Data as of Sept. 30, 2026..
Don't Turn Your Back on Munis
September marked the worst month for municipal bonds since the global financial crisis in 2008. During the quarter, the Morningstar US Municipal Bond Index fell 6%, driven by a combination of macroeconomic headwinds and weak market technicals rather than a decline in credit fundamentals.
While that experience is alarming for investors seeking relative stability in the high-quality asset class, munis are a long-term investment and have swiftly recovered from previous selloff periods. And now, higher tax-free income makes the asset class even more appealing.
Source: Morningstar Direct, Morningstar Indexes. Data as of Sept. 30, 2026.
Funds
Top- and Bottom-Performing Morningstar Categories
Digital assets cut into their trailing 12-month losses by surging 43.9% in the third quarter. Despite this, the category is still down 26.9% over the past year. Commodities funds and equity precious metals also posted double-digit gains.
On the flip side, utilities performed the worst, falling 12.1% in the third quarter. It was followed by small-growth, industrials, and infrastructure at the bottom of the leaderboard. Taxable-bond funds saw the largest asset inflows, likely thanks to appetizing yields. US equity and allocation funds were in outflows.
Risky Trends in ETF Launches
Risky investment strategies are launching faster than ever before. Six categories ranked in the top 10 by ETF launches in both 2021 and 2026, and one has seen a precipitous rise in the last five years.
While the large-blend, technology, and large-growth categories continue to churn out new ETFs, trading—leveraged equity blows all other categories away with 218 new launches through the first half of 2026.
These risky ETFs are trading tools that leverage the returns of single stocks or market segments and are typically intended to be held for hours or days, not months or years.
Source: Why the Next Generation of ETFs Looks Riskier for Investors. Data as of June 30, 2026.
The Nontraded REIT Landscape is Top-Heavy
Nontraded REITs have garnered more attention amid broader interest in semiliquid vehicles. Morningstar’s recently published US Nontraded REIT Landscape explores this unique and extremely concentrated industry.
Blackstone Real Estate Income Trust held USD 56.6 billion in assets at the end of June 2026, nearly half the nontraded REIT industry. The next nine largest nontraded REITs held nearly USD 30 billion in net assets combined. Total assets for nontraded REITs reached USD 115 billion at the end of June, nearly four times the group’s 2020 tally.
Source: Nontraded REIT Landscape 2026. Data as of June 30, 2026.
Resurgent Flows For Categories Seen As Inflation Hedges
Fueled by resurgent expectations for inflation and rising oil prices, investors turned to funds with inflation-hedging capabilities, such as inflation-protected bonds and commodities.
On the commodities front, inflows reached USD 11 billion in August 2026, following deep outflows for much of the preceding five months.
Inflation-protected bond and short-term inflation-protected bond funds continued a steady streak of inflows for 2026, raking in USD 6 billion in August.
Source: Where Fund Investors Are Turning for Inflation Protection. Data as of Aug. 31, 2026.
Private Markets Growth: Venture Capital Funds Are Winning Flows
Venture capital funds continued to dominate semiliquid fund flows in the second quarter of 2026, drawing roughly USD 450 million and accounting for most of the quarter’s inflows. Private equity funds still gathered assets, but at a much slower pace than their 2025 peak, collecting USD 150 million. Direct lending funds saw net outflows for the second consecutive quarter. Overall, quarterly flows have fallen well below the third-quarter 2025 high of nearly USD 1 billion, but venture capital’s share keeps growing.
Source: Morningstar Direct. Data as of June 30, 2026.
Thematic ETFs Are Popular Again
Thematic ETFs have regained investor favor, gathering approximately USD 76 billion in net inflows since December 2024 after investors pulled money from the category from 2022 through late 2024. AI and Big Data has been the largest draw at roughly USD 26 billion, about one-third of the total, followed by energy transition and security. Flows have followed performance, with many AI-themed ETFs routinely posting 20%-plus rolling 12-month returns over the last few years.
Source: Morningstar. Data as of Aug. 31, 2026.
Economic Indicators
US GDP Growth to Reaccelerate in Later Years of Our Forecast, While Inflation Recedes
We’re still expecting US GDP growth to slow a bit further through 2028, owing to decelerating AI spending, slower population growth, the ongoing drag from high interest rates, and other factors. Inflation should recede given the fading oil and tariff shocks and meager wage growth. Monetary easing drives a rebound in GDP growth over 2029-30.
Source: US Bureau of Economic Analysis, Morningstar.
Federal Reserve to Resume Cutting Over 2027-28, Driving Yields Lower
The Fed has already hiked its benchmark rate once this year in September, and another hike is likely before the end of the year. We expect a return to rate cuts starting in the second half of 2027, driving the fed-funds rate down to 2.50%-2.75% by the end of 2028, a net 1.25 percentage points lower than the current 3.75%-4.00% range.
This should help push longer-term interest rates down further, with the 10-year Treasury yield dropping to 3.25% by 2029. Lower rates will be needed to support continued healthy economic growth.
Source: Federal Reserve, Chicago Mercantile Exchange.
Monetary Policy Becoming More Restrictive in Major Economies
Central bankers have become increasingly impatient with the continued deviance of inflation above target, leading to upward revisions in expectations for key policy rates (except in Japan, where inflation has been mild this year). Economic conditions have been solid, despite concerns the energy shock would be contractionary via the hit to household purchasing power, which is giving the green light to focus on inflation and tighten monetary policy.
Source: Chicago Mercantile Exchange, Eurex Exchange, Japan Exchange Group.
Inflation Has Increased, but is Still Dwarfed by 2021-2022 Surge
Overall inflation has generally moved up in major economies as a result of the energy price shock in 2026. While the impact has been small compared with the inflationary surge over 2021-22, it’s helping prolong a period of high inflation that has lasted for over five years.
Source: Macrobond.
Economic Growth Hardly Hit by Energy Shock
The International Monetary Fund estimates global GDP will grow by 3.1% in 2026. That’s down slightly from 3.5% in 2025, but most of the decrease is owing to Middle Eastern countries whose oil output has been curtailed by the Iran war. Elsewhere, economies have proved almost impervious to the energy price shock so far. Global GDP growth is expected to bounce back to 3.4% in 2027 but then slide to 3.1% by 2031, driven by a downtrend in growth for most advanced economies and China.
Energy Prices Surging, but Still Expected to Fall
Prices for oil products like gasoline and diesel have doubled or more versus prewar levels. Refinery disruptions in Russia and elsewhere caused yawning crack spreads, compounding the rise in crude prices from the Iran war. A crack spread is the price difference between crude oil and the eventual refined product.
But the most important feature of energy markets is that futures imply a hefty fall in prices over the next year and beyond, as the disruptions are expected to eventually fade. If that’s correct, then the energy shock shouldn’t have a sustained inflationary impact.
Source: New York Mercantile Exchange.
AI-Driven Economic Strength Is Main Factor Boosting US Bond Yields in 2026
Bond market inflation expectations have hardly risen since 2025, even during the period of gold’s rise, making it doubtful that fears of currency “debasement” to resolve the high US government debt load are driving up bond yields. While the debt outlook isn’t good, it hasn’t worsened substantially in the past couple of years. We think economic strength, underpinned by AI, is the main factor driving up yields in the US.
Source: Federal Reserve (left), Congressional Budget Office (right).
Government Debt Worries Have Been Playing a Bigger Role in Bond Selloff
Starting in mid-September, the spread of French 10-year government bond yields over those of Germany jumped by around 0.4 percentage points. Other high-debt countries saw a large yield increase. Based on our regression, if the US debt/GDP was at Denmark’s extremely low level of 27%, the increase in 10-year Treasury yields this year would have been 0.7 points instead of 1.1 points. So, government debt concerns are now playing a significant role in higher yields, but they don’t account for the bulk of the increase observed in 2026 so far.
Source: Macrobond, International Monetary Fund (right).
AI Spending is Crowding Out Other Spending in US
Tech-related investment, driven by AI, is accounting for an increasing share of US GDP growth. That doesn’t mean that AI is boosting GDP growth, however. Rather, the Fed is offsetting higher AI spending by keeping interest rates elevated, which in turn, is suppressing rate-sensitive spending categories like residential investment or nontech business investment. AI is effectively crowding out other types of spending. That’s why we say AI’s main effect right now is on interest rates, rather than GDP or inflation.
Source: Bureau of Economic Analysis.
US Home Price Appreciation Remains Weak
Home price growth has settled down to a subdued pace of 2.1% for the second quarter of 2026, down from a 2.9% average growth rate in 2025 and 5.4% in 2024. The deceleration in home price growth has been broad, though Midwestern markets have been more resilient. Sunbelt markets continue to see weak or negative growth, owing to excess supply resulting from vigorous building in response to the postpandemic boom in these markets.
Year-Over-Year Price Growth: Q2 2026
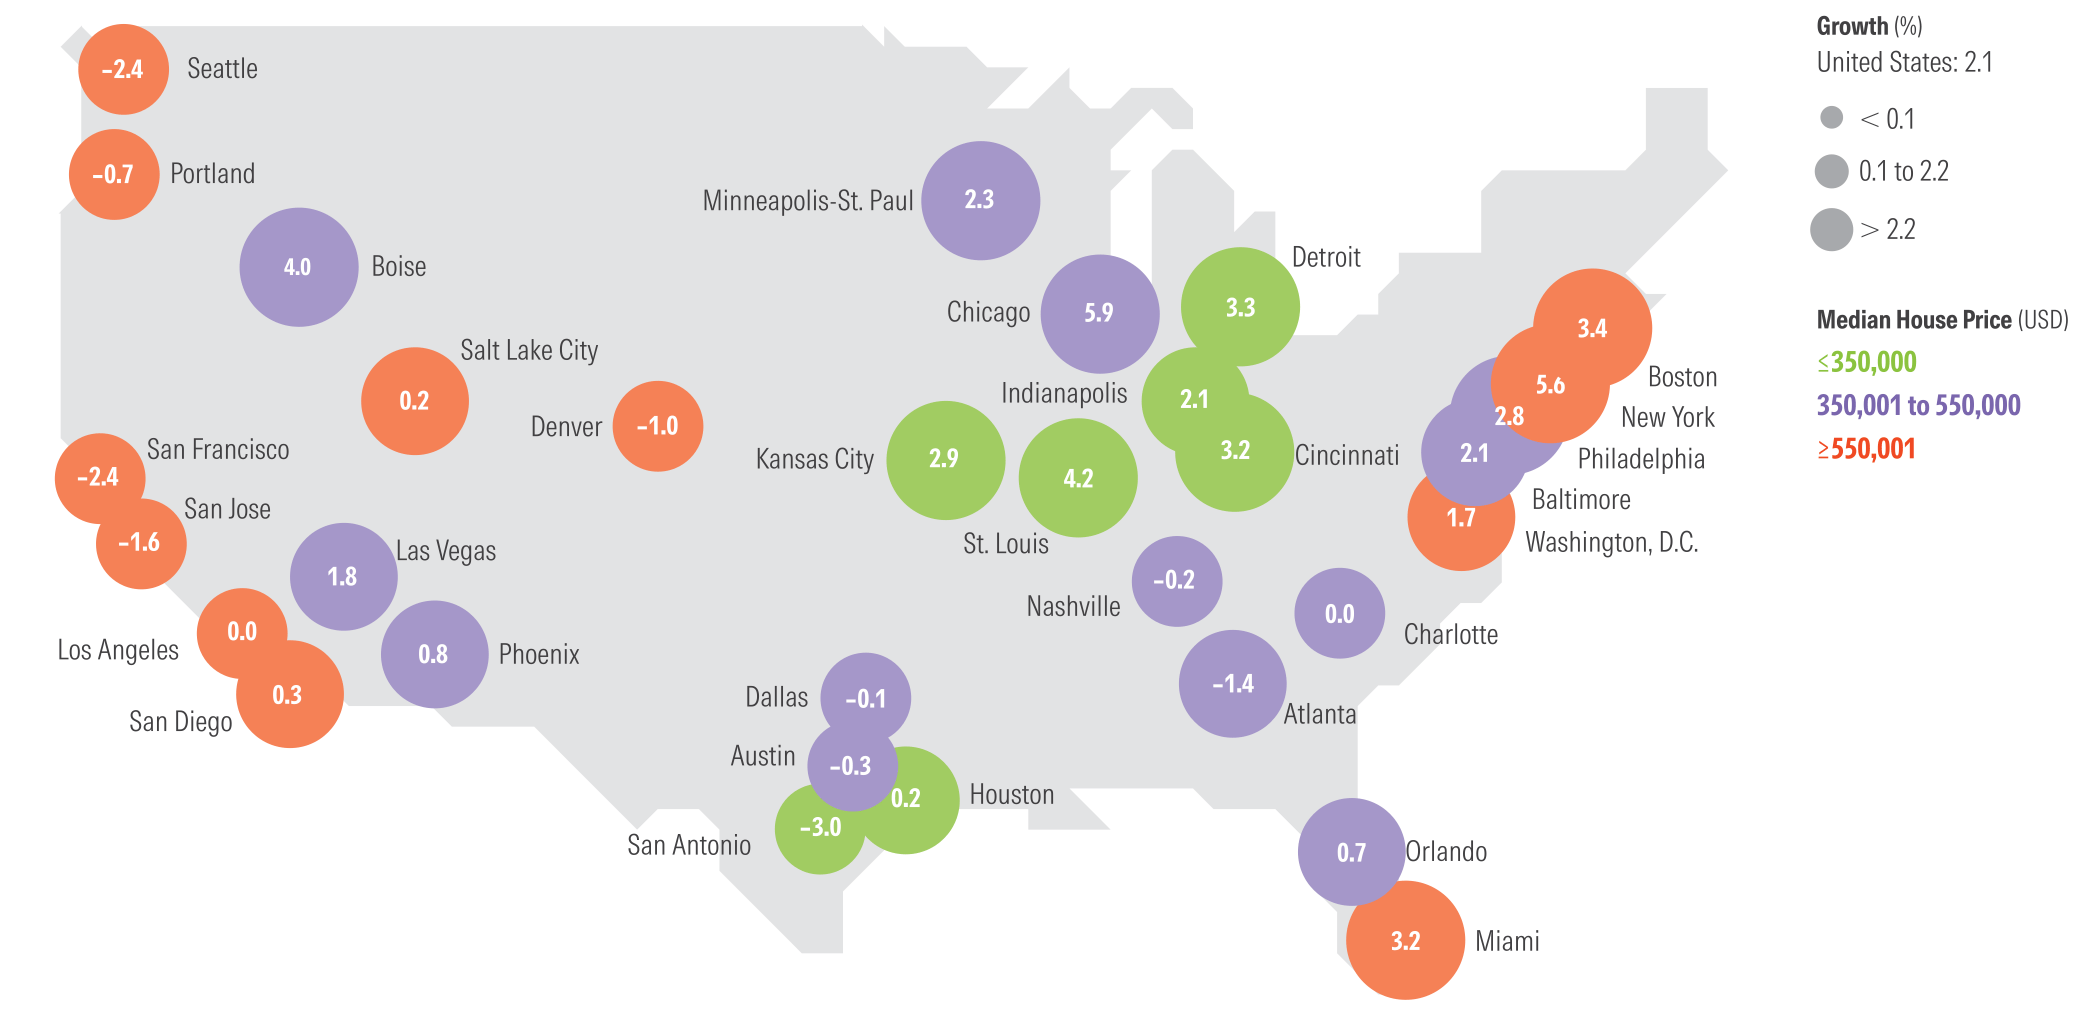
Source: National Association of Realtors, Federal Housing Finance Agency.
Contributors
- Natalia Arrigoni and Indira Fisher | Associate Analysts, Equity
- Mary Marshall | Associate Analyst, Multi-Asset
- Muhammad Hamza Saleem | Analyst, Investment Management
- Thomas Murphy | Associate Director, Fixed Income
- Vedran Beogradlija | Analyst, Multi-Asset
- Joe Bullard | Senior Analyst, Fixed Income
- Ken Noguchi | Analyst, Fixed Income
Index and Disclosure
“Morningstar” is used throughout this section to refer to Morningstar, Inc, and/or its affiliates, as applicable. Unless otherwise provided in a separate agreement, recipients of this report may only use it in the country in which the Morningstar distributor is based. Unless stated otherwise, the original distributor of the report is Morningstar Research Services LLC, a USA-domiciled financial institution.
This report is for informational purposes only, should not be the sole piece of information used in making an investment decision, and has no regard to the specific investment objectives, financial situation, or particular needs of any specific recipient. This publication is intended to provide information to assist investors in making their own investment decisions, not to provide investment advice to any specific investor. Therefore, investments discussed and recommendations made herein may not be suitable for all investors; recipients must exercise their own independent judgment as to the suitability of such investments and recommendations in the light of their own investment objectives, experience, taxation status, and financial position.
The information, data, analyses, and opinions presented herein are not warranted to be accurate, correct, complete, or timely. Unless otherwise provided in a separate agreement, neither Morningstar, Inc. nor the Research Group represents that the report contents meet all of the presentation and/or disclosure standards applicable in the jurisdiction the recipient is located.
Except as otherwise required by law or provided for in a separate agreement, the analyst, Morningstar, Inc, and the Research Group and their officers, directors, and employees shall not be responsible or liable for any trading decisions, damages, or other losses resulting from, or related to, the information, data, analyses, or opinions within the report. The Research Group encourages recipients of this report to read all relevant issue documents—a prospectus, for example—pertaining to the security concerned, including without limitation, information relevant to their investment objectives, risks, and costs before making an investment decision and, when deemed necessary, to seek the advice of a legal, tax, and/or accounting professional.
The report and its contents are not directed to, or intended for distribution to or use by, any person or entity who is a citizen or resident of or located in any locality, state, country, or other jurisdiction where such distribution, publication, availability, or use would be contrary to law or regulation or that would subject Morningstar, Inc. or its affiliates to any registration or licensing requirements in such jurisdiction.
Where this report is made available in a language other than English and in the case of inconsistencies between the English and translated versions of the report, the English version will control and supersede any ambiguities associated with any part or section of a report that has been issued in a foreign language. Neither the analyst, Morningstar, Inc., nor the Research Group guarantees the accuracy of the translations.
This report may be distributed in certain localities, countries, and/or jurisdictions (*territories”) by independent third parties or independent intermediaries and/or distributors (*distributors”). Such distributors are not acting as agents or representatives of the analyst, Morningstar, Inc. or the Research Group. In territories where a distributor distributes our report, the distributor is solely responsible for complying with all applicable regulations, laws, rules, circulars, codes, and guidelines established by local and/or regional regulatory bodies, including laws in connection with the distribution of third-party research reports.
Risk Warning
Please note that investments in securities are subject to market and other risks and there is no assurance or guarantee that the intended investment objectives will be achieved. Past performance of a security may or may not be sustained in future and is no indication of future performance. A security investment return and an investor's principal value will fluctuate so that, when redeemed, an investor's shares may be worth more or less than their original cost.
A security's current investment performance may be lower or higher than the investment performance noted within the report. Morningstar's Uncertainty Rating serves as a useful data point with respect to sensitivity analysis of the assumptions used in our determining a fair value price.
Conflicts of Interest
No material interests are held by the analyst or their immediate family with respect to the securities subject of this investment research report.
- In general, Morningstar will not hold a material interest in the security subject of this report. If a material interest is held by Morningstar, or if Morningstar owns a net long or short position in the security that is the subject of this report that exceeds 0.5% of the total issued share capital of the security, it will be disclosed at: https://www.morningstar.com/company/disclosures/holdings
- Morningstar employees' compensation is derived from Morningstar's overall earnings and consists of salary, bonus and in some cases restricted stock.
- Neither Morningstar nor its analysts receive compensation or material benefits from product issuers or third parties in connection with this report.
- Morningstar's overall earnings are generated in part by the activities of the Investment Management and Research groups, and other affiliates, who provide services to product issuers. Morningstar does not receive commissions for providing research and does not charge issuers to be rated.
- Morningstar employees may not pursue business and employment opportunities outside Morningstar within the investment industry (including but not limited to, working as a financial planner, an investment advisor or investment professional representative, a broker-dealer or broker-dealer agent, a financial writer, reporter, or analyst) without the approval of Morningstar's Legal and if applicable, Compliance teams. Morningstar may provide the investment product issuer or its related entities with services or products for a fee and on an arm’s length basis including software products and licenses, research and consulting services, data services, licenses to republish our ratings and research in their promotional material, event sponsorship and website advertising.
- Certain managed investments use an index created by and licensed from Morningstar, Inc. as their tracking index. We mitigate any actual or potential conflicts of interest resulting from that by not producing qualitative analysis on any such managed investment as well as imposing information barriers (both technology and non-technology) where appropriate and monitoring by the compliance department.
- Morningstar's Investment Management group has arrangements with financial institutions to provide portfolio management/investment advice, some of which an analyst may issue investment research reports on. In addition, the Investment Management group creates and maintains model portfolios whose underlying holdings can include financial products, including securities that may be the subject of this report. However, analysts do not have authority over Morningstar's Investment Management group's business arrangements nor allow employees from the Investment Management group to participate or influence the analysis or opinion prepared by them.
- Morningstar, Inc. is a publicly traded company (Ticker Symbol: MORN) and thus a security which is the subject of this report may own more than 5% of Morningstar, Inc.'s total outstanding shares. Please access Morningstar, Inc.'s most recent Proxy Statement and refer to the section titled "Security Ownership of Certain Beneficial Owners and Management" at: https://shareholders.morningstar.com/investorrelations/financial/sec-filings/default.aspx. A security's holding of Morningstar stock has no bearing on and is not a requirement for which securities Morningstar determines to cover.
Further information on Morningstar, Inc.'s conflict of interest policies is available from:
https://shareholders.morningstar.com/investor-relations/governance/Compliance-Disclosure/default.aspx
Also, please note analysts are subject to the CFA Institute's Code of Ethics and Standards of Professional Conduct.
For a list of securities which the Manager Research Group currently covers and provides written analysis on please contact your local Morningstar office. In addition, for historical analysis of securities covered, including their fair value estimate, please contact your local office.
For current Morningstar clients, please reach out to your respective Client Success Manager for more information on how you can best leverage this research within your firm. For all others, please reach out to our business development team at dtainsidesales@morningstar.com to learn more about Morningstar's various offerings and more details about how you can leverage this research.
For Recipients in Australia:
This Report has been issued and distributed in Australia by Morningstar Australasia Pty Ltd. (ABN: 95 006 654 445; AFSL: 240892). Morningstar Australasia Pty Ltd. is the provider of the general advice ("the Service") and takes responsibility for the production of this report. The Service is provided through the research of investment products. To the extent this Report contains general advice it has been prepared without reference to an investor's objectives, financial situation or needs. Investors should consider the advice in light of these matters and, if applicable, the relevant Product Disclosure Statement before making any decision to invest. Refer to our Financial Services Guide, or FSG, for more information at http://www.morningstar.com.au/fsg.pdf.
For Recipients in New Zealand:
This report has been issued and distributed by Morningstar Australasia Pty Ltd and/or Morningstar Research Ltd (together "Morningstar"). This report has been prepared and is intended for distribution in New Zealand to wholesale clients only and has not been prepared for use by New Zealand retail clients (as those terms are defined in the Financial Markets Conduct Act 2013).
The information, views and any recommendations in this material are provided for general information purposes only, and solely relate to the companies and investment opportunities specified within. Our reports do not take into account any particular investor's financial situation, objectives or appetite for risk, meaning no representation may be implied as to the suitability of any financial product mentioned for any particular investor. We recommend seeking financial advice before making any investment decision.
For recipients in Canada:
This research is not prepared subject to Canadian disclosure requirements.
For recipients in Europe:
This report is distributed by Morningstar Holland B.V. a wholly owned subsidiary of Morningstar, Inc. Morningstar Holland B.V. is not required to be regulated by the European Securities and Markets Authority for the provision of investment research data. The analysts involved in the creation of the report do not take into account any particular investor's financial situation, objectives, or appetite for risk, meaning no representation may be implied as to the suitability of any financial product mentioned for any particular investor. Registered address: Haaksbergweg 58, 9th Floor, 1101 82 Amsterdam, North Holland, Netherlands.
For recipients in India:
This report is issued by Morningstar Investment Research India Private Limited (formerly known as Morningstar Investment Adviser India Private Limited). Morningstar Investment Research India Private Limited is registered with SEBI as an Investment Adviser (Registration number INA000001357), as a Portfolio Manager (Registration number INP000006156) and as a Research Entity (Registration Number INH000008686). Morningstar Investment Research India Private Limited has not been the subject of any disciplinary action by SEBI or any other legal/regulatory body. Morningstar Investment Research India Private Limited is a wholly owned subsidiary of Morningstar Investment Management LLC. In India, Morningstar Investment Research India Private Limited has one associate, Morningstar India Private Limited, which provides data-related services, financial data analysis, and software development. The Research Analyst has not served as an officer, director, or employee of the fund company within the last 12 months, nor has it or its associates engaged in market-making activity for the fund company.
For Recipients in Hong Kong:
The report is distributed by Morningstar Investment Management Asia Limited, which is regulated by the Hong Kong Securities and Futures Commission to provide investment research and investment advisory services to professional investors only. Neither Morningstar Investment Management Asia Limited, nor its representatives, are acting or will be deemed to be acting as an investment advisor to any recipients of this information unless expressly agreed to by Morningstar Investment Management Asia Limited.
For Recipients in Japan:
This report is distributed by Morningstar Japan, Inc. for informational purposes only. Neither Morningstar Japan, Inc. nor its representatives are acting or will be deemed to be acting as an investment advisor to any recipients of this information.
For recipients in Korea:
The report is distributed by Morningstar Korea Ltd., which has filed to Financial Supervisory Service, for informational purposes only. Neither Morningstar Korea Ltd., nor its representatives, are acting or will be deemed to be acting as an investment advisor to any recipients of this information.
For recipients in Singapore:
This report is distributed by Morningstar Investment Adviser Singapore Pte Limited, which is licensed and regulated by the Monetary Authority of Singapore to provide financial advisory services in Singapore. Recipients of this report should contact their financial advisor in Singapore in relation to this report. Morningstar, Inc., and its affiliates rely on certain exemptions (Financial Advisers Regulations, Section 27(1)(e), Section 32, Band 32C) to provide its investment research to recipients in Singapore.
For recipients in the United Kingdom:
This report is distributed by Morningstar UK Ltd, a wholly owned subsidiary of Morningstar, Inc. Morningstar UK Ltd. is not required to be registered nor authorized by the Financial Conduct Authority for the distribution of investment research data. The analyst/s involved in the creation of the report do not take into account any particular investor’s financial situation, objectives, or appetite for risk, meaning no representation may be implied as to the suitability of any financial product mentioned for any particular investor. There are information barriers in place between Morningstar UK Ltd and Morningstar regulated entities based in the UK. Registered address: 1 Oliver’s Yard 55-71 City Road London EC1Y 1HQ.
About Morningstar Manager Research
About Morningstar Manager Research
Morningstar’s global manager research team conducts objective, qualitative analysis of managed investment strategies such as mutual funds and exchange-traded funds. Manager research analysts express their views through the Morningstar Medalist Rating, which takes the form of Gold, Silver, Bronze, Neutral, or Negative. The analysts arrive at a strategy’s Medalist Rating by assessing key areas including its management team and supporting resources (People Pillar), its investment approach and rationale (Process Pillar), and the investment organization backing the strategy concerned (Parent Pillar). The analysts juxtapose those assessments with the strategy’s cost in arriving at a final Analyst Rating, which expresses their conviction in the strategy’s ability to outperform a relevant benchmark index or category peers over a market cycle, adjusted for risk. The Morningstar Medalist Rating methodology is forward-looking in nature and applied consistently across geographies and markets. (The Medalist Rating is an opinion, not a statement of fact, and is not intended to be nor is a guarantee of future performance.)
About Morningstar Manager Research Services
Morningstar Manager Research Services combines the firm's fund research reports, ratings, software, tools, and proprietary data with access to Morningstar's manager research analysts. It complements internal due-diligence functions for institutions such as banks, wealth managers, insurers, sovereign wealth funds, pensions, endowments, and foundations. Morningstar’s manager research analysts are employed by various wholly owned subsidiaries of Morningstar, Inc. including but not limited to Morningstar Research Services LLC (USA), Morningstar UK Ltd, and Morningstar Australasia Pty Ltd.
©2026 Morningstar. All Rights Reserved. Unless otherwise provided in a separate agreement, you may use this report only in the country in which its original distributor is based. The information, data, analyses, and opinions presented herein do not constitute investment advice; are provided solely for informational purposes and therefore are not an offer to buy or sell a security; and are not warranted to be correct, complete, or accurate. The opinions expressed are as of the date written and are subject to change without notice. Except as otherwise required by law, Morningstar shall not be responsible for any trading decisions, damages, or other losses resulting from, or related to, the information, data, analyses, or opinions or their use. The information contained herein is the proprietary property of Morningstar and may not be reproduced, in whole or in part, or used in any manner, without the prior written consent of Morningstar. To order reprints, call +1 312-696-6100. To license the research, call +1 312 696-6869.