
5 min read
The Advisor’s Cheat Sheet to Recession Indicators
The stock market staved off a downturn in the second quarter, powered by falling oil prices and refreshed AI sentiment.

Economists often use imperfect historical information to form opinions about the economy’s direction. We often don’t know we’re in a recession until it’s well underway because the National Bureau of Economic Research adjusts the start date of a recession after the fact.
However, that doesn’t mean recessions have to catch advisors and clients by surprise. By monitoring potential signs of a recession, advisors can understand the direction of the economy and chart an appropriate course for their clients.
Here’s what Morningstar evaluates and where recession indicators stand. To get 40 pages’ worth of charts and graphs showing how the economy is trending, download the full Markets Observer report.
What Are the Top Indicators of an Economy Recession?
Here are a few signals economists track to understand economic activity.
- Interest rates can indicate a recession in multiple ways. If interest rates rise too quickly or remain high for too long, it can slow economic growth and potentially lead to a recession. On the other hand, if the Federal Reserve begins cutting rates, it can be seen as an attempt to stimulate the economy in response to recessionary pressures.
- An inverted yield curve refers to when short-term bond yields climb above longer-term ones. This indicates an expectation of lower interest rates, and thus lower growth and inflation down the road. Inverted yield curves tend to precede recessions.
- Credit spreads show the yield difference between two fixed-income investments with the same maturity but different credit qualities. Negative credit spreads have predicted recessions historically, but it’s hard to pinpoint the exact start date, severity, or duration.
- Decline in real GDP: Consumers tend to tighten their belts in response to economic uncertainty. That could lead to lower economic output, layoffs, and economic contraction.
- High inflation reduces consumer spending power and the Federal Reserve may raise rates to keep inflation in check. However, hiking rates too aggressively can lead to a recession as consumers rein in spending.
- New housing starts and home prices: In a recession, home sales often decrease, which can lead to a decline in housing prices. But a recession isn’t the sole cause.
Where Do Recession Indicators Point Today?
The US market pulls back amid the Iran War
US equities continued their growth through June 2026, bringing the current expansion to 30 months.
The US stock market staved off a downturn with strong second-quarter returns reversing the first quarter's decline. Falling oil prices and refreshed AI sentiment helped power US stocks ahead.
The US market gained 33% annualized and 104.1% total since 2022's downturn.
The chart below compares the downturns, recoveries, and expansions with recessions, the latter based on National Bureau of Economic Research data.
US Market Downturns, Recoveries, and Expansions
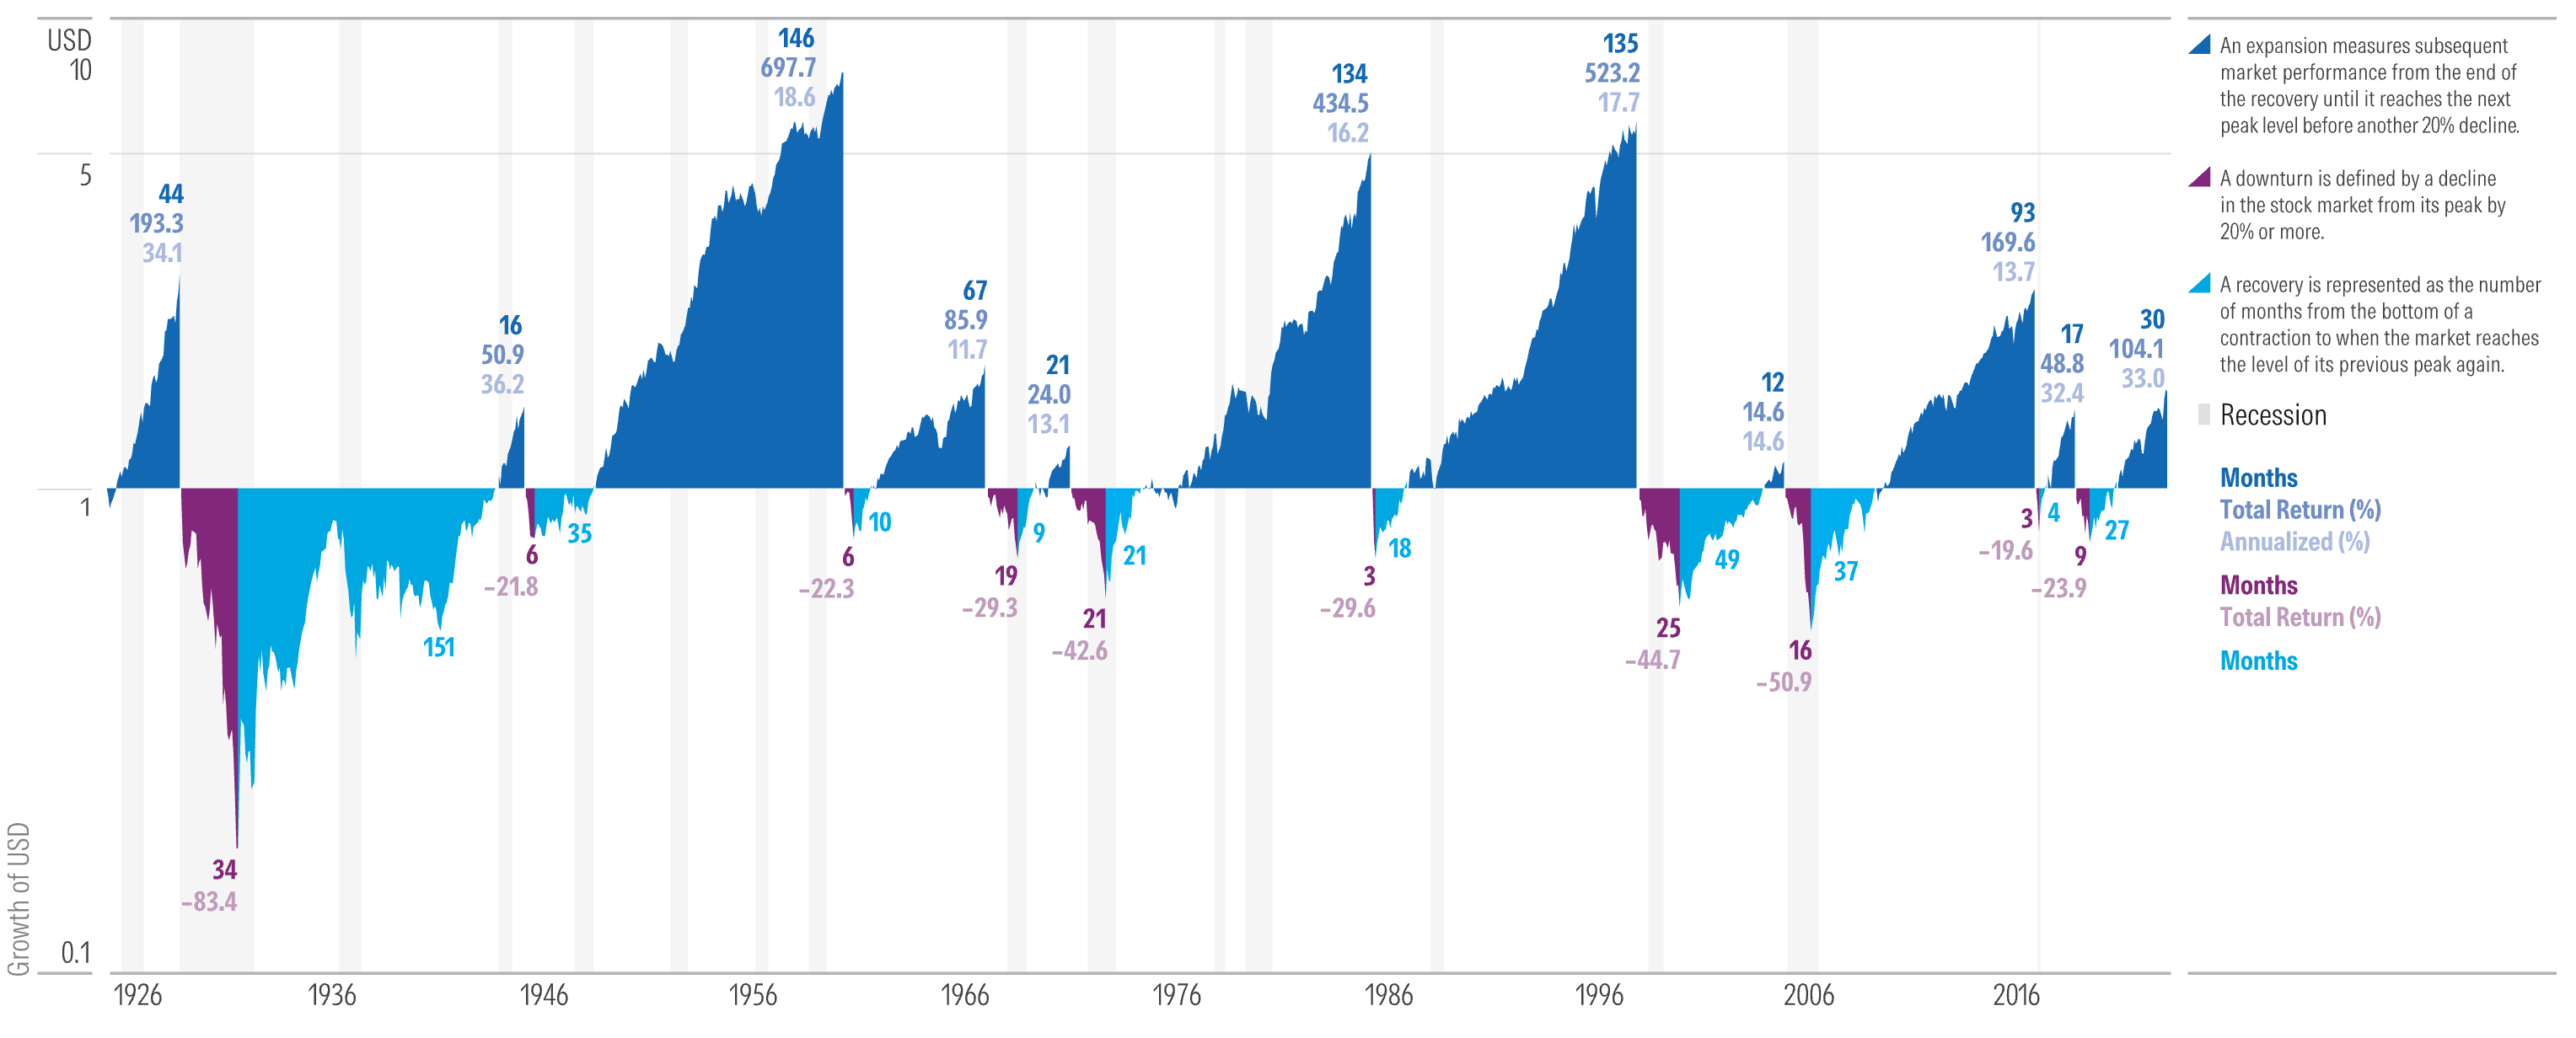
Source: Stocks—Ibbotson Associates SBBI US Large Stock Index. Recession data from the National Bureau of Economic Research (NBER). Data as of June 30, 2026.
Interest rates: The Fed will hike once in 2026, but resume cuts in 2027
Fed officials’ thinking has pivoted in a hawkish direction, and we now expect one federal-funds rate hike this year. But we expect five rate cuts over 2027-28, driving the federal-funds rate down to 2.5-2.75% by the end of 2028, a net 1 percentage point lower than current levels.
This should help push longer-term interest rates down further, with the 10-year Treasury yield dropping to 3.25% by 2029. Lower rates will be needed to support continued healthy economic growth.
Interest rates affect the interest earned on certificates of deposit, high-yield savings accounts, and money market accounts. Despite a possible pause, the Fed has indicated they will continue to cut rates in the future, and advisors should prepare clients for how this may affect their portfolios.
The yield curve shifted higher in the second quarter
The yield curve is not inverted, which does not signal a pending recession.
Persistent interest rate volatility and inflation concerns pivoted market expectations from multiple interest rate cuts in late 2026 to pricing in the probability of further tightening and federal funds rate hikes.
Treasury yields increased, with the short end of the curve increasing more than the long end, causing the yield curve to flatten.
A flatter yield curve suggests moderated expectations for future growth. However, investors may be able to find medium-duration bonds that offer comparable yield to longer-dated ones without the same level of duration risk.
The current yield curve may present income opportunities for investors, so advisors should evaluate current fixed-income allocations for a balance of yield and interest-rate risk.
Corporate credit spreads remained at historically tight levels
Tight corporate credit spreads can signal the broader economy’s health and investor confidence in credit markets.
Despite elevated market uncertainty, corporate credit spreads remained at historically tight levels on account of continued economic stability and strong corporate fundamentals. Corporate bond issuance has also slowed as the rise of private credit has diverted capital away from public bond markets.
Meanwhile, investor demand for yield remains strong as investors have poured into high-quality bonds. This supply-demand imbalance has been a key driver of spread compression.
We forecast GDP growth to reaccelerate in 2029 while inflation recedes
We’re still expecting US GDP growth to slow a bit further through 2028, owing to decelerating AI spending, slower population growth, the ongoing drag from high interest rates, and other factors.
Inflation should recede given the fading oil and tariff shocks as well as meager wage growth, which would boost consumer purchasing power. Monetary easing drives a rebound in GDP growth over 2029-2030.
Advisors can use these resources to help navigate client questions about inflation and ease concerns.
US home price appreciation remains weak
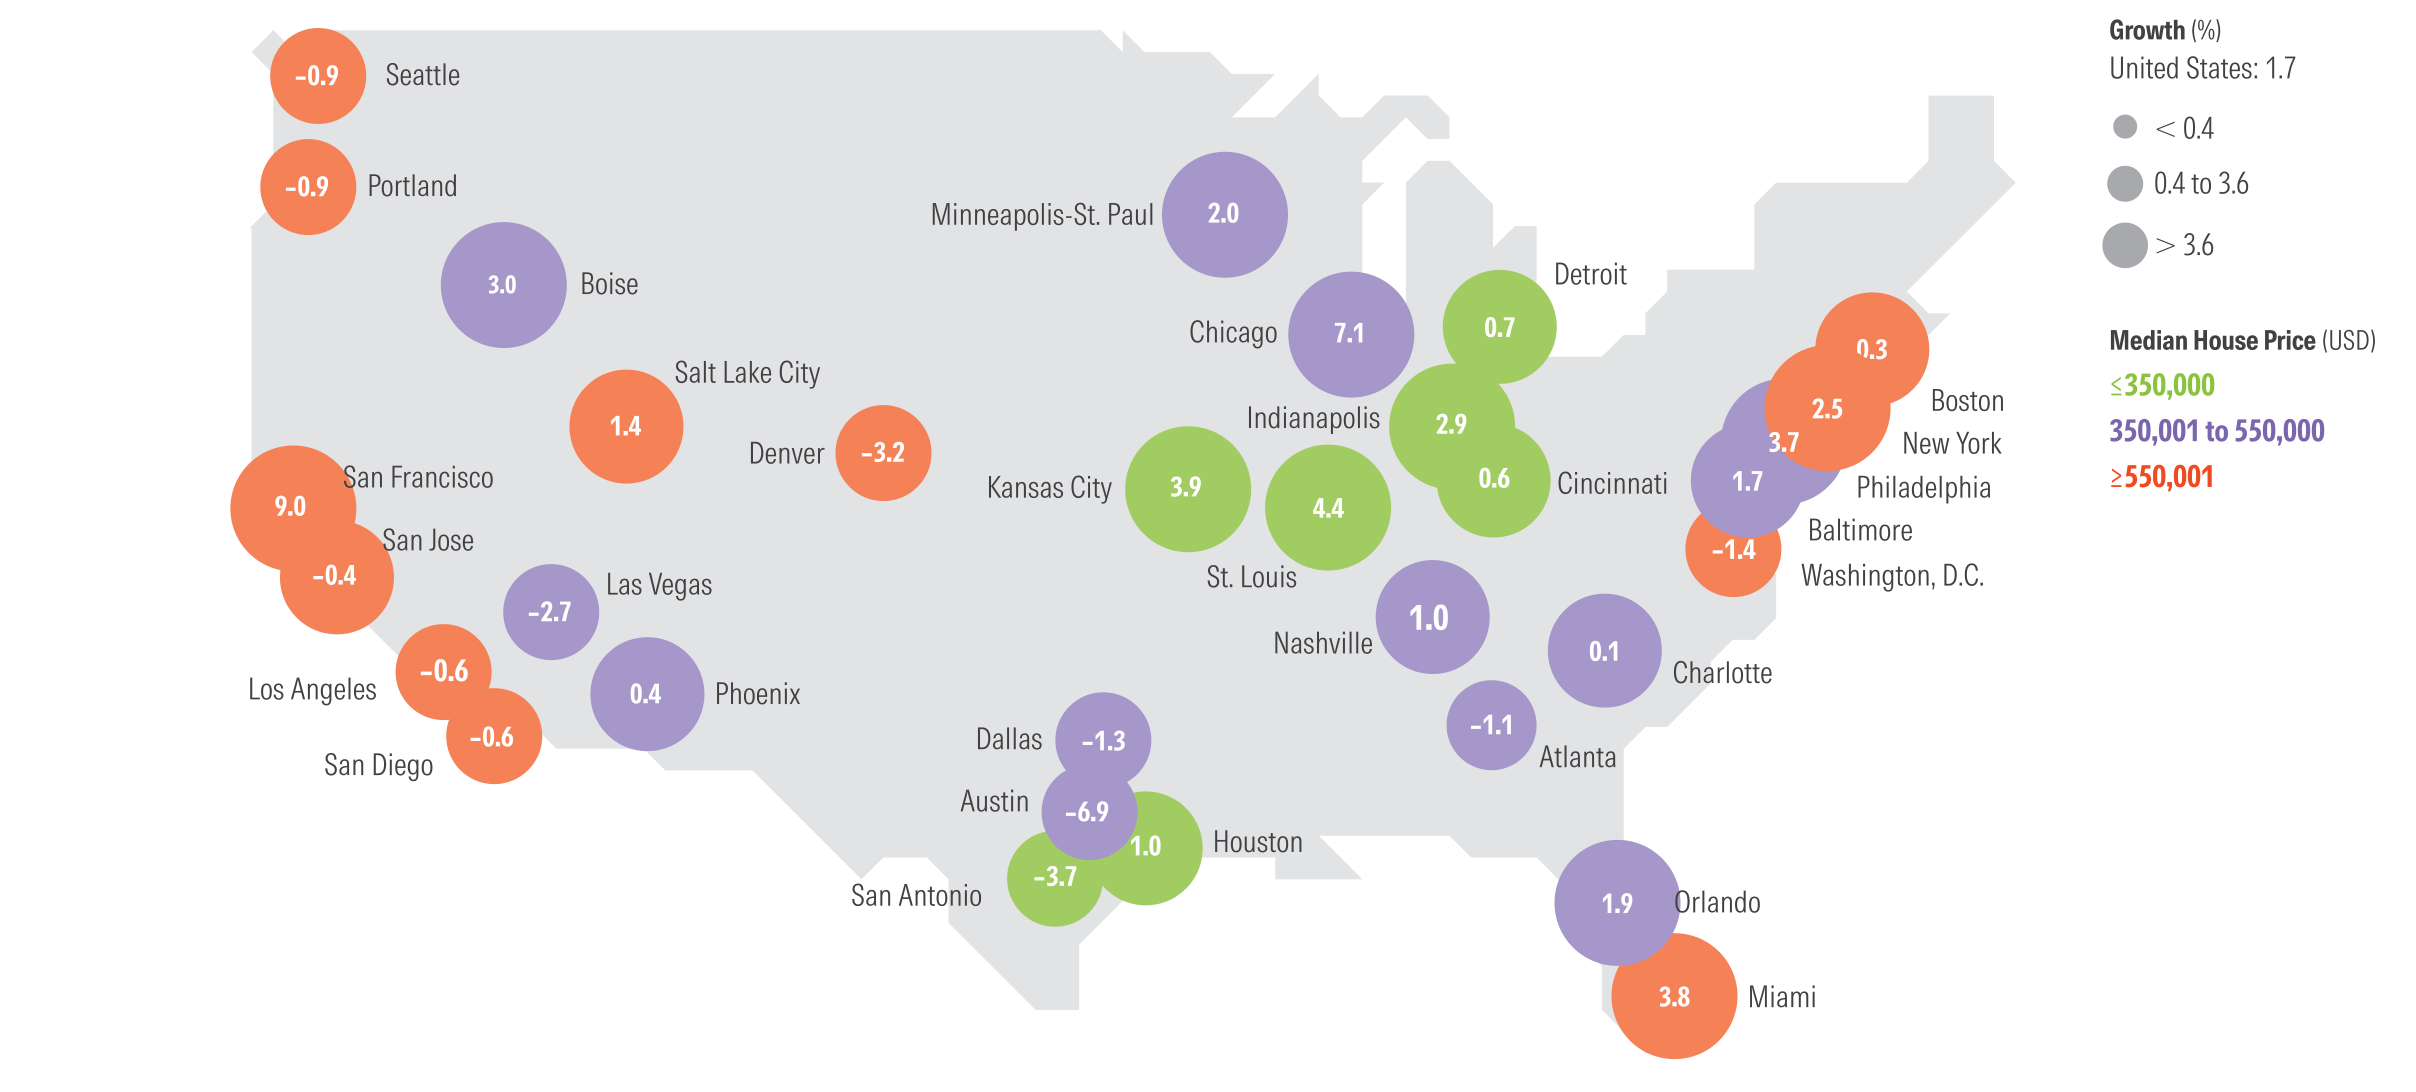
Home price growth has continued to weaken, standing at 1.7% year over year as of the first quarter of 2026, down from 2.9% average growth in 2025 and 5.4% in 2024.
The deceleration in home price growth has been broad, while Midwestern markets were more resilient. Sunbelt markets continue to see weak or negative growth owing to vigorous building in response to the postpandemic runup in prices.
Year-Over-Year Price Growth (%) Q1 2026
Other economic uncertainties aside, some consumers may be on the hunt for a new home. Here’s how to make that purchase work in today’s market.
What Should Advisors Do in a Recession?
Diversified portfolios should help clients reach their long-term goals and withstand downturns in the meantime. That perspective isn’t always reassuring for clients worried about a recession.
Our behavioral finance researchers created a checklist for guiding clients through a recession.
- Be the go-to source for advice. Create content to answer common client questions in simple terms. Then share through meetings, emails, and social media.
- Gauge client expectations. Remind overly optimistic clients that market downturns are inevitable and unrealistic expectations could lead to panic. Remind pessimistic clients about the value of staying the course.
- Create concrete action plans. Ask clients to identify triggers that might cause them to tinker with portfolios. Ask them to create an “If, then” list to identify what to do if those triggers happen, then sign it to commit to the plan.
For a deeper dive into our outlook for the US economy, including detailed forecasts on GDP growth, inflation, unemployment, and sector-specific trends, explore our comprehensive US Economic Outlook report.