
8 min read
Global Sustainable Fund Assets Reach New High in Q2 2026

This report examines recent activity in the global sustainable fund universe and details regional flows, assets, and product launches during the second quarter of 2026.
Owing to reporting lags, Australia and New Zealand data cover the period through May 31, 2026, while China’s second-quarter flows are excluded, and its assets under management reflect the previous quarter-end figure. These timing differences affect all global figures presented in this report.
Download the full Q2 2026 Global Sustainable Fund Flows report for detailed regional analysis, asset manager rankings, sustainable fund launch trends, and market commentary from Morningstar Sustainalytics.
Global Assets Reach USD 3.7 Trillion
Global sustainable funds attracted an estimated USD 3.7 billion in net inflows in the second quarter of 2026, extending the rebound from the first quarter after a rough 2025.
The US turned positive after 14 straight quarters of outflows, while Canada, Japan, and Australia/NZ, along with most of Asia ex-China, continued to see outflows. Overall, the modest global gain masks a mixed regional picture, with the US recovery offsetting continued weakness elsewhere.
At the end of the second quarter of 2026, global sustainable fund assets reached USD 3.73 trillion, recovering from a decline to USD 3.5 trillion.
The global total should still be described as an estimate because China’s June AUM was not available, and the figure uses its March quarter-end assets. Australia/NZ data extends only through May.
Product Development Activity Remains Subdued
Product development activity in the sustainable funds space remained notably subdued in the second quarter of 2026, with 32 new sustainable funds launched globally.
The largest share of new launches came from Asia ex-Japan, where 16 new sustainable funds were incepted, while Europe contributed 13. Three new sustainable funds were launched in the US. No new funds were launched in Japan, Australia, or New Zealand in the second quarter.
Quarterly Global Sustainable Fund Launches
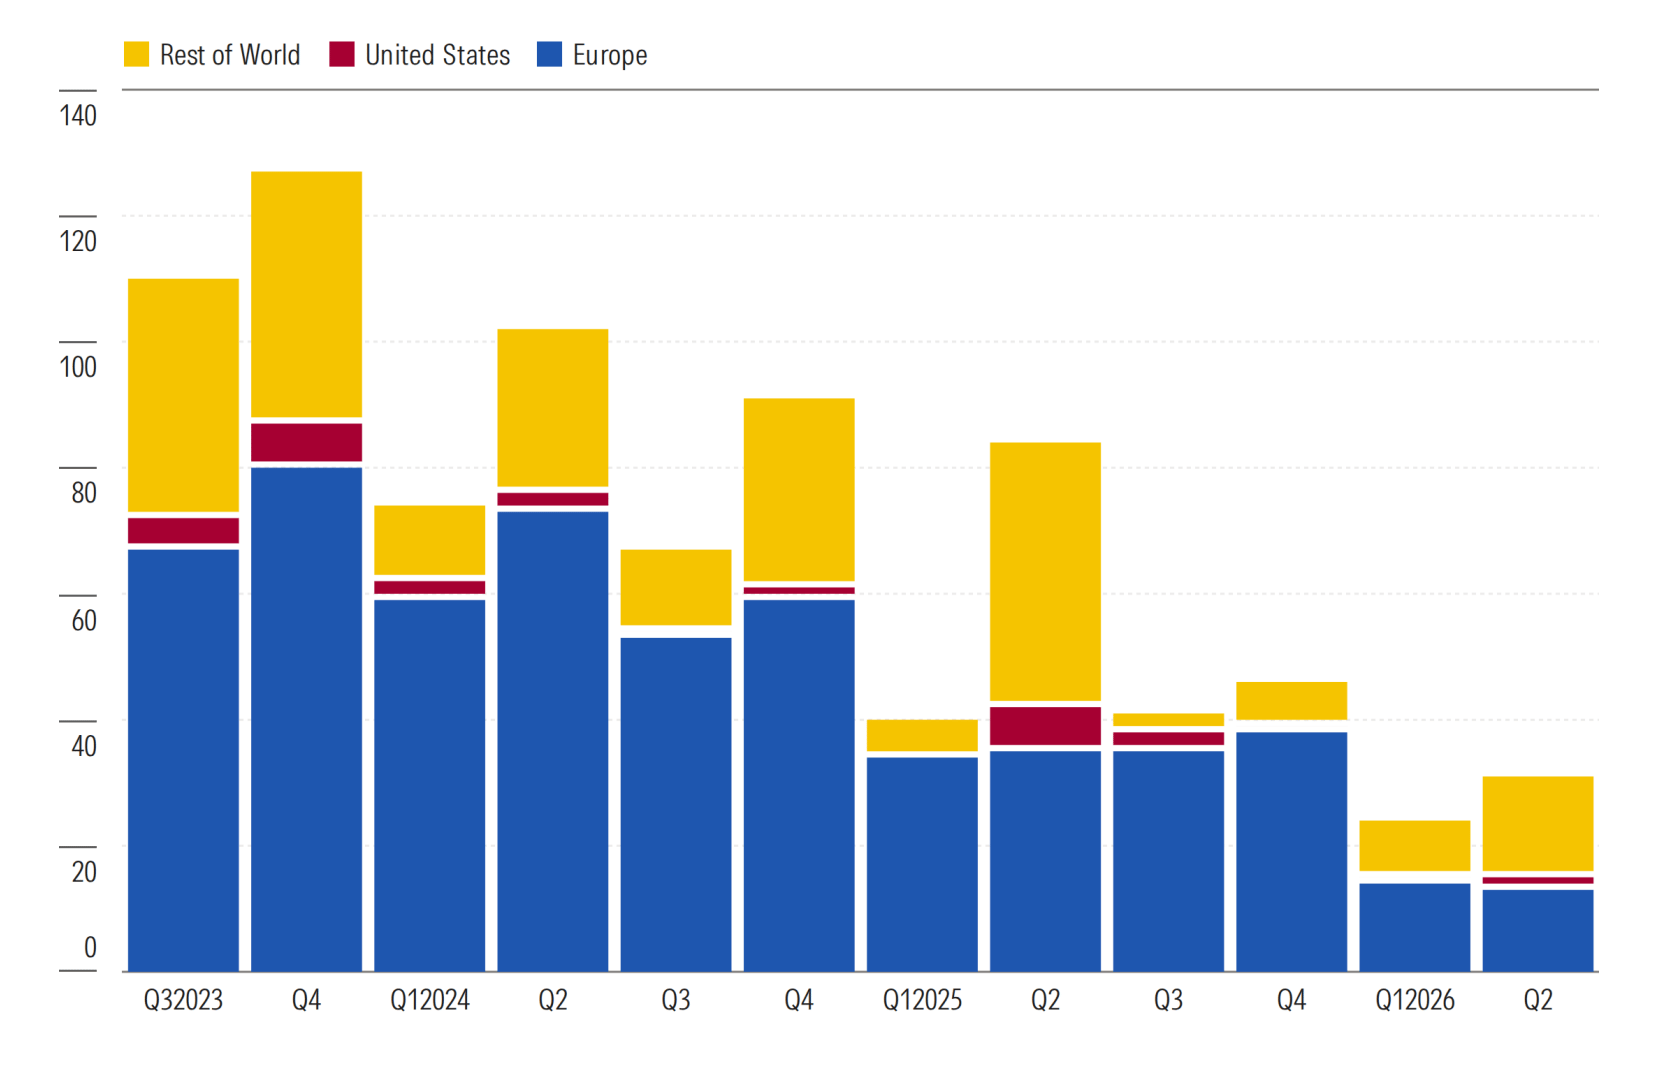
Source: Morningstar Direct. Data as of June 30, 2026.
European Sustainable Fund Flows Remain Positive in Q2
European-domciled sustainable funds remained in positive territory in the second quarter of 2026, attracting USD 3.5 billion in net inflows, following a restated USD 8.2 billion in the first quarter.
Passive strategies continued to drive demand, gathering USD 11.4 billion, while active funds recorded outflows of USD 7.8 billion.
European Sustainable Fund Flows by Investment Style USD Billion
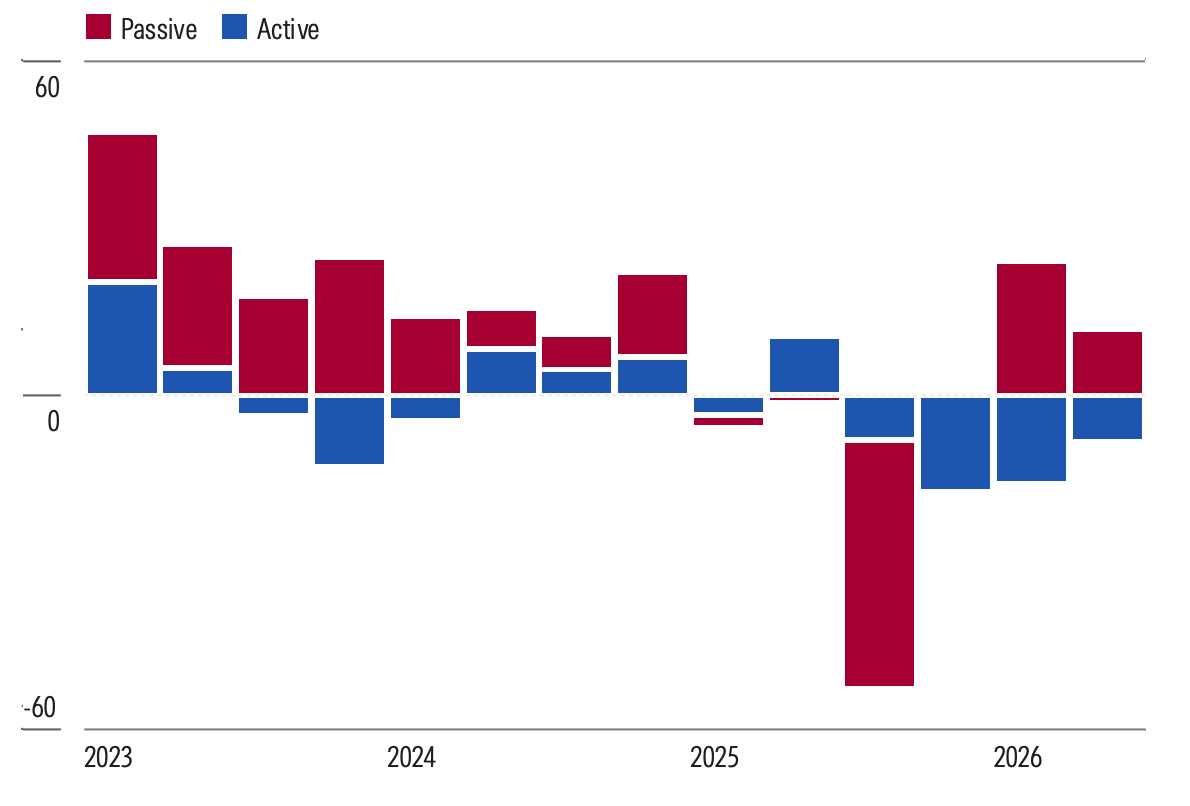
Source: Morningstar Direct. Data as of June 30, 2026. Flows exclude funds of funds.
By asset class, sustainable fixed-income funds led the way with USD 14.4 billion in net inflows, benefiting from the broader demand for bonds across the European fund market as geopolitical uncertainty weighed on risk appetite.
By contrast, sustainable equity funds shed USD 9.3 billion. This diverged from the wider equity market, where inflows remained strong but were overwhelmingly directed toward passive funds offering broad US, global, and technology exposure.
European Sustainable Fund Flows by Asset Class USD Billion
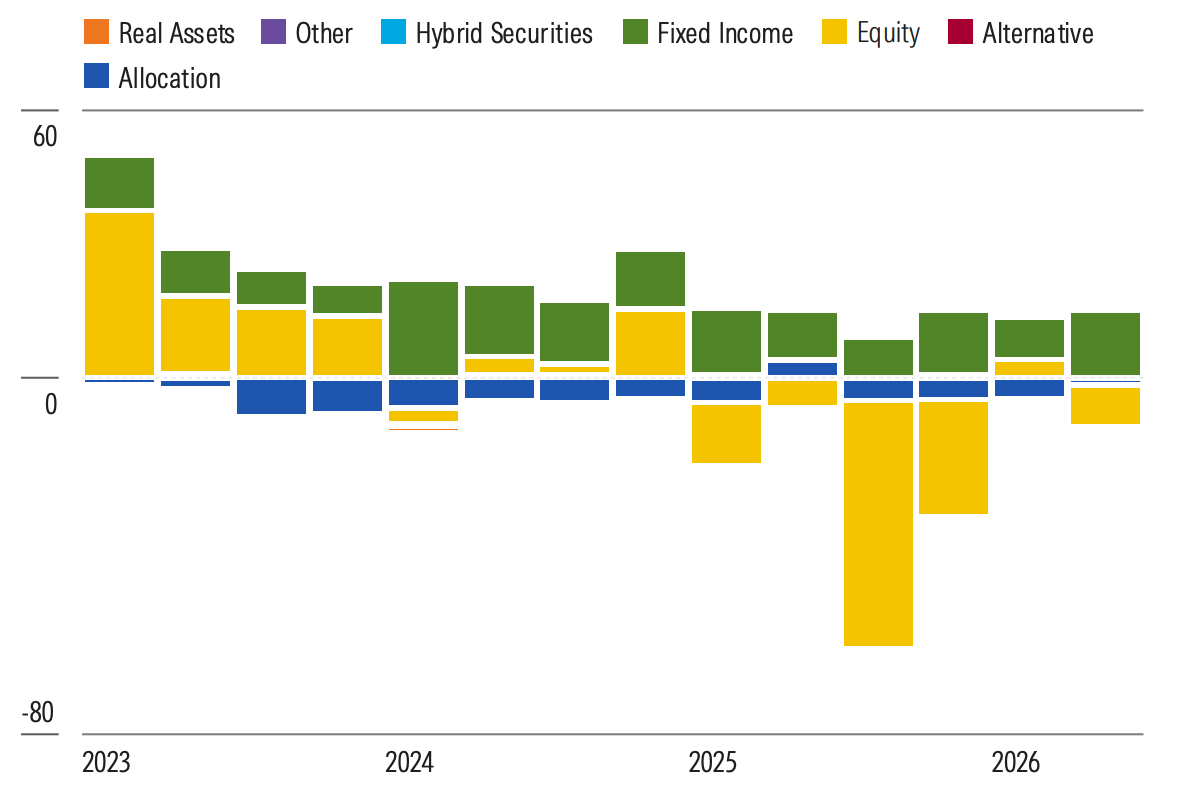
Source: Morningstar Direct. Data as of June 30, 2026. Flows exclude funds of funds.
Canadian Sustainable Fund Flows Turn Negative in the Second Quarter
Canadian sustainable funds recorded USD 481 million in net outflows in the second quarter, reversing USD 443 million in first-quarter inflows. Active funds drove the decline, while passive strategies attracted USD 534 million in net new money.
Net outflows spanned all major asset classes, with equity funds shedding USD 305 million. Fixed-income funds saw USD 127 million in net withdrawals, marking their first quarter of outflows since 2022.
Canadian Sustainable Fund Flows by Investment Style
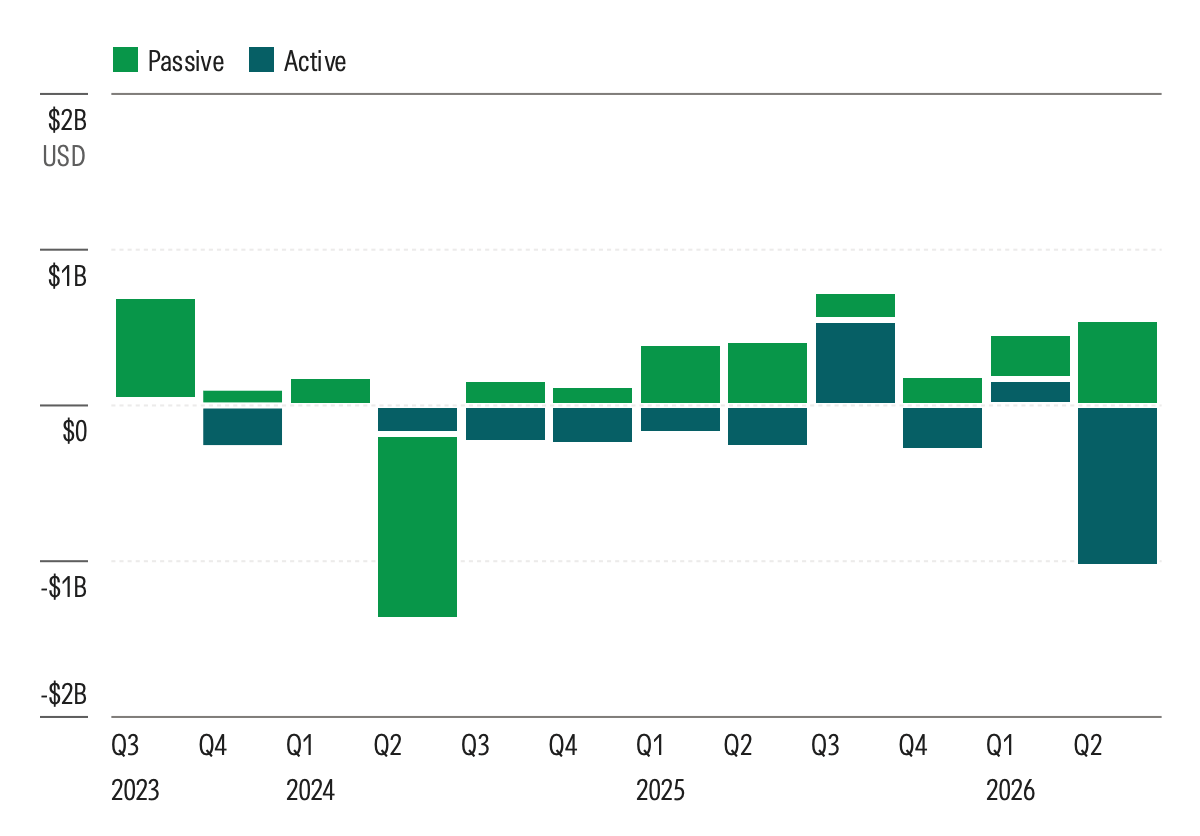
Source: Morningstar Direct. Data as of June 30, 2026.
Canadian Sustainable Fund Flows by Asset Class
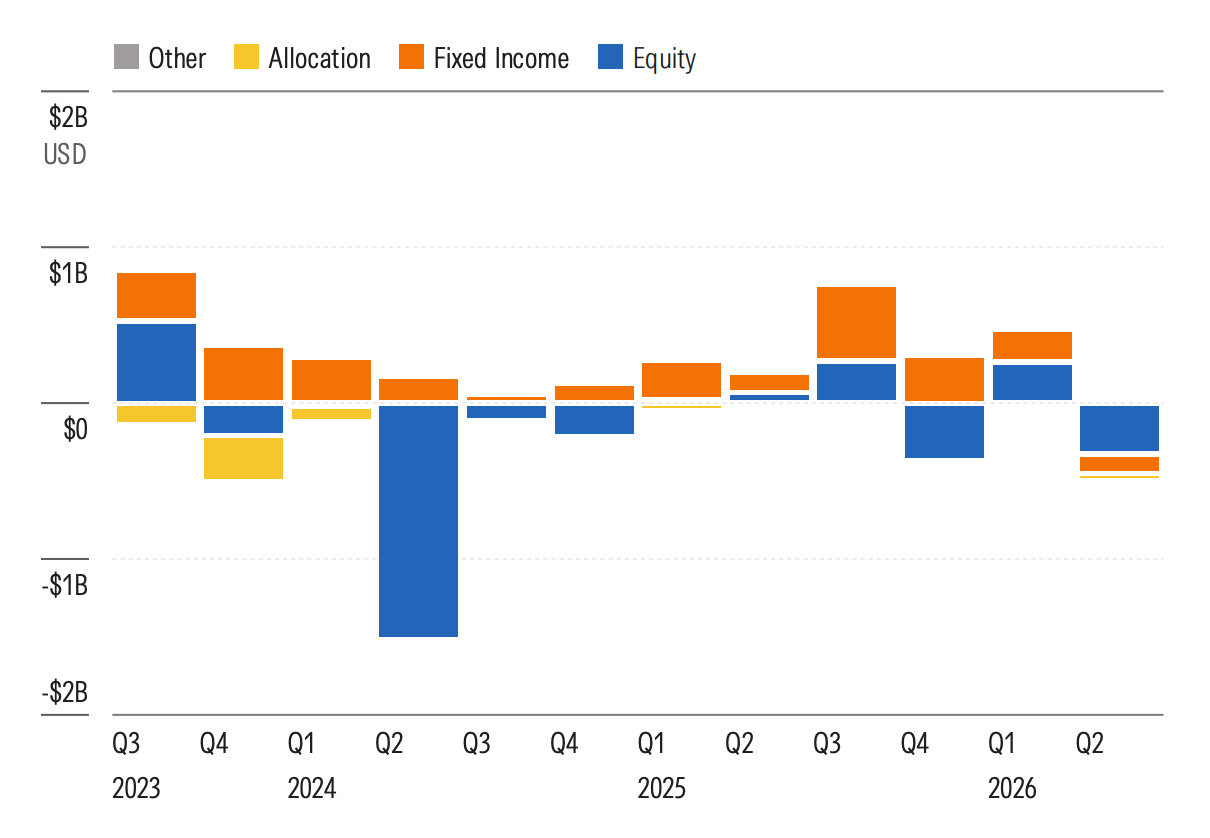
Source: Morningstar Direct. Data as of June 30, 2026.
Australasian Sustainable Funds Slip Back Into Outflows
Based on data available through May 2026 (second quarter 2026 to date), the Australasian sustainable funds universe (Australia/New Zealand) saw net outflows of almost USD 120 million. This broke the streak of the prior three quarters of net positive inflows.
Active funds were the casualties of negative net outflows, while passive funds continued to gain net inflows.
Australia/New Zealand Sustainable Fund Flows by Investment Style USD Million
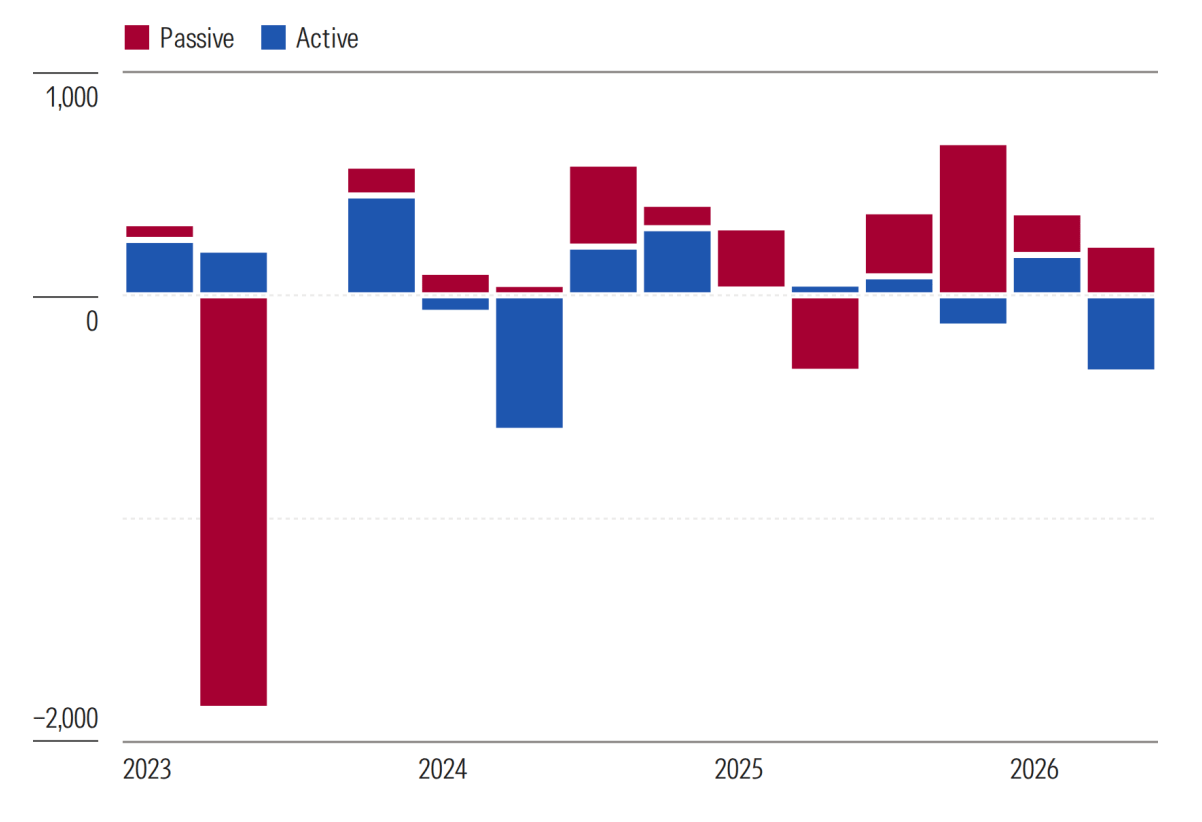
Source: Morningstar Direct. Data as of May 31, 2026. Second-quarter 2026 data includes April and May only.
Based on data available through May 2026, flows in Australasia were positive across two of the four major asset-class categories. Equity funds led the way with net inflows of around USD 45 million, followed by allocation funds with approximately USD 40 million.
Fixed-income and miscellaneous (including real assets) funds saw net outflows of USD 125 million and USD 80 million, respectively.
US Sustainable Fund Flows
US sustainable funds returned to positive territory in the second quarter of 2026, attracting nearly USD 3 billion in net inflows after 14 consecutive quarters of outflows. This translated into an organic growth rate of 0.8%.
Conventional funds also continued to attract strong investor demand, gathering USD 356 billion during the quarter, up from USD 337 billion in the previous quarter, corresponding to an OGR of 1.0%.
US Funds' Quarterly Flows—Sustainable Versus All US Funds
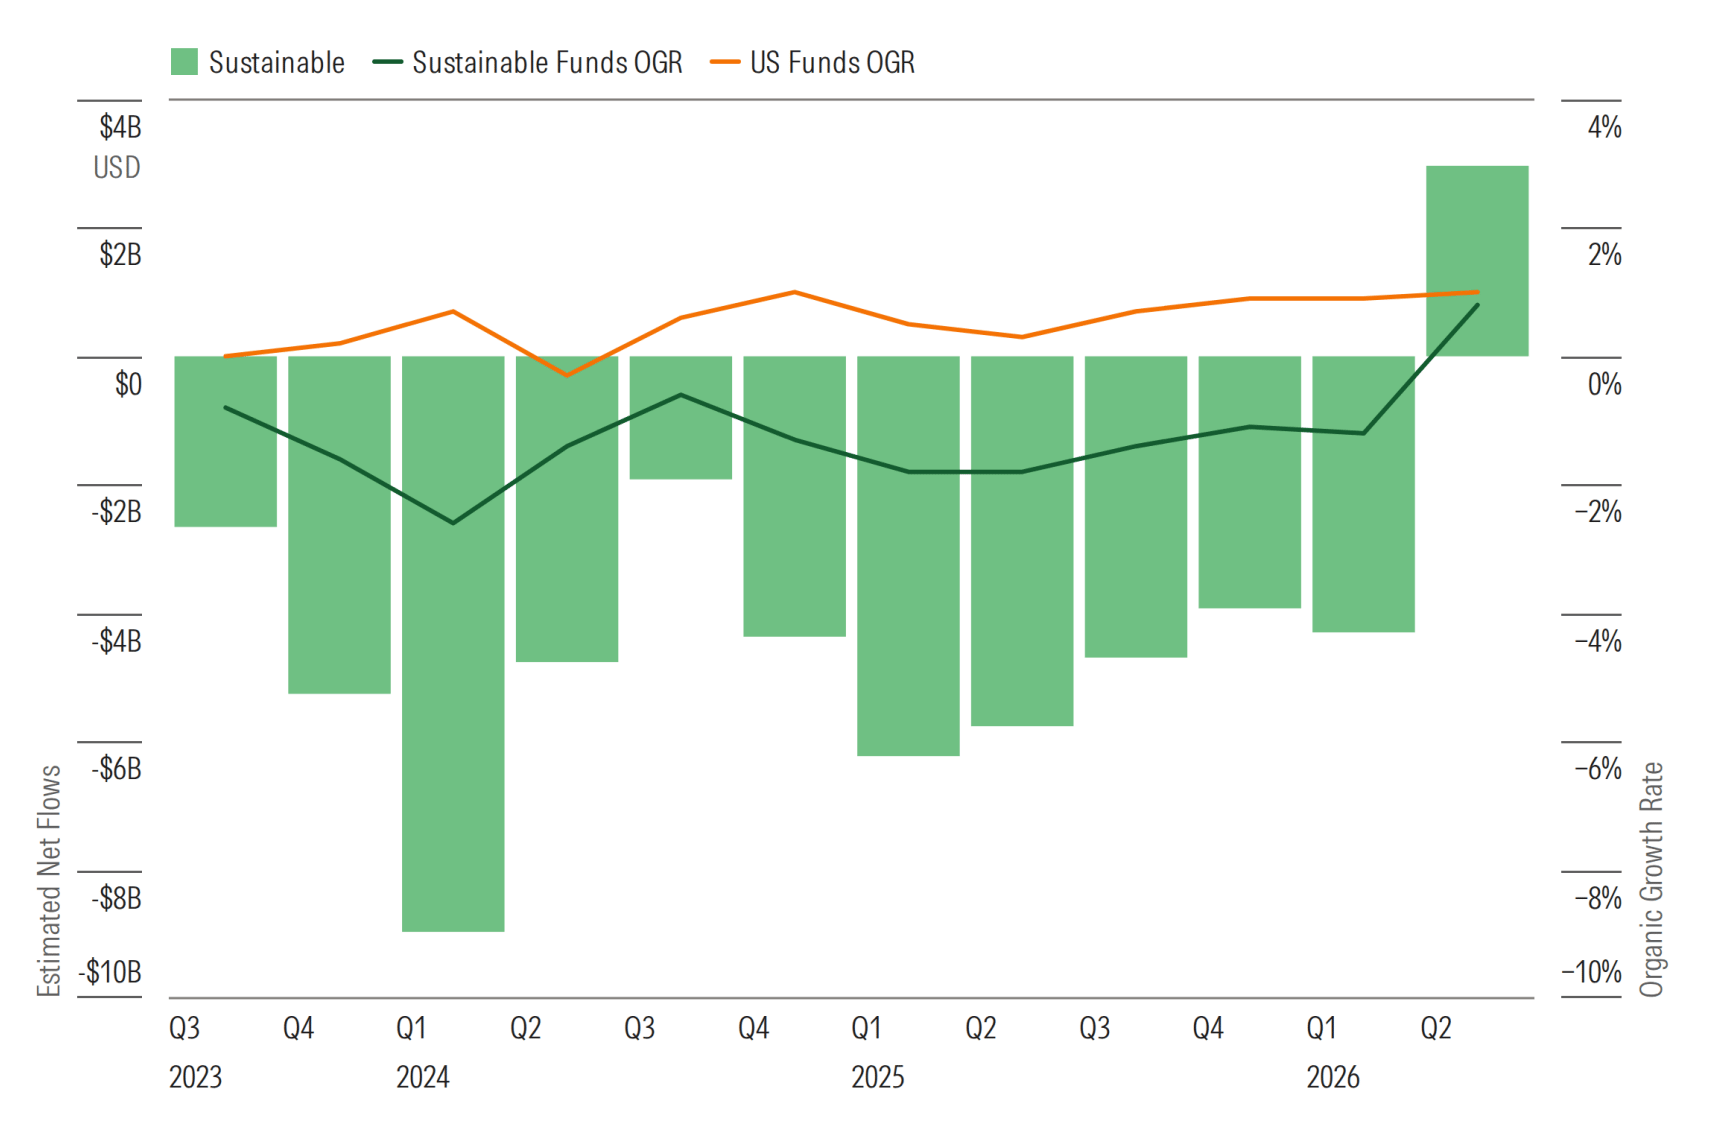
Source: Morningstar Direct. Data as of June 30, 2026. Flows and assets exclude funds of funds. The organic growth rate helps to put the magnitude of net flows into perspective. It measures net flows as a percentage of total assets at the start of a given period.
What Comes Next for Sustainable Investing?
Sustainable fund flows showed signs of recovery in the second quarter, but momentum remained uneven across regions and strategies.
Stronger US demand and continued growth in passive strategies helped offset outflows elsewhere, while market appreciation drove much of the increase in global assets. With product launches still subdued, the coming quarters will show whether the recent improvement in flows can develop into a broader and more durable recovery.
To explore the data in more detail, download the free Q2 2026 Global Sustainable Fund Flows report from Morningstar Sustainalytics.
The data evaluated in the report was generated in Morningstar Direct, a comprehensive application that helps asset and wealth managers conduct research, analyze investments, and manage portfolios. Start a free trial of Morningstar Direct today.