21 min read
2026 US Model Portfolio Landscape
Key Takeaways
- Third-party model portfolio assets were USD 934 billion as of the end of March 2026, a 46% increase over the trailing year and more than triple the amount of Morningstar’s first survey in June 2021.
- Model portfolios’ quick asset growth shows how important they have become to financial advisors’ practices.
- BlackRock remained the largest model portfolio provider with USD 308 billion, or one-third of total assets in models.
- Model portfolios gathered USD 42.6 billion of net inflows in 2025, a 42% increase over the prior year.
- BlackRock accumulated USD 24.2 billion of net inflows in 2025, more than half of total net flows, reinforcing its industry dominance.
- Capital Group, the second-largest model provider, reaped nearly USD 12 billion of net inflows.
- Model portfolios, like other investment services and vehicles, are mixing private and public assets more often.
- Nearly 70% of firms surveyed already offer or expect to offer model portfolios with private assets exposure.
- Interval funds are the clear vehicle of choice, while popular exposures include private credit, private real estate, and private equity.
Source: Morningstar data, survey data, author's calculations. Data as of March 31, 2026. Morningstar did not conduct a survey in 2024. *Includes data from Russell Investments and Columbia Threadneedle as of Dec. 31, 2025. **18 firms provided flows data for 2025 and 2024; 17 for 2023.
- Exchange-traded funds have become the vehicle of choice in model portfolios.
- ETFs occupied 55% of model allocations on average as of March 2026, up from 43% five years before.
- ETFs’ intraday liquidity and lower fees make them more appealing than mutual funds for financial advisors implementing model portfolios.
- Custom model portfolio assets continue to grow as advisors increasingly work with model providers to build more-tailored portfolios that better align with their clients’ unique needs and circumstances.
- Custom model assets totaled USD 258 billion at the end of March 2026, a 40% gain on the previous year.
- Key mechanics of customization include fund substitutions, adding/subtracting asset classes, and strategic asset-allocation tweaks.
- Model portfolios maintain their fee advantage over mutual funds. As of year-end 2025, model portfolios’ average 0.35% asset-weighted fee was lower than the average unbundled mutual fund’s 0.61%.
- Allocation models, which constitute much of the model portfolio universe, were about 0.25 percentage points cheaper, on average, versus the lowest-cost mutual funds in the five US-focused and five global-allocation Morningstar Categories. Model fees in this study do not include the advisor’s fee.
Source: Morningstar Direct, survey data, and author's calculations. Data as of March 31, 2026.
What Are Model Portfolios?
Model Portfolios at a Glance
This report focuses on model portfolios offered by asset managers or investment strategists for use as investment blueprints for financial advisors. It does not include home office models offered by wirehouses or broker/dealers since they are limited to those firms’ advisors.
- Advisors can implement models via third-party platforms or trade themselves following a paper version of the model.
- The table below shows a sample of platforms offering model portfolios. Services and offerings may differ among providers in each channel, and some platforms may not fit cleanly into one category. Providers of paper portfolios may have their models offered on platforms in the other four channels.
- Most model portfolios provide asset-allocation, fund selection, and trading guidance for target-risk strategies, though single-asset-class models also exist.
- Advisors can outsource or build model portfolios themselves, with customization as a middle ground between the two. (See the model portfolio spectrum below.)
- Different channels offer varying degrees of automation. Advisors following paper portfolios likely handle trading themselves and have more freedom to customize. Wirehouse-affiliated advisors and broker/dealers can automate those actions and may have fewer customization options.
Model Portfolio Degree of Automation
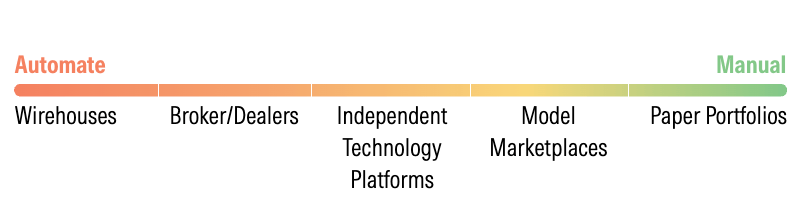
Source: Morningstar.
How Advisors Access Model Portfolios
- Our survey of 29 model portfolio providers revealed how fragmented platform placement is; respondents named 42 distinct platforms.
- Despite the breadth, responses were concentrated, with only 11 platforms (in the chart below) receiving five or more responses. Envestnet emerged as the preferred platform.
- Independent technology platforms dominated, capturing roughly 40% of all responses, reflecting their role as the connective tissue of the model portfolio ecosystem, accessible to advisors across many different firms and channels.
- Wirehouses, by contrast, appeared far less often, only gathering 11% of the 148 total responses.
- Platform placement matters: being available on the right platforms determines which advisors can access a model, and by extension, a provider’s reach.
Source: Surveyed data. Data as of March 31, 2026.
The Case for Model Portfolios
- Model portfolios have become a staple for financial advisors, providing efficiency and scale to their practices.
- Advisors recognize the benefits of model portfolios. In the 2026 Morningstar Investor Perspectives survey of advisors, they noted a wide range of benefits with simpler investment processes, time savings, and ability to focus more on client relationships and planning as the top advantages.
Source: 2026 Morningstar Investor Perspectives. Data as of May 31, 2026.
Assets and Flows: Model Portfolio Assets Barrel Toward USD 1 Trillion
Third-Party Model Portfolio Assets Approach USD 1 Trillion
- Third-party model portfolios held more than USD 943 billion of assets under advisement as of March 31, 2026, a 46% increase since Morningstar’s last survey in March 2025.
- Since Morningstar’s first survey in June 2021, assets have more than tripled and will soon cross the USD 1 trillion mark, signaling how important models have become for financial advisors.
- Figures combine survey responses from 32 providers and assets under advisement reported by more than 50 others; surveyed assets account for 95% of the total.
- This report doesn’t include home office model portfolio assets from wirehouses and broker/dealers, since they are not distributed outside of those firms.
Source: Survey data, Morningstar Direct. Data as of March 31, 2026. Includes data from Columbia Threadneedle and Russell Investments as of Dec. 31, 2025. Totals include custom model portfolios. Morningstar did not conduct a survey in 2024.
BlackRock Extends Its Lead
BlackRock still dominates model portfolios, overseeing USD 308 billion.
- Assets nearly doubled since March 2025.
- Strong offerings led by portfolio manager Michael Gates, growing custom mandates, and a vast network of relationships with financial advisors contribute to their sustained dominance.
Model provider SEI reported assets for the first time and ranked in the top 10 with USD 56 billion, highlighting their popularity with financial advisors.
Other highlights:
- Goldman Sachs jumped into 10th place since our last report, while WestEnd Advisors and Janus Henderson dropped out.
- After a couple of years of stagnation, Vanguard’s model assets grew to USD 33 billion, its largest sum since our first survey in 2021.
- Capital Group overtook Wilshire as the second-largest provider on the back of continued demand for their excellent off-the-shelf offerings.
Source: Survey data, Morningstar Direct. Data as of March 31, 2026. Includes data from Columbia Threadneedle and Russell Investments as of Dec. 31, 2025. Totals include custom model portfolios. *Morningstar Investment Management LLC and Morningstar Investment Services LLC.
Three Providers Occupy Half the Market
Source: Survey data, Morningstar Direct. Data as of March 31, 2026. Columbia Threadneedle and Russell Investments data as of Dec. 31, 2025.
Strong Flows in 2025
- Model portfolio asset flows are challenging to track, but 18 firms* from our survey provided data. So, while not exhaustive, nearly USD 43 billion flowed into model portfolios in 2025, an increase of roughly 42% from 2024.
- BlackRock claimed more than half of 2025 net inflows, according to the survey.
- Capital Group saw solid demand with net flows of just under USD 11 billion.
Source: Survey data, author's calculations. Data as of Dec. 31, 2025. *18 firms also provided data for 2024 and 17 for 2023.
Launches and Closures: Activity Accelerates as Model Portfolios Expand into New Areas
Model Portfolios Regained Momentum in 2025
- There were 346 launches in 2025. This was the highest since 2019 and third-highest on record. Roughly 80% of them fell under the allocation category group; the remaining 20% were single-asset model portfolios (equity, fixed income, liquid alternatives, digital assets).
- The 510 activations in 2025 were the second-highest ever, trailing only 2021’s 1,044.
- The 125 closures in 2025 exceeded the 10-year average of 68 but fell below 2022-2024’s surge. 2024 remains the only year with more closures than launches.
- The first quarter of 2026 alone recorded 363 activations and 88 closures. Launches have been more muted, at 21.
- Despite ongoing pruning, the number of model portfolios reported to Morningstar has grown steadily, averaging growth of 9% per year from 2016 to 2025.
Source: Morningstar Direct, author's calculations. Data as of March 31, 2026.
Notable Launches, 2025-2026
Going Private
- BlackRock Multi-Asset Income Private Market model portfolios launched in September 2025 and allocate 10% to 20% of assets to BlackRock Credit Strategies CREDX, the firm’s closed-end private debt fund.
- CAM WealthBlox Private Markets model portfolios, launched May 2025, consist entirely of interval funds and a tender-offer fund (KKR Real Estate Trust KRSTX) that invest in private equity, private debt, and direct real estate/infrastructure. They use other firms’ funds, including KKR, Cliffwater, Calamos, Franklin, and Meketa.
- In March 2026, Fidelity also launched Fidelity Model Portfolios with Private Markets and Fidelity Model Portfolios with Private Markets—ETF Focused.
Diamond Hands
- Digital assets firm Bitwise launched six model portfolios in January 2026, including Bitwise Select Crypto Market Portfolio, which includes the firm’s cryptocurrency index ETF Bitwise 10 Crypto BITW and a thematic crypto equity ETF Bitwise Crypto Industry Innovators BITQ.
- Synergy Focused Digital, which launched in May 2025, mixes cryptocurrency ETFs and public companies that the firm deems to have material business operations in the cryptocurrency and digital assets space.
- Franklin Templeton’s Core Multi-Manager + Digital Assets model portfolio allocates roughly 1% to 6% of assets to Franklin Crypto Index ETF EZPZ.
More Guidance in Bonds
- DoubleLine launched three open-architecture fixed-income models in March 2025: DoubleLine Intermediate Fixed Income, DoubleLine Multi-Sector Fixed Income, and DoubleLine Short Duration Fixed Income. These portfolios combine in-house funds with funds by Fidelity, State Street, and BlackRock.
- Vanguard launched a series of target-maturity corporate bond portfolios in March 2026: Vanguard 0-3 Year, 0-5 Year, 0-7 Year, and 0-10 Year Target Maturity Corporate Bond Portfolios. These portfolios mix Vanguard's Intermediate-Term Treasury Index ETF VGIT with a collection of in-house target-maturity corporate bond ETFs.
Make it ETF
- Several large asset managers rolled out ETF-only counterparts to their allocation portfolio suites. Capital Group’s ETF models launched in January 2025, including Capital Group ETF Growth and Capital Group ETF Growth and Income models; Vanguard’s Core ETF allocation models debuted in June 2025; T. Rowe Price Blend ETF target-risk models came out in October 2025.
- Even outside of allocation portfolios, several new launches were ETF-only—including DoubleLine’s fixed-income portfolios and Franklin Templeton’s multimanager portfolios with digital assets—reflecting growing demand for ETF-based solutions.
Fees: Model Fees Hit a New Low in 2025
Understanding Model Portfolio Fees
- Fees are a key driver of long-term investment results and remain a central consideration for advisors when evaluating model portfolios.
- Model portfolios typically derive their cost advantage over mutual funds from the use of lower-cost underlying vehicles, particularly ETFs. Lower costs have been a key driver of model portfolio adoption, particularly for multi-asset allocations.
- The following analysis compares the Morningstar prospective acquired fund expense data point for models, which is the asset-weighted average of the underlying holdings’ net expense ratios, with the prospectus-adjusted expense ratios for mutual funds, using Morningstar’s Clean Share—Service Fee Arrangement classification. This framework groups mutual fund share classes into three categories:
- Bundled: Mutual fund share classes that include distribution-related payments such as load-sharing arrangements or payments to third parties for distribution fees.
- Semibundled: Mutual fund share classes that do not pay third-party distribution fees or engage in load-sharing arrangements. However, these share classes may still pay third parties for subtransfer agency services or participate in revenue-sharing arrangements.
- Unbundled: Mutual fund share classes that do not make payments to third parties, either through share-class expenses or revenue-sharing arrangements.
- Model portfolio fees reflect underlying fund costs only and do not include additional fees that advisors or platforms may charge. Therefore, comparing model fees to mutual fund unbundled fees is most appropriate.
- Multi-asset model portfolios dominate the model portfolio universe and compete aggressively with mutual funds on price.
Fees Within the Allocation Morningstar Categories
- US-focused allocation models are the lowest-cost option across all categories, with fees tightly clustered between 0.33% and 0.40%.
- The fee advantage over unbundled mutual funds, the fairest comparison, ranges from 0.08% to 0.40% depending on the category, with the gap widest in aggressive allocations.
- Bundled mutual funds remain the most expensive structure by a wide margin, averaging more than 1.30% across all categories, almost 4 times the cost of the average model portfolio.
Source: Morningstar Direct, survey data, author's calculations. Data as of Dec. 31, 2025.
Fees Within the Global Allocation Morningstar Categories
- Global allocation model portfolios are modestly cheaper than their US-focused counterparts despite incorporating US and non-US exposures.
- Model fees range from 0.31% to 0.38%, comparable to US-focused allocation models and well below all three mutual fund share-class structures.
- The fee advantage of global allocation models over unbundled mutual funds is most pronounced in more aggressive allocation categories, consistent with US-focused allocation models.
Source: Morningstar Direct, author's calculations. Data as of Dec. 31, 2025.
Competitive Fees Persist
- Models maintained a consistent fee advantage over mutual funds from 2021–2025, even as both have declined.
- Model fees fell from 0.42% in 2021 to 0.35% in 2025, while mutual fund fees also eased slightly across share classes (bundled: 1.35% to 1.32%, semibundled: 0.83% to 0.79%, unbundled: 0.62% to 0.61%).
- The average fees for both models and mutual funds have generally decreased over time, but the gap has remained meaningfully in favor of models. As of December 2025, the average model portfolio costs 0.35%, making it 0.27 percentage points cheaper than the average unbundled mutual fund (0.62%).
- These figures exclude any additional advisor or strategist fees layered on top of models, ETFs, or mutual funds.
Source: Morningstar Direct, author's calculations. Data as of Dec. 31, 2025.
Exchange-Traded Funds and Model Portfolios: ETFs Have Become Models’ Preferred Vehicle
Exchange-Traded Funds are the Top Underlying Vehicles in Model Portfolios
- In the five-year period between March 2021 and March 2026, exchange-traded funds overtook mutual funds as the typical model’s top underlying investment vehicle as a percentage of assets. In that time, the average model increased its allocation to underlying ETFs by more than 13 percentage points.
- Today, the average model portfolio holds more than half its assets in ETFs, while mutual funds take up about a third of assets.
- The Morningstar Categories represented by ETFs within model portfolios have not changed much. The large-blend, large-growth, large-value, foreign large-blend, intermediate core bond, short-term core bond, corporate bond, and diversified emerging-markets categories accounted for 52% of underlying ETF assets in the typical model portfolio as of March 2026, compared with 50% five years prior.
- ETFs’ asset-class role in a typical model portfolio hasn’t changed much over the period, but there has been a greater shift in active and passive ETFs used within models.
Source: Morningstar Direct and author's calculations. Data as of March 31, 2026.
ETF Allocations Align with Advisor Preferences
- Financial advisors are increasingly leaning into ETFs at the expense of mutual funds, with ETFs jumping 4 percentage points over the past two years as a share of advisor AUM.
- Most advisors also expect that ETFs will increase as a share of their AUM over the next two years, while more than a third expect the mutual fund share to decrease.
- Third-party model providers have listened to advisor demand, allocating more to ETFs as the previous chart shows.
Source: 2026 Morningstar Investor Perspectives. Data as of May 31, 2026.
Actively Managed Underlying ETFs Get More Attention
- Between 2021 and 2026, the overall balance of actively managed and passively managed has remained stable, with active management representing 54% of underlying assets on average compared with 53% five years prior.
- Within ETFs, however, active management is gaining traction, rising to 29% of ETF allocation from just 9% in 2021.
- Among underlying mutual funds, there has been no major shift. The average model portfolio used active management for 94% of underlying mutual funds.
- Model portfolios’ increased use of actively managed ETFs has raised the average cost of the ETFs they use. ETFs in model portfolios averaged a 0.26% prospectus adjusted expense ratio in March 2026, compared with a 0.22% average in March 2021. Over the same period, the average prospectus-adjusted expense ratio for mutual funds in model portfolios went down to 0.69% from 0.74%.
Source: Morningstar Direct, author's calculations. Data as of March 31, 2026.
Private Assets in Model Portfolios: Most Providers Plan to Offer Private Assets Via Semiliquid Vehicles
Most Providers Plan to Offer Models With Private Assets
- Asset managers have been rolling out more semiliquid vehicles, such as interval funds, that offer private market exposure, and model portfolios have joined the trend.
- Sixty-nine percent of firms surveyed said they currently offer or plan to offer private market exposure within model portfolios over the next three years, suggesting firms are shifting from exploration to implementation.
- Proponents of private-market exposure say it offers diversification, different income streams, and more opportunities beyond public markets. Models’ growing use of private assets increases access to institutional-style strategies, but also introduces concerns about liquidity constraints, valuation complexity, operational oversight, and higher fees.
- Eight firms said they do not currently plan to offer private market exposure within models, reflecting differing views on implementation, demand, and the role of semiliquid alternatives.
Source: Surveyed data. Data as of March 31, 2026.
How Models Are Incorporating Private Assets
- Among the 20 providers planning to offer models with private assets, 44% expect to combine internal capabilities with external partnerships, while 33% plan to rely on internal capabilities and 22% on external partnerships alone.
- Several firms disclosed partnerships with established private markets managers and distribution platforms, highlighting the importance of external relationships in growing semiliquid private market offerings. Notable partnerships include:
- Capital Group and KKR
- T. Rowe Price and Goldman Sachs
- BlackRock with GeoWealth, Vestmark, and Envestnet
- SEI and Carlyle
- Many firms expect private market allocations to remain moderate: 5% to 10% and 10% to 20% were the most common target ranges.
- The modest allocation expectations suggest providers are taking an incremental implementation approach, considering liquidity constraints, operational complexity, valuation complexity, and higher fees.
Source: Surveyed data. Data as of March 31, 2026.
Early Consensus: Preference for Interval Funds and Private Credit
- Private credit was the most cited asset class, followed closely by private real estate and private equity. Private infrastructure received more selective interest.
- The slight preference for private credit likely reflects its lower liquidity risk, income orientation, and a more defined return profile relative to private equity, making it a more natural entry point for diversified model portfolios.
- Interval funds were the preferred implementation vehicle, reflecting their balance between private market access, operational scalability, and periodic liquidity for advisors and end investors.
- Despite growing adoption, semiliquid private market vehicles still have disadvantages relative to public market funds, including reduced liquidity, more-complex valuation processes, operational oversight challenges, and higher fees.
Source: Surveyed data. Data as of March 31, 2026.
More Education is Needed
- While most model providers offer or plan to offer models with private asset exposures, nearly 40% of financial advisors in the 2026 Morningstar Investor Perspectives survey said they are not very familiar or not familiar at all with semiliquid funds. Just 16% said they are very familiar. This lack of familiarity could slow adoption.
- Within model portfolios, the provider typically selects or manages the private market vehicles—a key value proposition—but advisors still need to be able to explain liquidity terms, redemption windows, and fee structures to clients.
- Lower familiarity can impact client communications; in the survey, advisors cited limited liquidity, high fees, and complexity as the top three challenged they face when offering alternatives.
Custom Model Portfolios: A Growing Segment
What Are Custom Model Portfolios? Setting the Scene
- For this research, Morningstar defines “custom” as models managed outside a provider’s off-the-shelf offerings.
- Models can be great solutions, but there is no one-size-fits-all portfolio, and some advisors may want to tweak off-the-shelf models to better fit their clients’ unique needs or preferences.
- Model providers work with advisors and advisor firms to create custom model portfolios at the individual and practice levels, typically using their off-the-shelf models as a starting point.
- As the spectrum in the next section shows, custom models provide a middle ground for advisors where they can still benefit from the expertise of professional management and efficiency of model portfolios while having some say.
How Models Are Being Customized
- By definition, “custom” could mean many things. That said, our research identified some common customizations across providers:
- Fund/vehicle substitutions
- Additional asset classes
- Fund lineup consolidation
- Strategic asset-allocation adjustments
- Trading frequency
Fees
- As part of our survey, many providers said they do not charge any extra fees for customization or that fees vary based on the mandate.
- Some providers, such as Janus Henderson, will charge a fee if proprietary products don’t account for a certain percentage of assets, ranging from 30% to 70%.
Minimums
- While some providers indicated that the minimum account size is typically set by individual firms or platforms, others do require a minimum level to customize:
- T. Rowe Price: Varies based on the degree of customization.
- RiverFront: USD 1 million.
- American Century: USD 25 million to USD 50 million over 12-18 months.
- Janus Henderson: Typically, USD 50 million but can vary.
- SEI: USD 50 million.
- BlackRock: USD 100 million.
- J.P. Morgan: USD 100 million over 12-18 months.
- Capital Group: USD 150 million with at least 70% in Capital Group funds; threshold can be negotiated.
- Franklin Templeton: USD 100 million over 12 months. USD 450 million if less than half of the portfolio’s assets are proprietary funds.
The Model Portfolio Spectrum
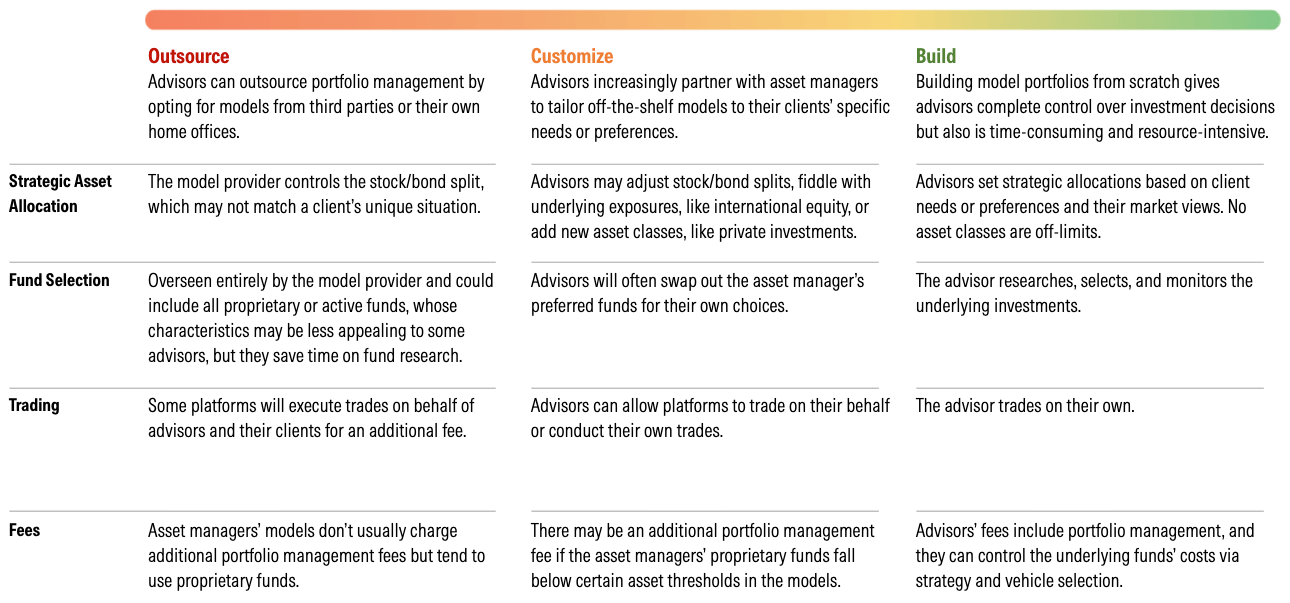
Source: Morningstar.
Barriers to Model Portfolio Adoption Exist
- The 2026 Morningstar Investor Perspectives survey revealed that 70% of financial advisors utilize model portfolios in their practice, but nearly a third haven’t made the step.
- Advisors not offering model portfolios cited preferring customized portfolios and a desire for more control over investment decisions as the biggest reasons. As a middle ground between outsourcing and do-it-yourself, custom models could address some of the concerns and highlight their appeal.
Source: 2026 Morningstar Investor Perspectives. Data as of May 31, 2026.
Best Practices for Customizing Models
Do:
- Define the investors’ objectives and risk tolerance before making any changes.
- Ensure strategic asset-allocation tweaks are within reasonable bands—5 or 10 percentage points—around the original portfolio.
- Ask how allocation changes and fund swaps will affect the portfolio’s exposures, risks, liquidity, and total costs before implementing, especially when considering:
- Substituting active funds for passive ones.
- Tilting toward higher-octane areas, like growth stocks or high-yield bonds.
- Including exposure to cryptocurrencies.
- Consider the tax implications of fund swaps before implementing, since replacing a fund with embedded gains can trigger a taxable event.
- Document the rationale for any customizations so the portfolio’s deviation from the original model can be explained and defended over time.
Don’t:
- Customize for the sake of customizing.
- Shift allocations too far from the original model, which may misalign a portfolio with the investor’s objectives and risk tolerance.
- Substitute a drastically different fund from a model’s recommended strategy; it could dramatically change exposures.
- Add large allocations to volatile assets like cryptocurrencies simply because of their strong performance. Just a touch of such investments can significantly alter a portfolio’s risk profile.
- Make so many changes to the model that it negates the point of choosing a model in the first place.
- Customize portfolios so inconsistently that they can no longer be managed efficiently at scale.
- Introduce less liquid or harder-to-trade exposures without considering rebalancing and client liquidity needs.
Custom Models Continue Gaining Traction
We collected custom model assets from 23 providers, totaling USD 258 billion as of March 31, 2026. While not exhaustive, that growing sum shows there is demand from financial advisors for more-tailored portfolios.
- The total is a 40% increase since March 2025.
- BlackRock leapfrogged Wilshire over the last year, growing its custom business by 57%.
- While providers outside of the top two exhibited healthy growth over the trailing year, the leading duo occupies over half of assets.
- We expect to see continued growth as firms expand their capabilities and services to meet advisor demand for customized models.
Source: Survey data. Data as of March 31, 2026. Russell Investments' data as of Dec. 31, 2025.
BlackRock and Wilshire Lead the Pack
Source: Surveyed data and author's calculations. Data as of March 31, 2026.
Some Firms Specialize in Custom Solutions
- Custom models represent a meaningful and growing share of assets for many providers, with several firms deriving most model assets from custom solutions.
- Even the largest model providers are leaning into custom offerings, using them to complement core model platforms and deepen advisor relationships.
- Custom models account for around 97% of Wilshire’s models’ business compared with the group median of 28%. The firm’s specialization stems from its relationships with large broker/dealers.
- Some large asset managers, like Capital Group and J.P. Morgan, are still building a presence in custom models, and custom assets remain a small share of their total model assets.
Source: Surveyed data and author's calculations. Data as of March 31, 2026.
US Allocation Model Portfolios: Morningstar Medalist Ratings
Morningstar Medalist Rating for Model Portfolios
Morningstar’s Manager Research analysts assign forward-looking, qualitative Morningstar Medalist Ratings based on their assessments of strategies’ investment merits. The ratings range across Gold, Silver, Bronze, Neutral, and Negative, indicating the analysts’ confidence in the strategies’ ability to outperform their average Morningstar Category peers on a risk-adjusted basis net of fees.
- In March 2019, Morningstar began assigning Medalist Ratings to separate accounts that represented models. In 2021, we expanded the eligible universe to include hypothetical models to help advisors assess the full range of their adoptions.
- As of May 15, 2026, Morningstar Manager Research analysts assigned Medalist Ratings to 38 allocation model portfolio series.
Several model portfolios changed their Medalist Ratings in April 2026, when Morningstar updated its Medalist Rating methodology.
The following sections show the Morningstar Medalist Ratings for allocation model portfolios under 100% analyst coverage, as of May 2026.
Source: Morningstar. Medalist Ratings as of May 31, 2026. *Only considers the best Medalist Rating that a model portfolio series attained.
Morningstar Medalist Rating for Model Portfolios
Source: Morningstar. Medalist Ratings as of May 31, 2026. American Funds Preservation Portfolio Series holds split Morningstar Medalist and pillar ratings across the portfolios.
General Disclosures
General Disclosure
“Morningstar” is used throughout this section to refer to Morningstar, Inc., and/or its affiliates, as applicable. Unless otherwise provided in a separate agreement, recipients of this report may only use it in the country in which the Morningstar distributor is based. Unless stated otherwise, the original distributor of the report is Morningstar Research Services LLC, a USA-domiciled financial institution.
This report is for informational purposes only, should not be the sole piece of information used in making an investment decision, and has no regard to the specific investment objectives, financial situation, or particular needs of any specific recipient. This publication is intended to provide information to assist investors in making their own investment decisions, not to provide investment advice to any specific investor. Therefore, investments discussed and recommendations made herein may not be suitable for all investors; recipients must exercise their own independent judgment as to the suitability of such investments and recommendations in the light of their own investment objectives, experience, taxation status, and financial position.
The information, data, analyses, and opinions presented herein are not warranted to be accurate, complete, or timely. Unless otherwise provided in a separate agreement, neither Morningstar, Inc., nor the Research Group represents that the report contents meet all of the presentation and/or disclosure standards applicable in the jurisdictions where the recipient is located.
Except as otherwise required by law or provided for in a separate agreement, the analyst, Morningstar, Inc., and the Research Group and their officers, directors, and employees shall not be responsible or liable for any trading decisions, damages, or other losses resulting from, or related to, the information, data, analyses, or opinions within the report. The Research Group encourages recipients of this report to read all relevant issue documents—a prospectus, for example—pertaining to the security concerned, including without limitation, information relevant to its investment objectives, risks, and costs before making an investment decision and, when deemed necessary, to seek the advice of a legal, tax, and/or accounting professional.
The report and its contents are not directed to, or intended for distribution to or use by, any person or entity who is a citizen or resident of or located in any locality, state, country, or other jurisdiction where such distribution, publication, availability, or use would be contrary to law or regulation or that would subject Morningstar, Inc., or its affiliates to any registration or licensing requirements in such jurisdiction.
Where this report is made available in a language other than English and in the case of inconsistencies between the English and translated versions of the report, the English version will control and supersede any ambiguities associated with any part or section of a report that has been issued in a foreign language. Neither the analyst, Morningstar, Inc., nor the Research Group guarantees the accuracy of the translations.
This report may be distributed in certain localities, countries, and/or jurisdictions (“territories”) by independent third parties or independent intermediaries and/or distributors (“distributors”). Such distributors are not acting as agents or representatives of the analyst, Morningstar, Inc., or the Research Group. In territories where a distributor distributes our report, the distributor is solely responsible for complying with all applicable regulations, laws, rules, circulars, codes, and guidelines established by local and/or regional regulatory bodies, including laws in connection with the distribution of third-party research reports.
Risk Warning
Please note that investments in securities are subject to market and other risks and there is no assurance or guarantee that the intended investment objectives will be achieved. Past performance of a security may or may not be sustained in future and is no indication of future performance. A security investment return and an investor’s principal value will fluctuate so that, when redeemed, an investor’s shares may be worth more or less than their original cost.
A security’s current investment performance may be lower or higher than the investment performance noted within the report. Morningstar’s Uncertainty Rating serves as a useful data point with respect to sensitivity analysis of the assumptions used in determining a fair value price.
Conflicts of Interest
- No material interests are held by the analyst or their immediate family with respect to the securities subject of this investment research report.
- In general, Morningstar will not hold a material interest in the security subject of this report. If a material interest is held by Morningstar, or if Morningstar owns a long or short position in the security that is the subject of this report that exceeds 0.5% of the total issued share capital of the security, it will be disclosed at https://www.morningstar.com/company/disclosures/holdings.
- Morningstar employees’ compensation is derived from Morningstar, Inc.’s overall earnings and consists of salary, bonus, and in some cases, restricted stock. Morningstar’s overall earnings are generated in part by the activities of the Investment Management and Research groups, and other affiliates, that provide services to product issuers.
- Neither Morningstar, Inc., nor its analysts receive commissions, compensation, or other material benefits from product issuers or third parties in connection with this report.
- Morningstar’s overall earnings are generated in part by the activities of the Investment Management and Research groups, and other affiliates, who provide services to product issuers. Morningstar does not receive commissions for providing research and does not charge issuers to be rated.
- Morningstar employees may not pursue business or employment opportunities outside Morningstar within the investment industry (including, but not limited to, working as a financial planner, an investment professional or investment professional representative, a broker/dealer or broker/dealer agent, a financial writer, reporter, or analyst) without the approval of Morningstar’s Legal and, if applicable, Compliance teams.
- Certain managed investments use an index created by and licensed from Morningstar, Inc. as their tracking index. Morningstar mitigates any actual or potential conflicts of interest resulting from that by not producing qualitative analysis on any such managed investment as well as imposing information barriers (both technology and non‑technology) where appropriate and monitoring by the compliance department.
- Neither Morningstar, Inc., nor the Research Group is a market maker or a liquidity provider of the securities noted within this report.
- Neither Morningstar, Inc., nor the Research Group has been a lead manager or co‑lead manager over the previous 12 months of any publicly disclosed offer of financial instruments of the issuer.
- Morningstar, Inc.’s Investment Management group has arrangements with financial institutions to provide portfolio management/investment advice, some of which deal may issue investment research reports. In addition, the Investment Management group creates and maintains model portfolios whose holdings can include financial products, including securities that may be the subject of this report. However, analysts do not have authority over Morningstar’s Investment Management group’s business arrangements or allow employees of the Investment Management group to participate or influence the analysis or opinion prepared by them.
- Morningstar, Inc., is a publicly traded company (ticker: MORN) and thus a financial institution covered by the scope of this report may own more than 5% of Morningstar, Inc.’s total outstanding shares. Please access Morningstar, Inc.’s proxy statement, section “Security Ownership of Certain Beneficial Owners and Management,” at https://shareholders.morningstar.com/investor-relations/financials/sec-filings/default.aspx. A security’s holding of Morningstar stock has no bearing on and is not a requirement for which securities Morningstar determines to cover.
Morningstar, Inc., may provide the product issuer or its related entities with services or products for a fee and on an arm’s-length basis, including software products and licenses, research and consulting services, data services, licenses to republish our ratings and research in their promotional material, event sponsorship, and website advertising.
Further information on Morningstar’s conflict-of-interest policies is available at http://global.morningstar.com/equitydisclosures. Please note analysts are subject to the CFA Institute’s Code of Ethics and Standards of Professional Conduct.
For a list of securities the Research Group currently covers and provides written analysis on, or for historical analysis of covered securities, including fair value estimates, please contact your local Morningstar office. Morningstar Research methodologies can be found at Investor Relations | Morningstar, Inc.
For current Morningstar clients, please reach out to your respective Client Success Manager for more information on how you can best leverage this research within your firm. For all others, please reach out to our business development team at datasales@morningstar.com to learn more about Morningstar’s various offerings and more details about how you can leverage this research.
For recipients in Australia: This report has been issued and distributed in Australia by Morningstar Australasia Pty. Ltd. (ABN: 95 090 665 544; AFSL: 240892). Morningstar Australasia Pty. Ltd. is the provider of the general advice (“the service”) and takes responsibility for the production of this report. The service is provided through the research of investment products. To the extent the report contains general advice, it has been prepared without reference to an investor’s objectives, financial situation, or needs. Investors should consider the advice in light of these matters and, if applicable, the relevant Product Disclosure Statement before making any decision to invest. Refer to our Financial Services Guide for more information at http://www.morningstar.com.au/s/fsg.pdf.
For recipients in New Zealand: This report has been issued and distributed by Morningstar Australasia Pty Ltd and/or Morningstar Research Ltd (together “Morningstar”). This report has been prepared and is intended for distribution in New Zealand to wholesale clients only and has not been prepared for use by New Zealand retail clients (as those terms are defined in the Financial Markets Conduct Act 2013).
The information, views, and any recommendations in this material are provided for general information purposes only, and solely relate to the companies and investment opportunities specified within. Our reports do not take into account any particular investor’s financial situation, objectives, or appetite for risk, meaning no representation may be implied as to the suitability of any financial product mentioned for any particular investor. We recommend seeking financial advice before making any investment decision.
For recipients in Canada: This research is not prepared subject to Canadian disclosure requirements.
For recipients in Europe: This report is distributed by Morningstar Holland B.V., a wholly owned subsidiary of Morningstar, Inc. Morningstar Holland B.V. is not required to be regulated by the European Securities and Markets Authority for the provision of investment research data. The analysts involved in the creation of the report do not take into account any particular investor’s financial situation, objectives, or appetite for risk, meaning no representation may be implied as to the suitability of any financial product mentioned for any particular investor. Registered address: Haaksbergweg 58, 9th Floor, 1101 BZ Amsterdam, North Holland, Netherlands.
For recipients in India: This report is issued by Morningstar Investment Research India Private Limited (formerly known as Morningstar Investment Adviser India Private Limited). Morningstar Investment Research India Private Limited is registered with SEBI as an Investment Adviser (Registration number INA000001357), as a Portfolio Manager (Registration number INP000006156) and as a Research Entity (Registration Number INH000008686). Morningstar Investment Research India Private Limited has not been the subject of any disciplinary action by SEBI or any other legal/regulatory body. Morningstar Investment Research India Private Limited is a wholly owned subsidiary of Morningstar Investment Management LLC. In India, Morningstar Investment Research India Private Limited has one associate, Morningstar India Private Limited, which provides data related services, financial data analysis, and software development. The Research Analyst has not served as an officer, director, or employee of the fund company within the last 12 months, nor has it or its associates engaged in market making activity for the fund company.
For Recipients in Hong Kong: The report is distributed by Morningstar Investment Management Asia Limited, which is regulated by the Hong Kong Securities and Futures Commission to provide investment research and investment advisory services to professional investors only. Neither Morningstar Investment Management Asia Limited, nor its representatives, are acting or will be deemed to be acting as an investment advisor to any recipients of this information unless expressly agreed to by Morningstar Investment Management Asia Limited.
For Recipients in Japan: This report is distributed by Morningstar Japan, Inc. for informational purposes only. Neither Morningstar Japan, Inc. nor its representatives are acting or will be deemed to be acting as an investment advisor to any recipients of this information.
For recipients in Korea: The report is distributed by Morningstar Korea Ltd., which has filed to Financial Supervisory Service, for informational purposes only. Neither Morningstar Korea Ltd., nor its representatives, are acting or will be deemed to be acting as an investment advisor to any recipients of this information.
For recipients in Singapore: This report is distributed by Morningstar Investment Adviser Singapore Pte Limited, which is licensed and regulated by the Monetary Authority of Singapore to provide financial advisory services in Singapore. Recipients of this report should contact their financial advisor in Singapore in relation to this report. Morningstar, Inc., and its affiliates may rely on certain exemptions (Financial Advisers Regulations, Section 27(1)(e), Section 32, Band 32C) to provide its investment research to recipients in Singapore.
For recipients in the United Kingdom: This report is distributed by Morningstar UK Ltd, a wholly owned subsidiary of Morningstar, Inc. Morningstar UK Ltd. is not required to be registered nor authorized by the Financial Conduct Authority for the distribution of investment research data. The analyst/s involved in the creation of the report do not take into account any particular investor’s financial situation, objectives, or appetite for risk, meaning no representation may be implied as to the suitability of any financial product mentioned for any particular investor. There are information barriers in place between Morningstar UK Ltd and Morningstar regulated entities based in the UK. Registered address: 1 Oliver’s Yard 55-71 City Road London EC1Y 1HQ.