
Shedding Light on Sustainable Stocks
An early look at Sustainalytics’ ESG Risk Rating for companies.

Editor's note: This article first appeared in the Q4 2021 issue of Morningstar magazine. Click here to subscribe.
Note: A longer version of this paper (Xiong 2021) is published in the Fall 2021 issue of The Journal of Impact & ESG Investing.
Incorporating environmental, social, and governance factors into the investment process is now an accepted practice, propelled by increasing interest in sustainable investing. To help investors identify financially material ESG-related risks and assess how they might affect long-term performance, Sustainalytics developed the ESG Risk Rating, which measures a company’s exposure to ESG risks and how well it manages those risks. It also allows investors to compare companies across different industries or sectors.
The new ESG Risk Rating has the potential to be an important tool to help investors identify the severity of ESG risks in their portfolios and make improvements. I took an early look at its characteristics and performance.
A New View of Risk Sustainalytics, a Morningstar-owned company, released the methodology for the ESG Risk Rating in October 2018 and launched the rating in September 2019, first in Morningstar Direct, replacing an older ESG measure.1 Because I wanted to analyze a period longer than the two-year history of the ESG Risk Rating, I created a back-test using U.S. stocks that received the old rating from August 2009 to August 2019. I recalculated the ratings for these stocks using the new methodology. My data set consisted of all the U.S. stocks that received the old rating from August 2009 to August 2019 and the new ESG Risk Rating since September 2019.
I then collected monthly returns, market capitalizations, and price/book ratios from Morningstar Direct for all the stocks that received ESG ratings. I excluded stocks with an initial price of less than $2 and market caps of less than $100 million in each month to avoid low-price stocks and micro-cap effects. After all screenings, there were 415 stocks in August 2009, 2,044 in June 2016, and 2,726 in November 2020.
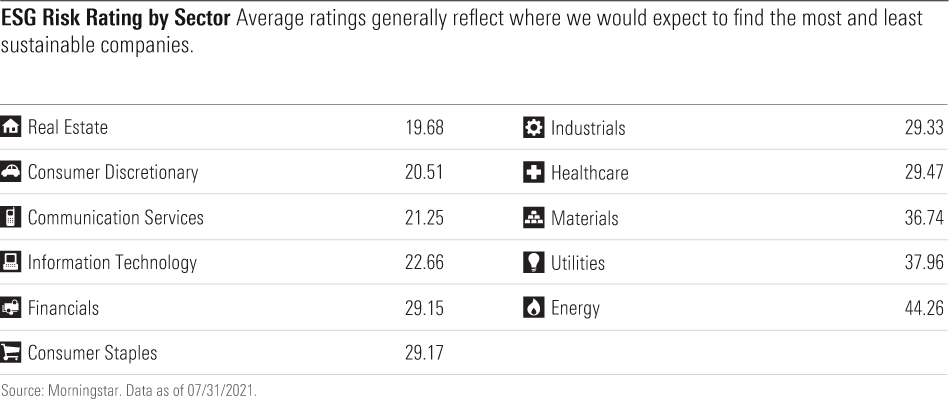
Characteristics of the ESG Risk Rating One of the main features of the ESG Risk Rating is that it makes it easy for investors to make comparisons across industries and sectors. The lower the score, the less exposure the company has to ESG risks and the better it is at managing the risks it does face. The average ESG Risk Ratings for stocks categorized by the 11 sectors using the Global Industry Classification Standard are shown in Exhibit 1. Note that the sectors with the highest average ratings are generally viewed as the less sustainable areas of the economy. It is not surprising that oil companies in the energy sector would have severe unmanaged ESG risks. Likewise, the lowest scores are in sectors traditionally viewed as more sustainable.
Next, I examined basic characteristics of the ESG Risk Rating. I wondered, does a stock with a low ESG Risk Rating tend to be larger and more expensive than its counterparts? To address this question, I formed five portfolios based on the rating. I ranked the stocks from lowest to highest ESG Risk Rating every month and sorted them into quintiles. Quintile 1 contained the lowest ratings (the most sustainable stocks); quintile 5 had the highest. I then averaged each quintile’s price/book ratios and equal-weighted market caps over the entire period from August 2009 to November 2020.
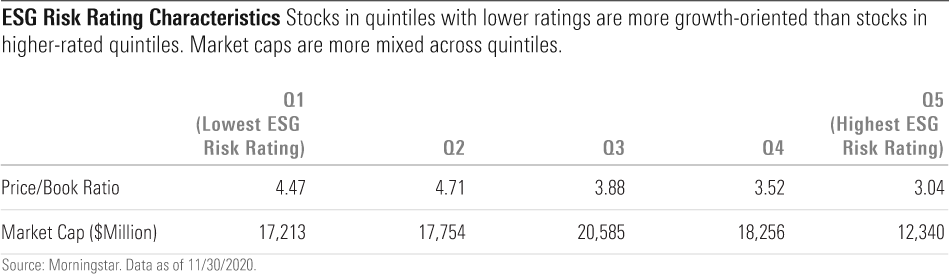
Exhibit 2 shows the average characteristics of the ESG Risk Rating quintiles. Stocks with a lower ESG Risk Rating tended to have higher price/book ratios and vice versa. This suggests that stocks with a low ESG Risk Rating are slightly growth-oriented. However, the relationship between ESG Risk Rating and market cap was mixed at best.
The Performance of ESG Risk Ratings A critical question is whether the ESG Risk Rating can forecast both returns and downside protection. I studied the predictive power of the rating on stock performance using two methods: (1) a time series of cross-sectional regressions and (2) building quintile portfolios sorted on the rating and evaluating their future performance. The technical details of the findings using the first method (cross-sectional regressions) are listed in Xiong (2021). To summarize, the regression found that the monthly return of stocks increased (or decreased) by 0.015% when the ESG Risk Rating was improved (or lowered) by 1 over the time period. In other words, the lower the ESG Risk Rating, the higher the future return.
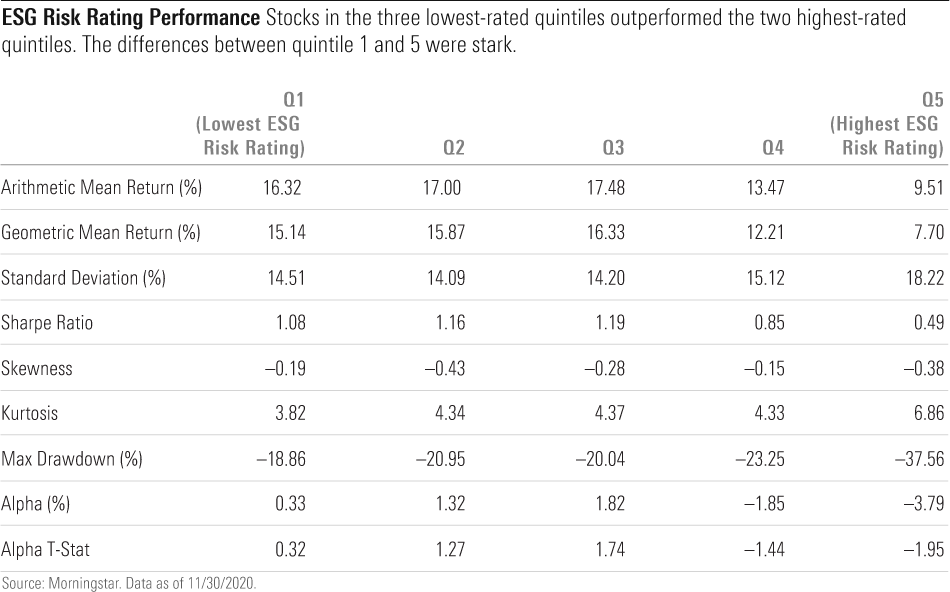
Next, I investigated the rating’s economic performance on a portfolio setting. I returned to our ESG Risk Rating quintiles to form portfolios. Exhibit 3 shows the performance measures for the five portfolios; returns are market-cap weighted. The relationship between performance and risk rating was not perfect: The geometric mean slowly increased through quintile 3 and then decreased in quintiles 4 and 5. The first three quintiles behaved similarly using the other performance measures, and all three performed better than quintiles 4 and 5. Comparing quintile 1 with quintile 5, the annual arithmetic return was 6.81 percentage points higher (16.32% versus 9.51%), the standard deviation was 3.71 percentage points lower (14.51% versus 18.22%), and the Sharpe ratio was 0.59 percentage point higher (1.08 versus 0.49).
Downside, or tail, risks are measured by skewness, kurtosis, and maximum drawdown. All three measures were more monotonic than other performance measures. Together, negative skewness and large kurtosis corresponded to large tail losses, and the combined two show that quintile 5 suffered the worst loss and quintile 1 the least. Max drawdown was the smallest for quintile 1 (negative 18.86%) and largest for quintile 5 (negative 37.56%), a whopping 18.70-percentage-point difference. Note that the maximum drawdown for each portfolio occurred during the COVID-19 pandemic, from January 2020 to March 2020.
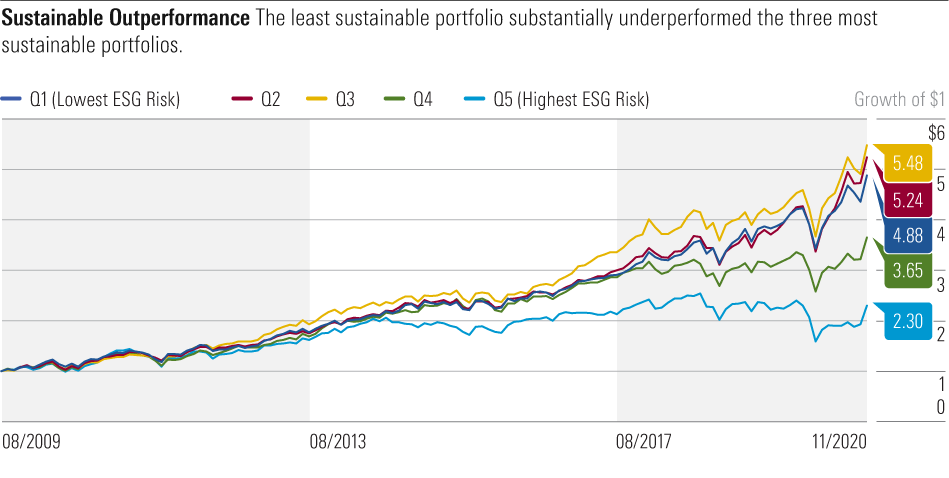
Exhibit 4 shows the growth of $1 for the five portfolios. Over the 11-year period, quintile 5, the least sustainable portfolio, underperformed the other four, particularly quintiles 1, 2, and 3.
The Impact of the Energy Sector It is well known that energy stocks have performed poorly for most of the past decade. How much did the sector account for the underperformance of the portfolio with the highest ESG Risk Ratings? To find out, I used the same two methods as above, with some modifications, to single out the impact of the energy sector.
Like before, the technical results of the cross-sectional regression method are detailed in Xiong (2021). To summarize, I chose utilities as the base sector. I found that the information technology sector had the most positive coefficient, while energy had the most negative coefficient. On average, stocks in the energy sector underperformed the base utilities sector by 0.68% monthly. In contrast, stocks in the information technology sector outperformed by 0.32% monthly.
The coefficient on ESG risk was cut by more than half compared with our first study and was no longer statistically significant, indicating that sectors played an important role in explaining returns. In other words, the energy sector’s underperformance was responsible for the main part of the underperformance of the quintile with the highest ESG Risk Ratings.
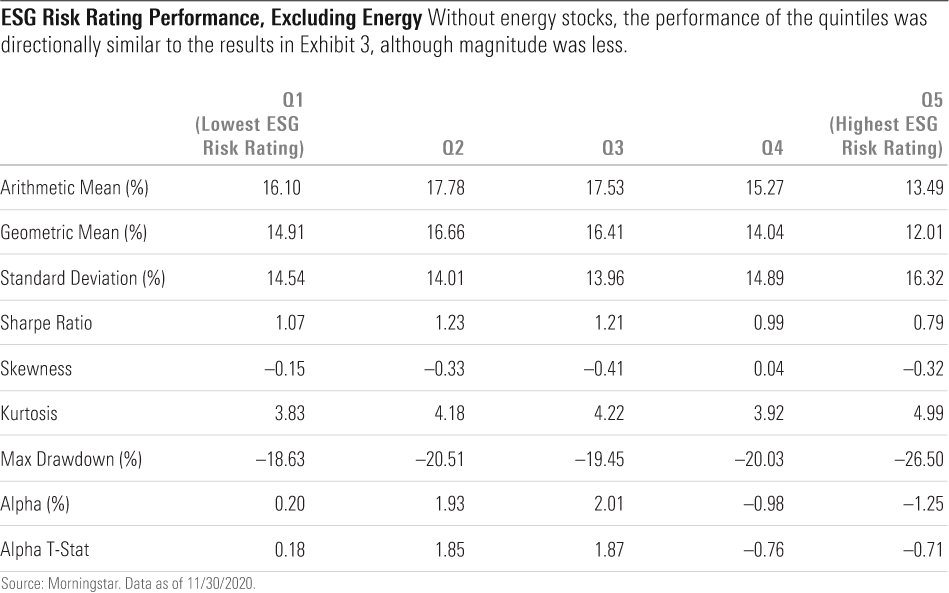
To form the five ESG-risk-sorted portfolios, I excluded energy stocks. The performance of the quintiles excluding energy stocks is shown in Exhibit 5. The difference in arithmetic mean between the lowest (quintile 1) and highest (quintile 5) ESG risk quintiles shrank to 2.61 percentage points—62% less than the performance gap shown in Exhibit 3. It was still positive but not statistically significant. The difference in max drawdown was now 7.87 percentage points, reduced from a difference of 18.70 percentage points in Exhibit 3. Skewness and kurtosis measures tell the same story—that the downside or tail risk protection was smaller but still meaningful.
Overall, the results of both studies are similar in the sense that the direction of most outperformance measures is the same, but the magnitude or significance is less because sectors such as energy play an important role in performance differences.
Explaining the Trends It makes sense that stocks with a low ESG Risk Rating provided better downside protection than high-rated stocks. A low rating signals to investors that the firm is well managed and has good governance structures in place. By following socially responsible practices, firms with a low ESG Risk Rating are assumed to be less likely to be involved in adverse events, which leads to reduced downside risk. Empirical studies that support this hypothesis include Hoepner et al. (2018) and Lööf and Stephan (2019). Both have documented that better ESG firms are associated with lower downside risk.
However, the findings in Exhibit 4—that stocks with low ESG Risk Ratings had better returns than high-rated stocks over this time—contradict the popular hypothesis that higher risk should be compensated by higher returns. If markets are efficient, and investors properly incorporate ESG risk into prices, future returns on stocks with low ESG risk should be lower than on high-rated stocks. Ibbotson et al. (2018) proposed a popularity asset pricing model in which sustainable stocks are expected to underperform in the long term because they are more popular. Pastor, Stambaugh, and Taylor (2020) present a specific asset pricing model for ESG investing that proposes that both the expected return and alpha for ESG stocks are lower than those for non-ESG stocks; however, ESG stocks can perform better than expected if ESG concerns strengthen unexpectedly.
In fact, literature on the performance of superior ESG firms compared with inferior ESG firms is mixed. Some studies show outperformance by better ESG firms, some show underperformance, and others do not provide conclusive results (see Henriksson et al. [2019] for a brief literature review). The bottom line is that results can depend on the specific ESG rating methodology, sample universe, and time periods.
One possible explanation of the findings in Exhibit 4 is the secular trend of fund flows into stocks with low ESG Risk Ratings, which drives the prices of these stocks higher. Wigglesworth (2020) reports that ESG-focused equity funds took in nearly $70 billion in assets in just over one year in 2019, while traditional equity funds suffered almost $200 billion of outflows.
On the other hand, academic research provides some evidence that ESG ratings have an impact on fund flows. Ammann et al. (2019) examine the effect of the introduction of the Morningstar Sustainability Rating in March 2016 on U.S. equity mutual fund flows. They found strong evidence that retail investors shift money from funds with Low sustainability ratings to funds with High ratings. They calculated that in the first year after the rating launched, funds with a High rating on average received between $4.1 million and $10.1 million more in net flows than funds with a sustainability rating of Average; funds with a Low rating saw $1 million to $5 million less net flows than Average-rated funds.
Finally, Xiong (2021) provides more recent evidence that ESG funds that hold sustainable stocks have attracted significantly more flows than their counterparts, which is associated with the outperformance for both ESG funds and ESG stocks.
Conclusion Stocks with a lower ESG Risk Rating significantly outperformed stocks with a higher ESG Risk Rating. The annual arithmetic return for the portfolio with the lowest ESG Risk Ratings was 6.81 percentage points higher than the highest-rated portfolio over the past 11 years. The Sharpe ratio for the lowest ESG-rated portfolio was 2 times more than that for the highest-rated portfolio. More importantly, stocks with a low ESG Risk Rating provided better tail risk protection than stocks with a high rating, and the maximum drawdown, which occurred during the COVID-19 crisis, was reduced by 18.7 percentage points.
Further analyses show that the energy sector accounted for much of the underperformance for the highest ESG-risk-rated portfolio. When I excluded stocks in the energy sector, the outperformance of the portfolio with the lowest ESG Risk Ratings declined to 2.61 percentage points. However, this portfolio still provided meaningful tail risk protection, with a reduction of max drawdown by 7.87 percentage points.
James X. Xiong, Ph.D., CFA, is head of scientific investment research at Morningstar Investment Management.
The author thanks Thomas Idzorek, Claudia Volk, and Patrick Wang for helpful insights and comments.
References Ammann, M., Bauer, C., Fischer, S., & Müller, P. 2019. "The Impact of the Morningstar Sustainability Rating on Mutual Fund Flows." European Financial Management, Vol. 25, No. 3, PP. 520–553.
Henriksson, R., Livnat, J., Pfeifer, P., & Stumpp, M. 2019. “Integrating ESG in Portfolio Construction.” The Journal of Portfolio Management, Vol. 45, No. 4, PP. 67–81.
Hoepner, A.G.F., Oikonomou, I., Sautner, Z., Starks, L.T. & Zhou, X. 2019. “ESG Shareholder Engagement and Downside Risk.” AFA 2018 paper, European Corporate Governance Institute—Finance Working Paper No. 671/2020.
Ibbotson, R.G., Idzorek, T.M., Kaplan, P.D., & Xiong,J.X. 2018. “Popularity—A Bridge Between Classical and Behavioral Finance.” CFA Institute Research Foundation.
Lööf, H. & Stephan, A. 2019. “The Impact of ESG on Stocks’ Downside Risk and Risk Adjusted Return.” Working Paper Series in Economics and Institutions of Innovation 477, Royal Institute of Technology, Centre of Excellence for Science and Innovation Studies.
Pastor, L., Stambaugh, R.F., & Taylor, L.A. 2020. “Sustainable Investing in Equilibrium.” Working Paper.
Sustainalytics. 2018. “ESG Risk Ratings: A Consistent Approach to Assess Material ESG Risk.” https://www.sustainalytics.com/esg-data/
Wigglesworth, R. 2020. “The ESG Revolution Is Widening Gaps Between Winners and Losers.” Financial Times, Feb. 3.
Xiong, J.X. 2021, “The Impact of ESG Risk on Stocks.” The Journal of Impact & ESG Investing, Fall.
/cloudfront-us-east-1.images.arcpublishing.com/morningstar/AET2BGC3RFCFRD4YOXDBBVVYS4.jpg)
/cloudfront-us-east-1.images.arcpublishing.com/morningstar/IORW4DN3VVC3BC4JO7AQLSJTF4.jpg)
/cloudfront-us-east-1.images.arcpublishing.com/morningstar/ODMSEUCKZ5AU7M6BKB5BUC6G5M.png)