
3 New Ways to Search for Model Portfolios
How Morningstar Analyst Ratings, star ratings, and Portfolio Risk Scores can help find the right model portfolio for you.
/s3.amazonaws.com/arc-authors/morningstar/af89071a-fa91-434d-a760-d1277f0432b6.jpg)

Asset managers and strategists report more than 2,400 model portfolios to Morningstar Direct, and more are being added every day. Narrowing down such a diverse universe of options may seem daunting, but three new data points make sorting models a lot easier.
Morningstar Analysts’ Top Picks
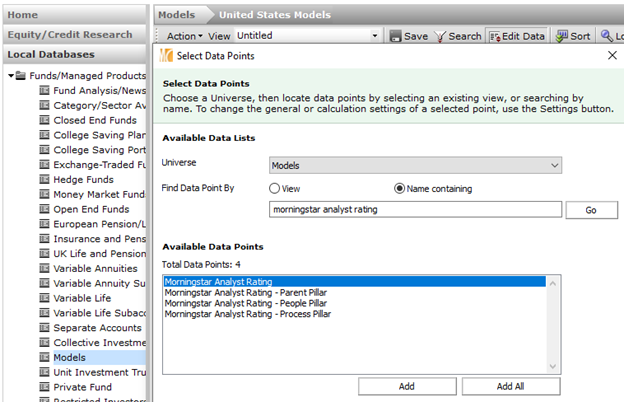
To find model portfolios vetted and recommended by Morningstar’s manager research analysts, first go to the Models universe in Local Databases, then edit the data points and select the Morningstar Analyst Rating and its supporting Pillar ratings.
- source: Morningstar Analysts
When evaluating model portfolios, our analysts rate each model on three pillars: People, Process, and Parent. It’s essentially the same methodology we use to evaluate mutual funds and exchange-traded funds. Although Price is not a pillar, the fees charged by models still play a significant role in our methodology. For the fees, we calculate the asset-weighted underlying fund fees (if it is a model of funds or ETFs) and add any additional fees, such as a strategist fee, to that number. The acquired fund fees ratio is the asset-weighted prospectus adjusted net expense ratio of the underlying funds. Strategist fees are generally charged by model portfolio providers that don’t include any proprietary funds or ETFs in the portfolio. Models that use mostly proprietary funds typically don’t charge an additional fee on top of the underlying funds since they get paid through those investments. The acquired fund expense ratio will be available as a data point in Morningstar Direct in the second quarter of 2022, and strategist fees, if applicable, will be added after.
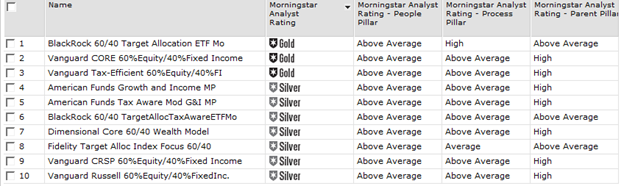
The Morningstar Analyst Ratings range from Gold, Silver, Bronze, Neutral, and Negative. These represent our forward-looking confidence in their ability to outperform their Morningstar Category benchmarks on a risk-adjusted basis over the long term. Market views, like whether growth will outperform value or U.S. stocks will outperform non-U.S. stocks, do not factor into our evaluations. The full methodology for the Morningstar Analyst Ratings can be found here.
The screenshot below shows the top-rated allocation--50% to 70% equity Morningstar Category model portfolios.
- source: Morningstar Analysts
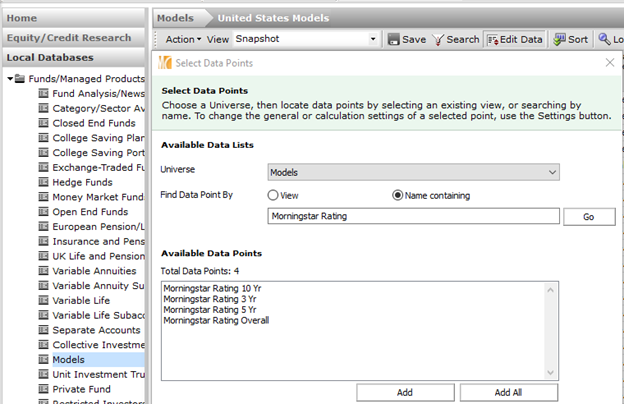
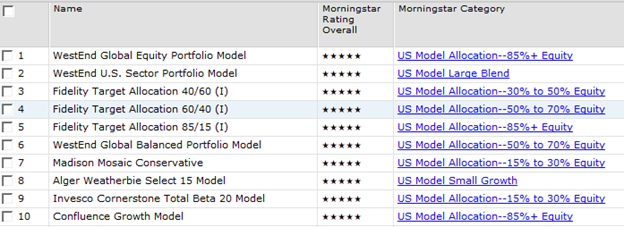
Morningstar Ratings While the Analyst Ratings take a forward-looking view, the Morningstar Rating, better known as the "star rating," ranks models based on their trailing three-, five-, and 10-year risk-adjusted returns. The star ratings' emphasis on longer time frames and risk-adjusted returns makes it a useful starting point for sorting through a large universe of options, like models. To find the Morningstar Rating, use the Edit Data button and search for Morningstar Rating. You'll have the option to look at the overall rating and the three-, five-, and 10-year ratings separately.
- source: Morningstar Analysts
Model portfolios are voluntarily submitted to Morningstar, and they are not regulated as strictly as mutual funds. This means models can report returns that significantly predate when they are added to Morningstar products. There are also cases where backfilled returns reflect hypothetical, back-tested returns. Even when reported returns reflect actual results, model providers have few incentives to voluntarily report poor performance. So, the possibility of managers only reporting flattering results rather than their entire record, warts and all, can inflate relative returns, a phenomenon known as backfill bias.
To make the star ratings more reliable, we’ve introduced some additional guardrails specific to models.
- The provider must be compliant with the Global Investment Performance Standards or have a minimum of $10 billion in regulated vehicles, like mutual funds or ETFs. This ensures the providers meet minimum professional performance reporting standards or manage material sums of assets while complying with regulations.
- Models must report at least quarterly holdings data for the ratings periods. This should allow advisors to conduct holdings-based analysis to help validate and understand models' reported performance and ensure the accuracy of Morningstar Category assignments.
- Models must have a minimum of 18 months of returns after first reporting the model to Morningstar. We will allow up to 18 months of backfilled returns to be used in the star rating calculation. A model, therefore, won't be eligible for a three-year star rating until 18 months after it is reported to Morningstar, regardless of the length of its reported track record. This should discourage cherry-picking or data mining what models to report.
- source: Morningstar Analysts
The full Morningstar Rating methodology can be found here.
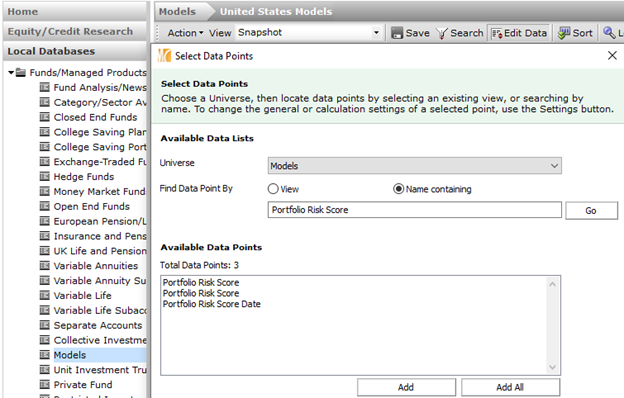
Portfolio Risk Score The Morningstar Portfolio Risk Score offers another way to evaluate models. It measures how risky their asset allocations are relative to category peers. The Portfolio Risk Score can also be found by clicking the Edit Data button and searching for it by name. The most recent score and historical scores are available, when applicable.
- source: Morningstar Analysts
The Portfolio Risk Score compares a model portfolio's holdings to the average allocation among category peers using a combination of holdings-based and returns-based style analysis. Higher scores indicate a higher level of equity/risky assets. The full methodology for the Portfolio Risk Score can be found here.
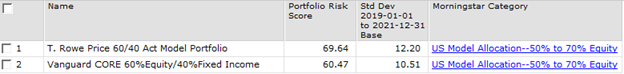
The example below shows two models in the allocation--50% to 70% equity category.
- source: Morningstar Analysts
Despite both portfolios targeting a 60% equity allocation, the T. Rowe model portfolio has a slightly higher Portfolio Risk Score because of its more adventurous bond portfolio; its 8% allocation to T. Rowe Price Global Multi-Sector Bond (PGMSX) adds more credit risk than the category benchmark. The Vanguard model eschews below investment-grade bonds in its model, which results in a lower Portfolio Risk Score. The additional risk from credit can also be seen in the T. Rowe model’s higher three-year annualized standard deviation, relative to the Vanguard model.
The First Step Isn't as Important as the Next One These three data points are useful starting points for finding models, but they shouldn't be used on their own to decide if they are the right fit for you or your clients. These data points are most useful when used to narrow down the list of model portfolios to conduct additional due diligence to ensure they are suitable investment strategies.
/cloudfront-us-east-1.images.arcpublishing.com/morningstar/CGEMAKSOGVCKBCSH32YM7X5FWI.png)
/cloudfront-us-east-1.images.arcpublishing.com/morningstar/LUIUEVKYO2PKAIBSSAUSBVZXHI.png)
:quality(80)/s3.amazonaws.com/arc-authors/morningstar/af89071a-fa91-434d-a760-d1277f0432b6.jpg)