

Persistent volatility in global-equity markets, along with the Fed’s increasingly dovish policy bias, showed the continued trend of rising uncertainty about future market performance in second-quarter 2019.
Every quarter, Morningstar's quantitative research team reviews the most recent market trends in finance and evaluates the performance of individual asset classes. Then, we share our findings in the Morningstar Markets Observer, a publication that draws on quantitative analysts' careful research and market insights.
Here's some of what we detail in our latest quarterly market commentary.
Market performance hasn’t lived up to great expectations
Negative-data surprises have partially led to increasing pessimism about market performance. As shown on the chart below of Citi’s Economic Surprise Indices, both emerging- and developed-market stocks have been below the median forecast (also known as the consensus) for most of 2019.
While these indexes are certainly correlated with market sentiment, it isn’t clear whether they have any predictive power regarding the business cycle.
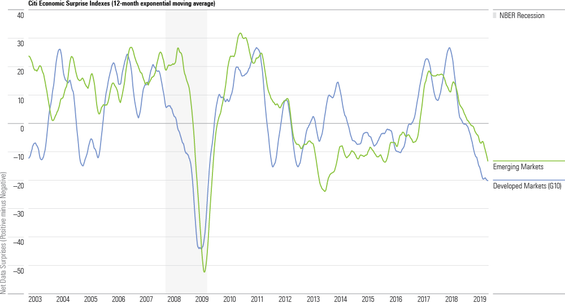
Source: Macrobond Financial. ©2019 Morningstar. All Rights Reserved.
Labor supply, taxes, and regulations remain top challenges for U.S. small businesses
The recovered economy and tightened labor market have led labor quality to replace sales as one of the biggest challenges facing small businesses.
While a Phillips curve relationship would suggest that lower unemployment is correlated with greater wage inflation, the lack of commensurate increase in the cost-of-labor response reflects the breakdown of this relationship.
Further, while taxation and regulation have become less of an issue under the Trump administration—as shown by the shrinking green section in the chart below—they are still cited as the single biggest problem by about one in three small businesses.
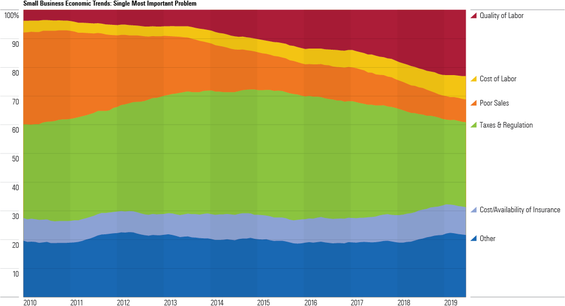
Source: Macrobond Financial. ©2019 Morningstar. All Rights Reserved.
Green shoots in the U.S. housing market?
Second-quarter 2019 saw the National Association of Realtors’ Housing Affordability Index (shown below) post its first year-on-year gain in two years, thanks to lower mortgage rates and a slowdown in the rise of house prices. While existing home sales are still declining, the pace of decline has slowed. Together, this data suggests the U.S. housing market is slowly but steadily improving.
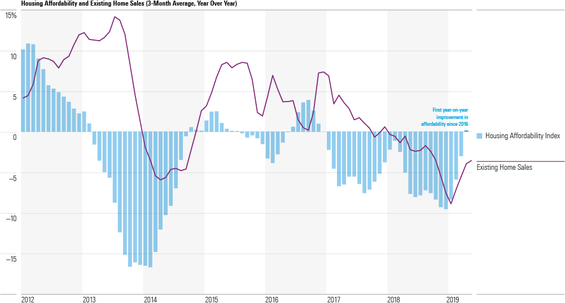
Source: Macrobond Financial. ©2019 Morningstar. All Rights Reserved.
Futures imply downturn in federal-funds rate
Historically, futures markets have represented the forecasted path of the federal-funds rate as the Federal Reserve manages monetary policy. However, the chart below shows that this expected path has been a poor guide to the actual trajectory of the federal-funds rate around inflection points where the Fed altered monetary policy.
Interestingly, the downward-sloping red line, showing the most recent market-implied path for interest rates, has taken a turn and starkly contrasts previous expectations for 2020-22.
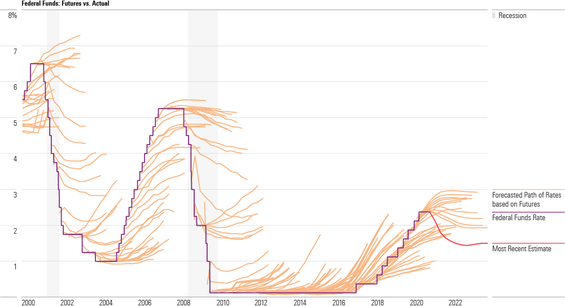
Source: Macrobond Financial. ©2019 Morningstar. All Rights Reserved.
Equity-market volatility
The Equity Market Volatility Indices, below, show that markets have been less reactive over the past year than levels seen in both 2011-12 and 2015-16. Volatility in the U.S. and Hong Kong remain elevated relative to their lows, whereas European volatility has declined.
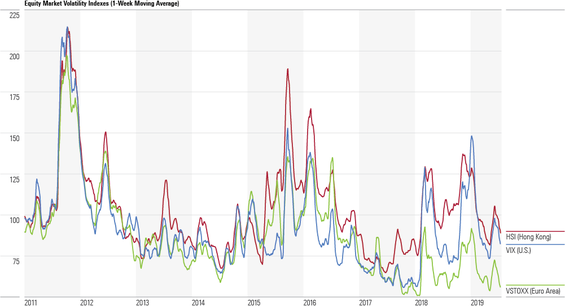
Source: Macrobond Financial. ©2019 Morningstar. All Rights Reserved.
Passive-friendly categories see higher growth
Fund categories with a large positive difference in their funds’ average Morningstar Quantitative RatingTM (active MQR score minus passive MQR score) can be seen as more favorable for active management than those with a large negative difference, which can be seen as favorable to passive management.
Active-friendly categories tend to have negative organic growth rates, as opposed to positive rates for passive-friendly ones, reflecting a significant difference in investor asset flows. The chart below shows how these rates stack up for the top categories of each management style.
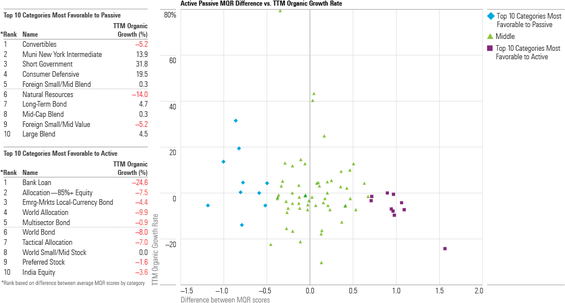
Source: Morningstar data. The active-passive difference is calculated by averaging the MQR raw scores for active and passive funds in each category, and then subtracting the passive score from the active score.
Overall, despite the market recovery since late 2018, there is continued uncertainty surrounding the market performance and equity-market volatility.