
Government Debt and Inflation
Taking the global perspective.
/s3.amazonaws.com/arc-authors/morningstar/1aafbfcc-e9cb-40cc-afaa-43cada43a932.jpg)

The Data Trail
Usually, my columns tip their hand. The title summarizes an argument that I had developed in advance, then the article defends it. Not today. As macroeconomic policies are merely among my interests, rather than an area of expertise, I do not know where this inquiry will lead. Let us learn together.
Politicians talk incessantly about the relationship between government debt and inflation. Such discussions are immaterial. To the extent that a politician’s comment about economic policy is ever correct, the occurrence is accidental.
We can, however, do what politicians rarely attempt: follow the data, without preconceived notions. We can begin by testing the connection between government deficits and the current inflation rate. My sample consists of the world’s 20 wealthiest countries, as measured by per capita income. This group not only accounts for more than half the globe’s production, but it is also homogeneous. All 20 countries are stable democracies, currently at peace.
Both the government-deficit and inflation figures come from the Organisation for Economic Co-operation and Development, or OECD. The deficits are the shortfalls (or, less commonly, surpluses) in national government receipts for fiscal 2021, divided by national GDP. The inflation statistic, computed for the 12 months through September 2022, represents headline inflation, meaning that it includes the effects of food and energy.
Test 1: Deficits and Headline Inflation
The chart below compares the rankings of the two statistics, with a ranking of 1 assigned to the highest results and a ranking of 20 to the lowest.
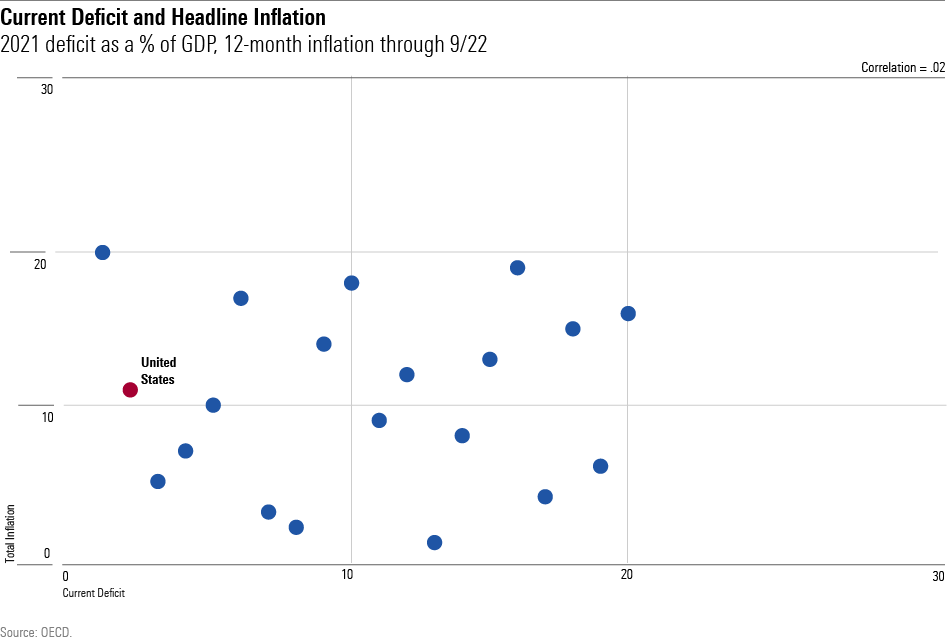
Nothing doing here. The dots are randomly placed. Japan, ironically, has the highest deficit and the lowest inflation rate among the 20 countries, which would be notable (as well as amusing) if that pattern continued. But it did not. The United States has the second-highest deficit but an average inflation rate. After that, the relationship between the two variables is thoroughly unpredictable. Thus, Norway, the country with the biggest budget surplus, does report low inflation, but Denmark, which also enjoys a budget surplus, has high inflation.
Test 2: Core Inflation
Perhaps this is to be expected. After all, economists typically ignore headline inflation, because food and energy are global commodities that fluctuate temporarily in price, for reasons that are largely (if not entirely) out of policymakers’ hands. Their emphasis instead is the so-called core inflation rate, which removes those factors. Presumably, therefore, national deficits will show a stronger correlation with core inflation rates than they do with headline inflation.
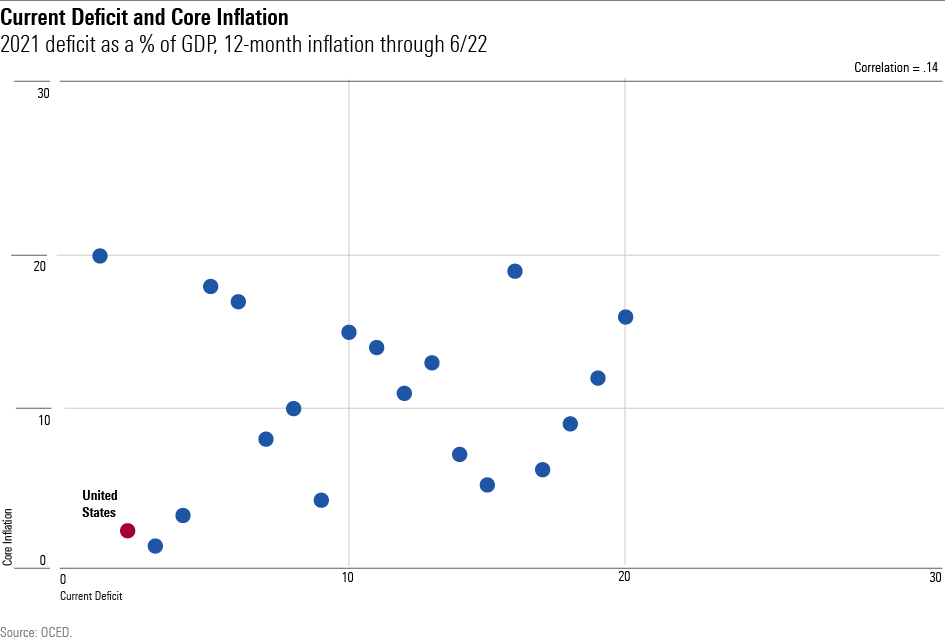
Another null finding. If you squint hard, you can see the dots trending upward and to the right. However, the impression is faint, as befits a not statistically significant correlation coefficient of 0.14. It is true that after Japan, which again is a major exception, the countries with the next three highest deficits—the U.S., Iceland, and the United Kingdom—have the three highest core inflation rates (although not in that order). That result seems consequential. But beyond that, the pattern vanishes. For the fifth through 20th countries, there is no apparent link between deficits and core inflation.
Test 3: National Debt
There are two other approaches for measuring the connection between government spending and inflation. One is to use long-term averages for inflation, as 12-month figures can be noisy. However, that strategy fails because until recently these countries did not have substantial inflation. Across the board, their inflation rates were low. In 2019, for example, only the Netherlands, the U.S., and Canada had headline inflation above 2%, and none of them reached 3%. Such data will never confess, no matter how enterprisingly it is tortured.
The other method is more promising. Rather than compare inflation rates with current deficits, we can use instead the level of overall national debt. That statistic is collected by the International Monetary Fund: general government debt as a percentage of gross domestic product. The amounts range from 254% for Japan to 25% for Luxembourg. At 134%, the U.S. places third, with Italy second.
My first study, which I will not display, was to compare the national-debt rankings against those of headline inflation. Given the vagaries of food and energy prices, I expected this test to yield chaos. I was correct! In fact, the correlation between national debt and headline inflation was slightly negative, which is silly. (The more money a country prints, the lower its inflation?)
I expected a clearer picture when comparing national debt levels with core inflation. As national debt rankings are stable, changing little from year to year, and core inflation more closely reflects the consequences of government policies, these two rankings should move at least somewhat in tandem, shouldn’t they?
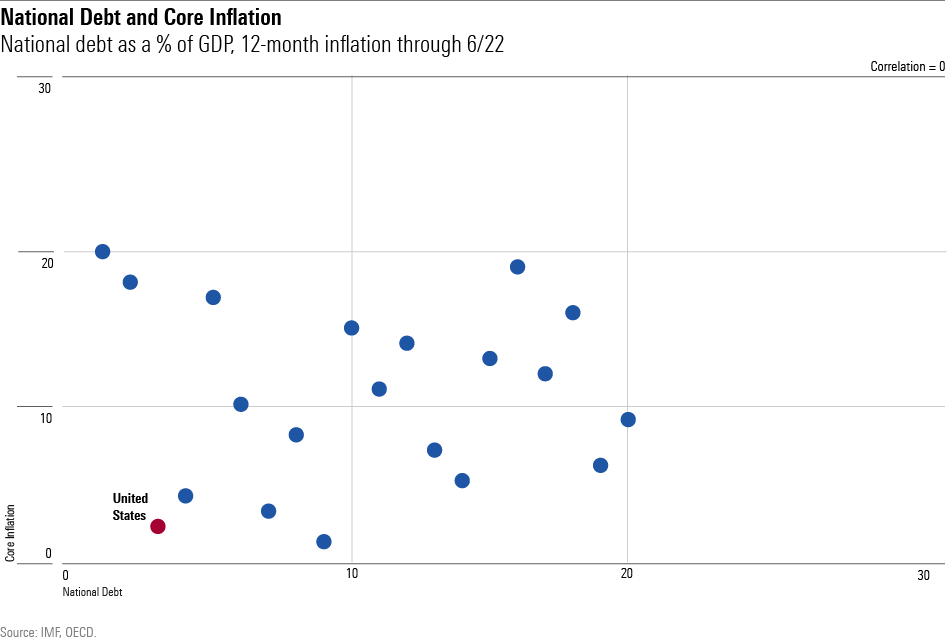
Or so I thought. The correlation statistic for this chart is … zero.
Conclusion
I realized before starting this article that the rankings would not plot on a line. All things being equal, governments raise prices by spending more than they receive. Sometimes, such inflation can spike uncontrollably. People who currently live in Venezuela, Lebanon, and Greece—each of which suffers from steep inflation and high government deficits (as well as national debts)—can attest to that harsh truth.
What I did not understand was that, for wealthy countries that have not reached their fiscal breaking points, national differences are subsumed by other factors. Japan, for example, has mitigated its inflationary fiscal approach through a combination of government programs (such as price controls) and its consumer culture. Yes, national debts affect inflation rates—but so do many other items.
In summary, it’s not clear that developed countries can meaningfully slash their inflation rates by tightening their fiscal belts. Doing so might well be a sound policy decision, in terms of promoting a healthier long-term economy. But if so, that should be the stated goal, rather than the unlikely hope of slowing inflation.
The opinions expressed here are the author’s. Morningstar values diversity of thought and publishes a broad range of viewpoints.
The author or authors do not own shares in any securities mentioned in this article. Find out about Morningstar’s editorial policies.
/cloudfront-us-east-1.images.arcpublishing.com/morningstar/G3DCA6SF2FAR5PKHPEXOIB6CWQ.jpg)
/cloudfront-us-east-1.images.arcpublishing.com/morningstar/VUWQI723Q5E43P5QRTRHGLJ7TI.png)
/cloudfront-us-east-1.images.arcpublishing.com/morningstar/XLSY65MOPVF3FIKU6E2FHF4GXE.png)
:quality(80)/s3.amazonaws.com/arc-authors/morningstar/1aafbfcc-e9cb-40cc-afaa-43cada43a932.jpg)