5 min read
US Fund Flows: Active ETFs and Derivative-Income Funds Carry July Fund Flows

Key Takeaways
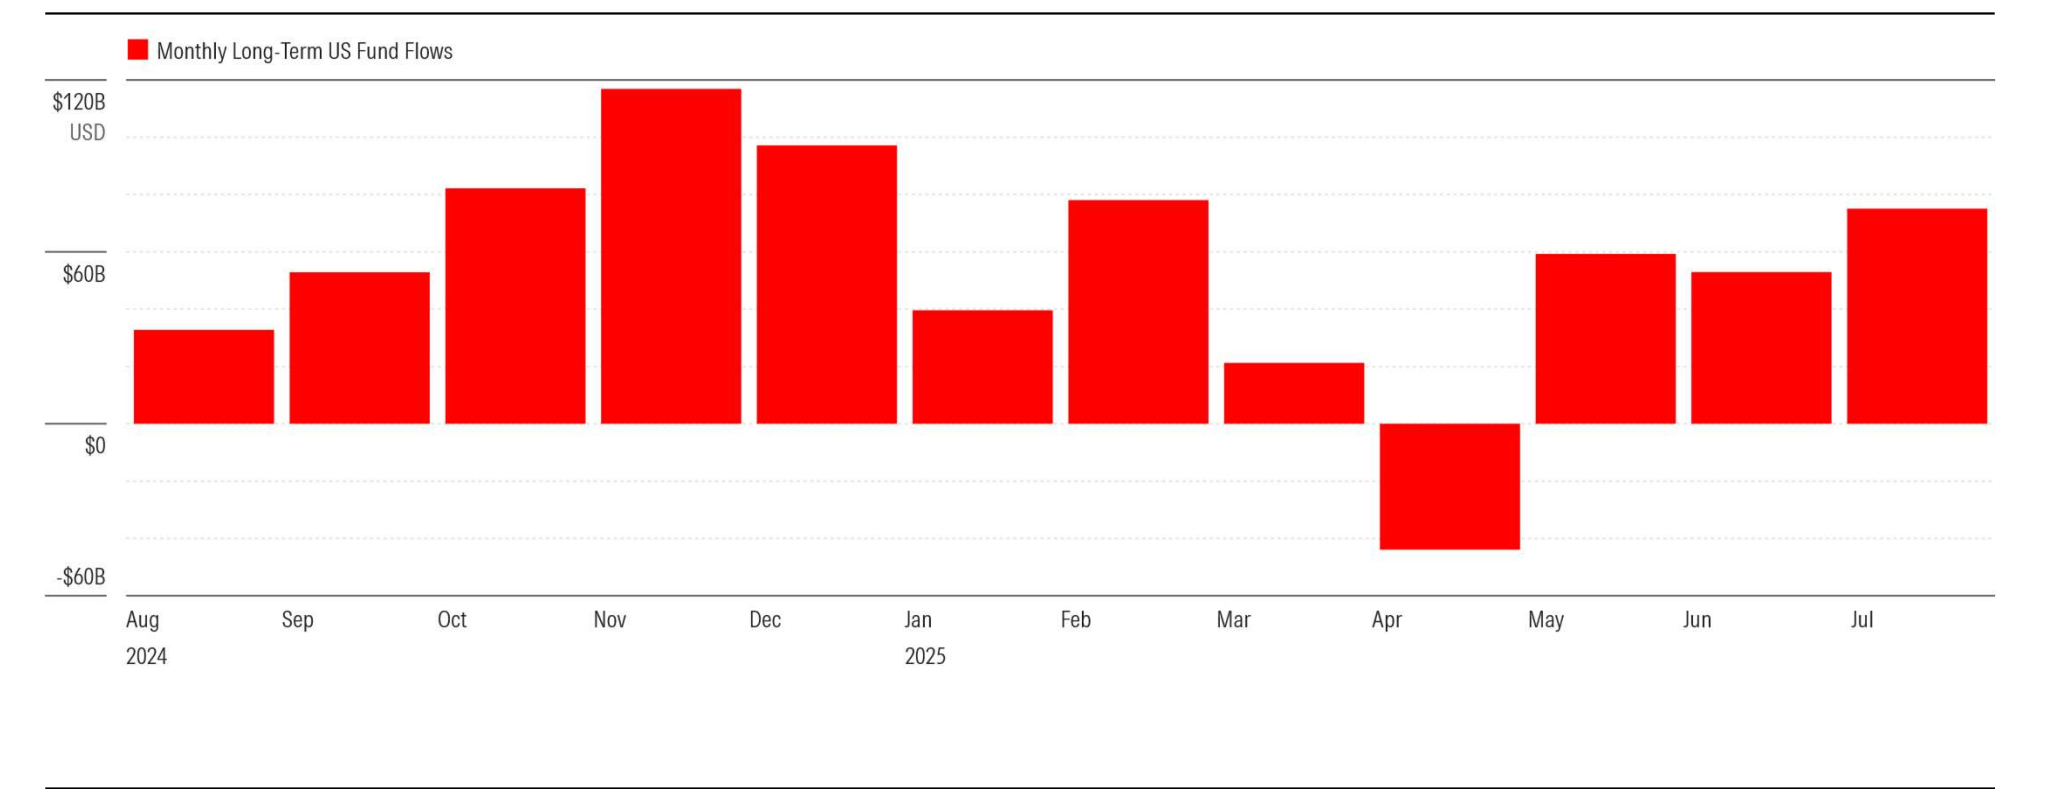
Investors poured $75 billion into long-term US mutual funds and exchange-traded funds in July 2025, the most since February 2025.
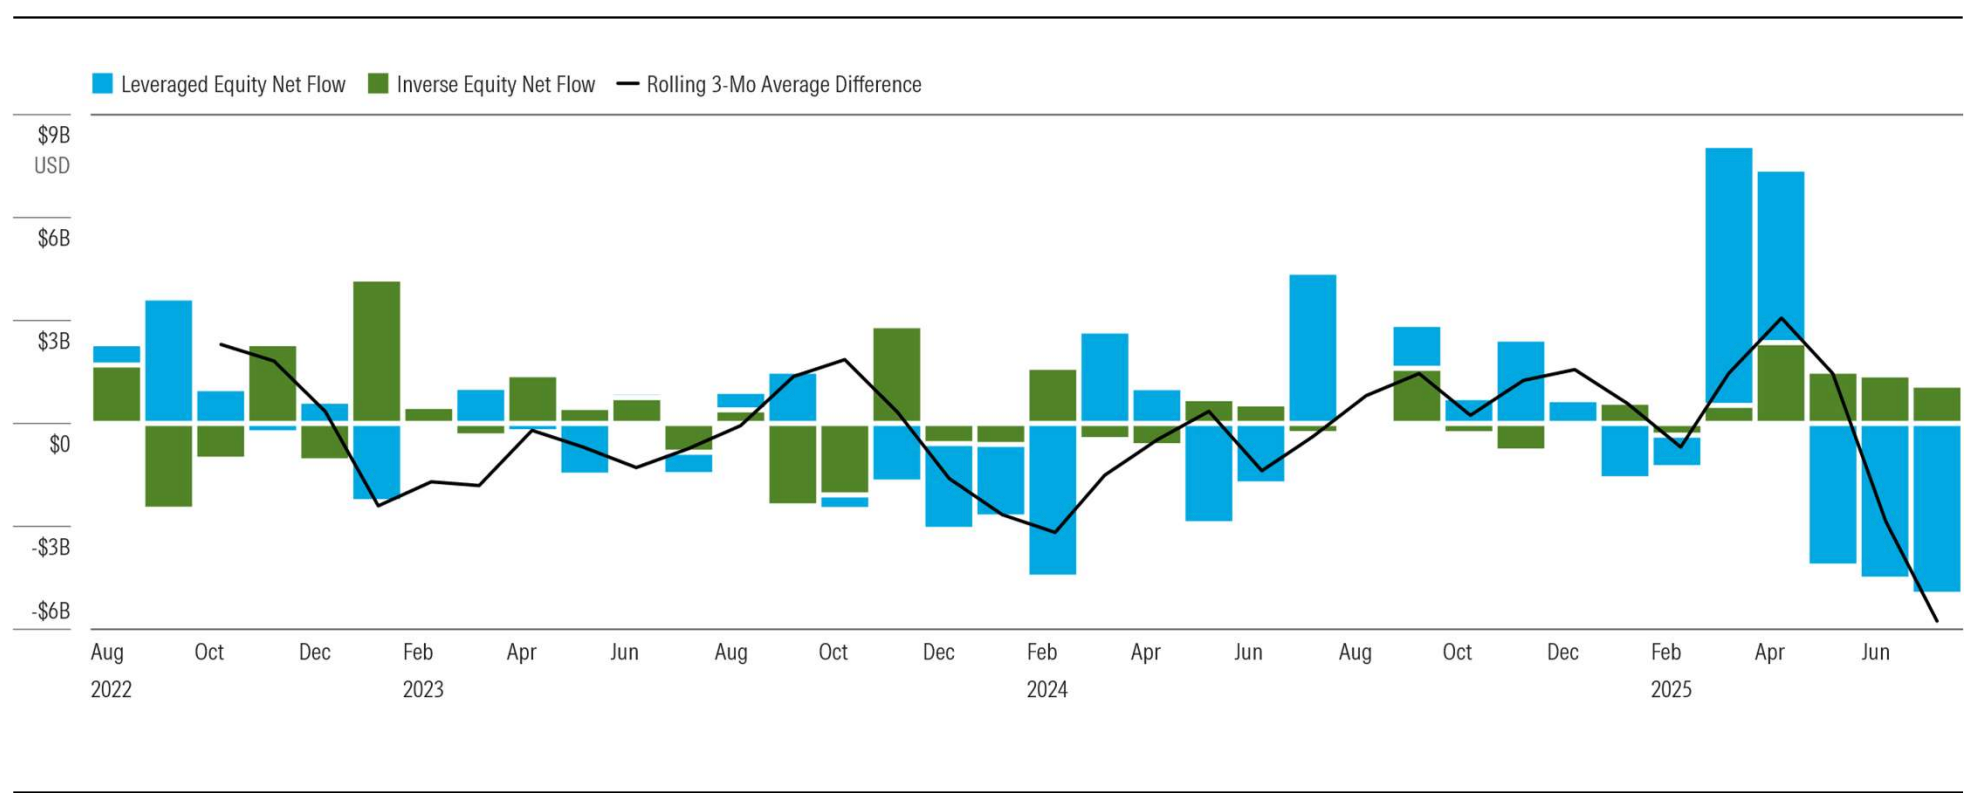
Leveraged- and inverse-equity fund flows show that a small but growing group of investors is betting against US stocks, particularly the largest technology-oriented ones that dominate popular indexes.
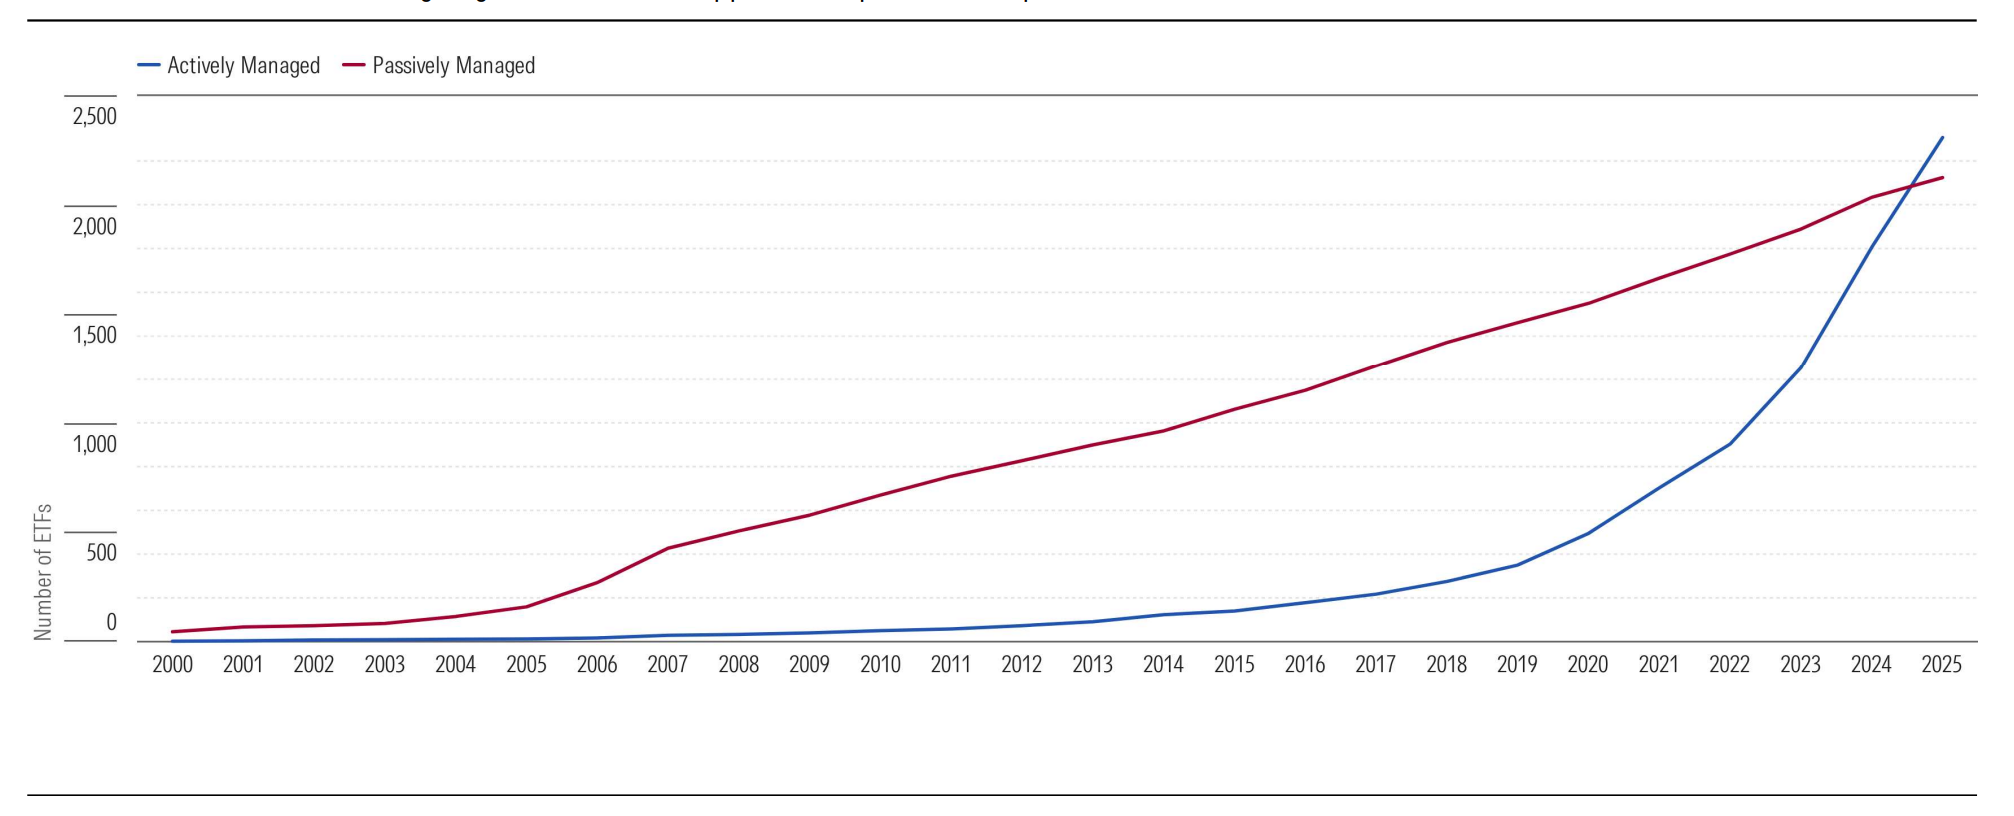
In July, active ETFs recorded $42.6 billion in inflows, their second-best month ever, following a key inflection point in May when the number of active ETFs surpassed passive ones for the first time.
Despite market volatility amid changes in US trade policy, investors put about $75 billion into US open-end funds and ETFs in July. Desire for diversification and
general conservatism likely drove the flows, a recent theme. Bond funds led the way as 18 of the 23 taxable-bond Morningstar Categories and all national municipal bond categories experienced inflows for the month. All US equity categories except large blend continued to experience outflows. Increased rotation
into foreign assets also persisted into July.
The charts below illustrate which direction the money is flowing for a variety of fund types. For a more complete analysis, download the full monthly report from Morningstar’s Adam Sabban and Ryan Jackson.
This data was sourced from Morningstar Direct. Not a user? Get a free trial of Direct.

Source: Morningstar Direct Asset Flows. Data as of July 31, 2025.
Navigating Market Volatility Through Fund Flows Data
Leveraged Equity and Inverse Equity Flows Suggest Negative Sentiment
Leveraged equity funds saw net redemptions over the past three months, while inverse equity funds had inflows. The difference between the two can serve as a barometer of investor sentiment, with positive values showing bullishness and negative ones fear. This measure was at a three-year low in July, suggesting a deteriorating view of US equities, especially tech stocks. Most of the largest leveraged fund outflows were from tech-focused funds, while inflows were largest in ProShares UltraPro Short QQQ SQQQ, which is a triple bet against the tech-heavy Nasdaq-100.

Source: Morningstar Direct Asset Flows. Data as of July 31, 2025.
Active ETF Demand and Supply on the Rise
Active ETFs—defined as ETFs that do not track an index—saw a strong resurgence in July, pulling in $42.6 billion in assets, their second-highest monthly inflow on record, just behind the $43.3 billion in January 2025. As of July, active ETFs made up roughly 10% of total ETF assets, compared with only 1% a decade ago. Adding to the significance of this growth was a notable inflection point reached in May, when the number of active ETFs surpassed passive ETFs for the first time. The active ETF stars are aligning as both investor appetite and product lineup are on the rise.

Source: Morningstar Direct Asset Flows. Data as of July 31, 2025.
Another Record Month of Inflows for Derivative-Income Funds
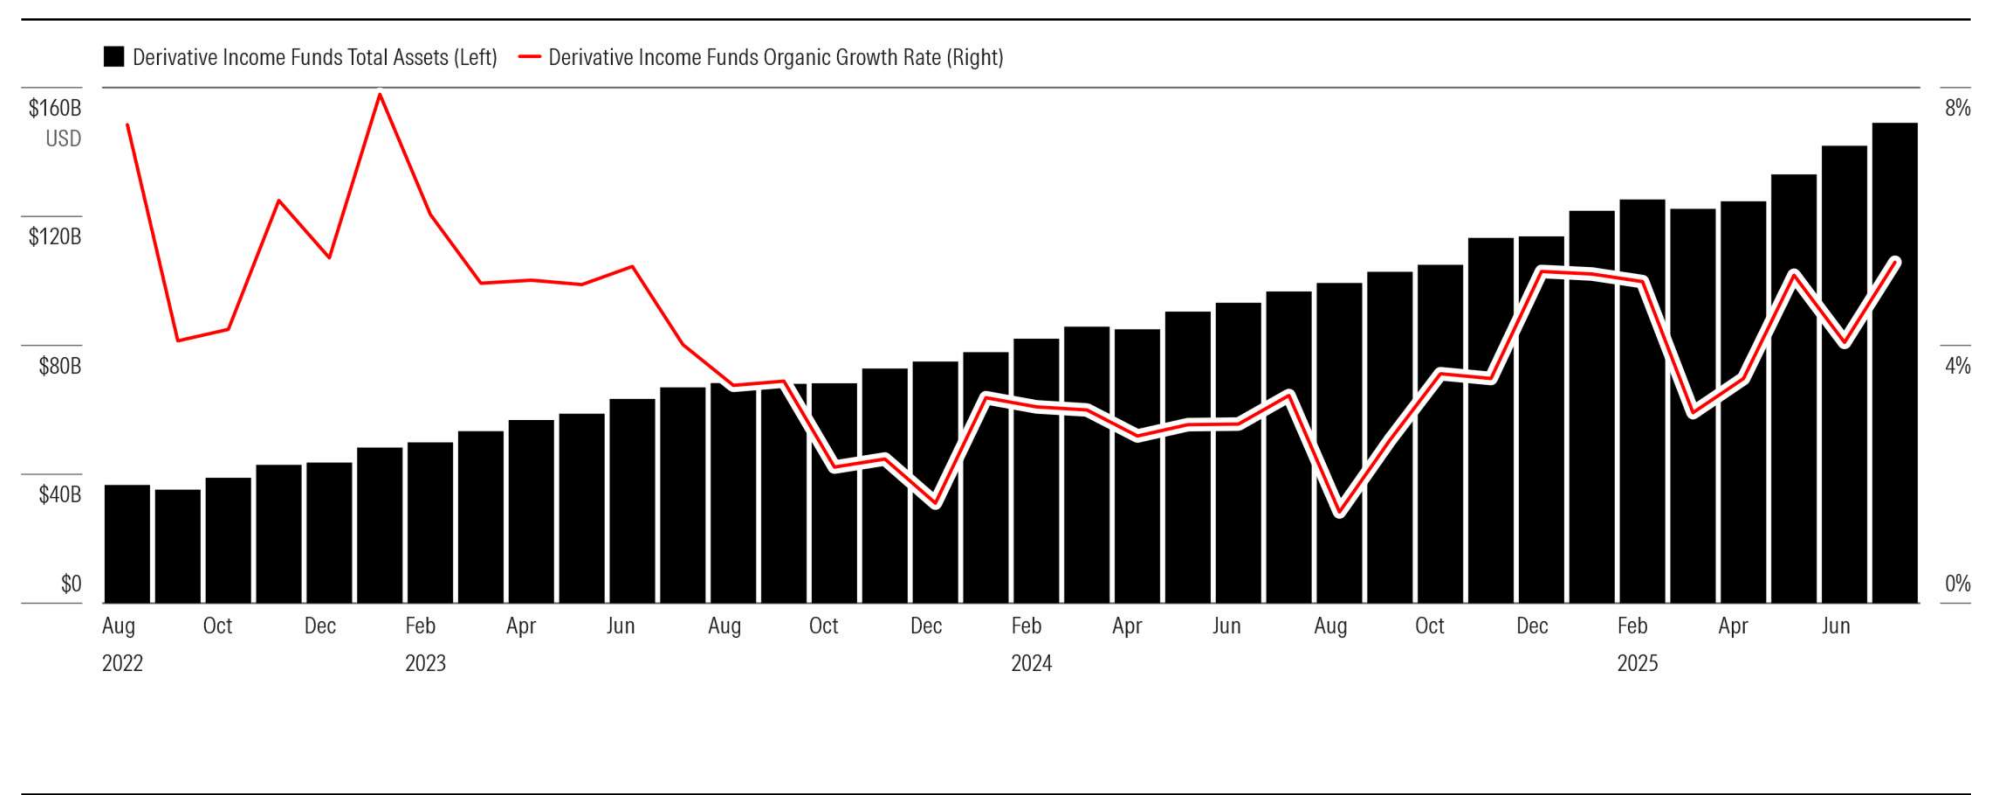
Following record inflows into derivative-income category funds in May, July's net inflow of over $7.5 billion set another monthly record. Despite the consistently growing asset base, the category’s momentum isn’t slowing down—its 5.3% organic growth rate in July was its highest since February 2023. Covered-call strategies make up a large portion of these funds, and their popularity has persisted as more investors continue to look for downside protection.

Source: Morningstar Direct Asset Flows. Data as of July 31, 2025.
More on Fund Flows from Morningstar
For more comprehensive analysis and commentary on US Fund Flows, download this month’s full report.
Additional topics include:
Active/passive flows by US category group
Flows for the largest fund families
Government bond fund and money market flows
Can’t get enough fund flows data? Check out Morningstar’s Ultimate Guide to Fund Flows.
Unsure about the future of active management? Check out this insightful article from a Morningstar analyst.
This article is adapted from the Morningstar U.S. Fund Flows report for July 2025. Download the full report here.
Start a free trial of Morningstar Direct and evaluate fund flow data your way.
Note: The figures in this report were compiled on Feb. 28, 2025, and reflect only the funds that had reported net assets by that date. The figures in both the commentary and the extended tables are survivorship-bias-free. This report includes both mutual funds and exchange-traded funds but not funds of funds unless specifically stated. It does not include collective investment trusts or separate accounts. Important methodology note: Morningstar computes flows using the standard approach in the industry: Net flow is the estimated change in assets not explained by the performance of the fund. Our method assumes that flows occur uniformly over the course of the month. Adjustments for mergers are performed automatically. When liquidated funds are included, the fund's final assets are counted as outflows. Reinvested dividends are not counted as inflows. We use fund-level reinvestment rates to improve accuracy in this respect. We make ad hoc adjustments for unusual corporate actions such as reverse share splits, and we overwrite our estimates with actual flows if managers are willing to provide the data to us. When possible, Morningstar offsets outflows caused by transfers to other investment vehicles that share an identical mandate since they are not indicative of a change in investor interest.


