
Long-term fund flows saw a substantial turnaround from fourth-quarter 2018 to first-quarter 2019—from $126 billion in outflows to $136 billion of flows for open-end funds and exchange-traded funds. First-quarter 2019 numbers matched that of first-quarter 2018, landing slightly above the $128 billion 2009-18 average.
It’s possible that this trend emerged as a result of the Fed’s decision to suspend rate hikes for the time-being, which may have led investors to feel comfortable moving into long-term risk assets. However, this partly came at the expense of money market funds, which enjoyed about $163 billion of inflows during fourth-quarter 2018, but just $31 billion of inflows during first-quarter 2019.
We break down the factors contributing to these flows in the latest edition of the Morningstar Direct℠ Fund Flows Commentary. Below, explore some of our key findings.
Taxable-bond funds and municipal-bond funds see strongest growth
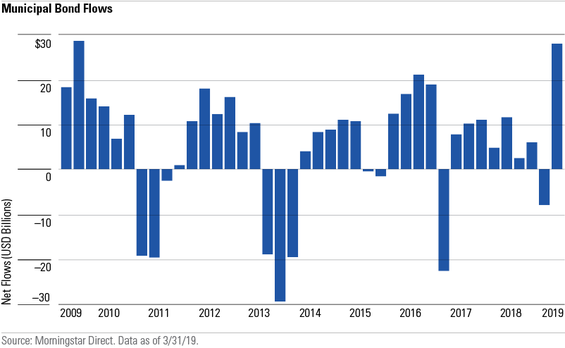
Still, despite healthy long-term inflows overall, bonds were the only individual asset class with strong demand throughout first-quarter 2019. Nearly $102 billion went into taxable-bond funds in the first quarter. And as shown on the chart below, another $28 billion went into municipal-bond funds, making this the best quarter for muni-bond funds since third-quarter 2009.
The interest in munis may have owed to attractive valuations relative to Treasury bonds entering 2019, as well as an upward-sloping yield curve; another factor in this growth may be investor expectation of higher tax rates in the future.
Fund flows indicate greater risk-taking among many bond investors
Investors also showed a willingness to take on greater credit risk in both taxable-bond funds and muni-bond funds. Last quarter, high-yield muni funds collected nearly $5.5 billion, the group’s best showing in a decade. And after suffering outflows of $19.8 billion during 2018’s fourth-quarter correction, taxable high-yield funds rebounded with $14.6 billion in inflows.
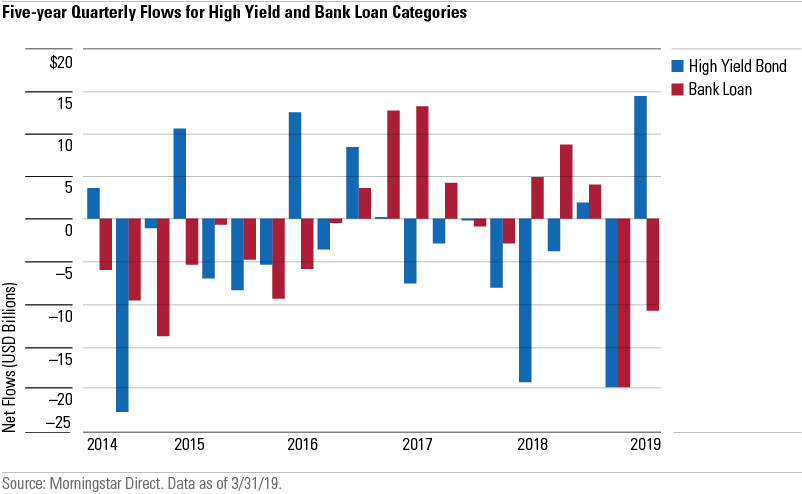
However, as shown below, credit-oriented bank-loan funds fared poorly, with investors pulling nearly $10.8 billion during the quarter. Bank-loan funds tend to have short durations, so with Fed rate hikes on hold, their outflows may reflect investors’ greater comfort with more interest-rate risk, as found among high-yield funds.
Core strategies remain popular
Overall, taxable intermediate-term bond funds fared the best of any Morningstar Category, taking in nearly $42 billion in the first quarter of 2019. These strong flows reflect the continuing popularity of core-oriented strategies, with large-blend funds collecting $25.6 billion during the quarter, followed by muni-national intermediate funds collecting $13.9 billion.
Market share movements highlight the ongoing active-to-passive shift
Passive funds continue to take market share from active funds. At the end of the first quarter, passive U.S. equity funds hit 49.0% market share as measured by total assets—an increase from 46.3% the year before. Similarly, across all long-term funds, active market share fell to 60.6%, down from 63.0% at this time the year before. That’s a big shift, especially within the context of about $18.8 trillion of open-end and ETF assets.
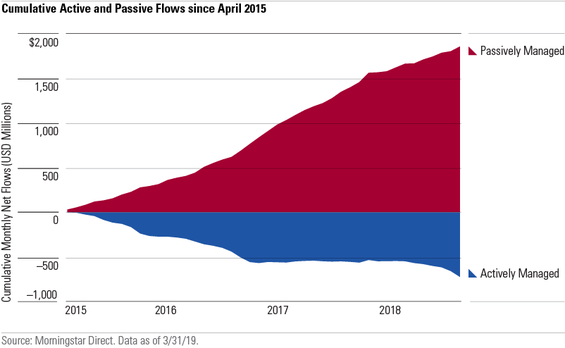
Though these movements are noteworthy, they may actually understate the shift in investor demand. These trends become much more apparent through the lens of cash flows: Over the past four years, active funds have seen a total of $855 billion in outflows, while passive funds have had $2.0 trillion in inflows, resulting in a total difference of nearly $2.9 trillion (as shown on the chart below).
Nonetheless, bond funds did lead active funds to see positive flows of $15.7 billion in first-quarter 2019—making it only the fifth positive quarter for active funds in the past five years. Conversely, long-term passive funds haven’t collected less than $25 billion in any quarter over the past 10 years.
Fund families: Measuring the oligopoly
The dominance of passive strategies naturally shows in fund-family assets and flows, too. The net result is that the industry looks increasingly like an oligopoly.
Vanguard holds, by far, the greatest percentage of market share—25.0% compared with the combined 24.9% of the next three largest firms (American Funds, Fidelity, and iShares). That’s a combined 49.9% market share across just four firms, meeting one definition of an oligopoly.
Like the active/passive fund comparison, the dominance of just a few firms is even more pronounced when looking at cash flows. In March 2019 alone, Vanguard and iShares collected about 81% of inflows, or $33.9 billion. And over the course of the quarter, nearly $123 billion of the net $134 billion in total long-term flows went to the top five firms as measured by inflows: Vanguard, Fidelity, iShares, American Funds, and Dimensional Fund Advisors.
All five of these firms are noteworthy for their scale, distribution, and lower costs: three hallmarks of oligopolistic competitors. Unless regulatory changes or seismic innovation lead to substantial industry disruption, we believe this dynamic is likely to continue for the foreseeable future.