How scenario analysis tools can help investors manage financial risk and evaluate returns.
By Chau Pham and Michael O'Leary

Risk
By Chau Pham and Michael O'Leary
Read Time: 3 Minutes
Forecasting is a no-win situation. If you get it right, people go about their business. But if it's wrong, you'll hear nothing but bitter vituperation about the stupidity of forecasting models.
Part of the problem is that forecasting is innately regarded as an oracular art, a reading of tea leaves and sheep's guts for a precise knowledge of the future. But forecasting models are statistical models based on historical data. In other words, the forecast is always conditioned on past data. If it's never happened before, a forecasting model isn’t going to predict it.
In that sense, forecasting models can be thought of as a more intuitive way of representing historical data. "How does this data impact me and my immediate concerns?"
Financial scenario analysis and stress testing sidestep some of the jeremiads against forecasting by clearly stating the conditions of the model. The "what if" in scenario analysis is explicitly, "What will happen to my returns if condition x is known?"
Scenario analysis and stress testing are essential tools for managing long-term expectations and exploring shorter-term volatility. They help tackle such questions as, “What will happen to my portfolio if the S&P 500 falls by 20% over the next year?” or “What if oil prices rise by 40% over the next four months?"
Morningstar has developed a suite of financial scenario analysis tools, that provide three different approaches to interpreting how the past might provide insight into future returns:
These models allow users to define one or multiple market shocks and then view the outcomes of such hypothetical events on factor exposures, portfolio returns, and volatilities.
We found that using more than one methodology for scenario analysis can validate our intuitions and outline the limitations of the assumptions of a given model. To illustrate this, we picked the oil shock of 2007-08 in which oil prices rose from $40 per barrel to just under $150 per barrel over 18 months and explored scenario analysis examples through the three unique approaches described above.
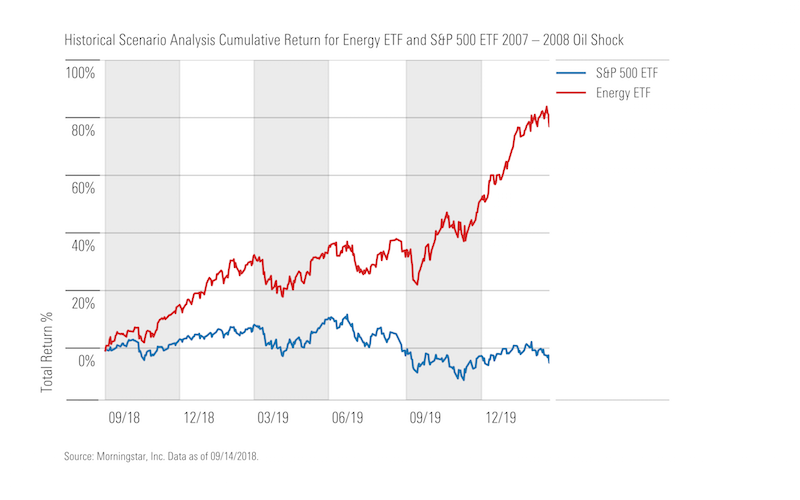
1. Historical Scenario Analysis provides an excellent benchmark for assessing custom scenarios.
If oil prices were to rise by 375% in the next 17 months, what is a plausible return outcome for the energy sector?
The Energy Select Sector SPDR® ETF is run through Morningstar’s Historical Scenario Analysis tool and the cumulative return of 80% is plotted in the graph below. Given the magnitude and uniqueness of the 2007-08 oil shock, such a superior return is not surprising.
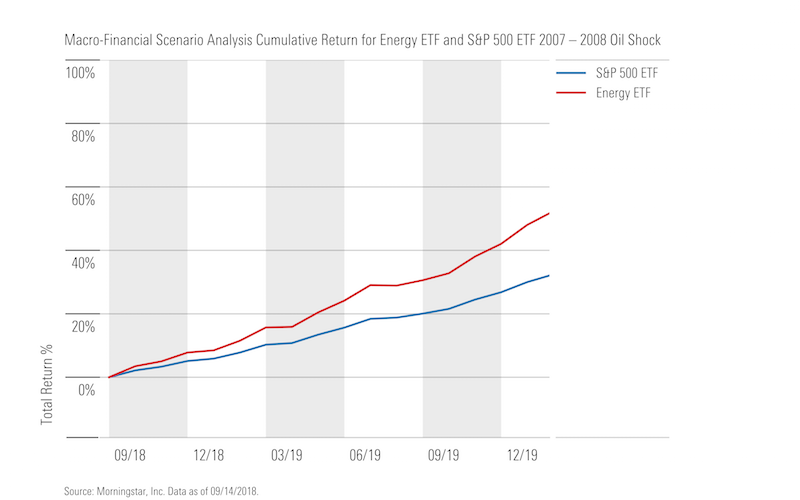
2. Macro-Financial Scenario Analysis is particularly useful when exploring the relationship between the market and macroeconomic trends.
For this scenario, the Macro-Financial Scenario Analysis model is shocked by the scale of the oil price rise from 2007-08. The nearly 60% cumulative return of this analysis for the energy ETF (shown in the graph below) is 20% less than the first analysis.
In Historical Scenario Analysis, the assumption is that the event occurs in precisely the same way as it did in the past. Although the present may rhyme with the past in Macro-Financial Scenario Analysis, it’s not necessarily identical.
So, the Macro-Financial Scenario Analysis produces the more likely result shown below rather than the extreme results shown above.
3. Market-Driven Scenario Analysis provides the most statistically rich output but also requires careful consideration of model constraints.
The Market-Driven Scenario Analysis tool allows users to shock an index and specify the percentile of the distribution to determine the risk and return to a portfolio through Monte Carlo simulations.
The result of an oil price shock of 375% above the 95th percentile of the distribution is shown below. The cumulative return of the Macro-Financial Scenario Analysis is within one standard deviation of the simulated distribution while the cumulative return of the Historical Scenario Analysis is within approximately two standard deviations.
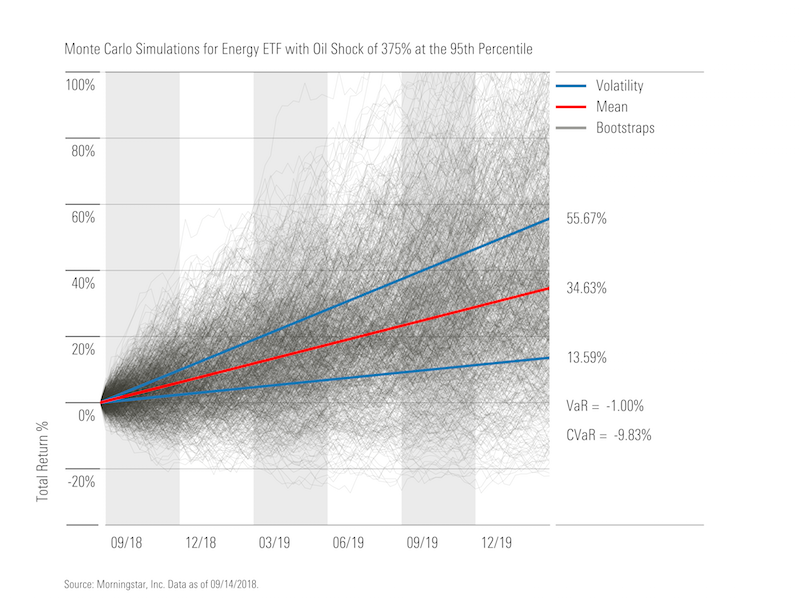
Given the same inputs, different models can produce significantly different results with each approach remaining methodologically consistent.
Learn more about financial scenario analysis and ways to assess risk using Morningstar Direct. Schedule a demo today.