
How Do Investor Returns Stack Up Against Total Returns?
We found the results fund investors have experienced in dollar terms were within close range of reported total returns overall.
/s3.amazonaws.com/arc-authors/morningstar/360a595b-3706-41f3-862d-b9d4d069160e.jpg)
Investors aren’t doing so badly after all.
Fund investors often get a bad rap for being ill-informed or making poorly timed investment moves. But in our annual "Mind the Gap" study of investor returns, we found that as a whole, the results investors actually experienced were only slightly lower than reported total returns. That's a turnabout from past studies, when we sometimes found big shortfalls between the returns investors earned and the returns their fund holdings produced.
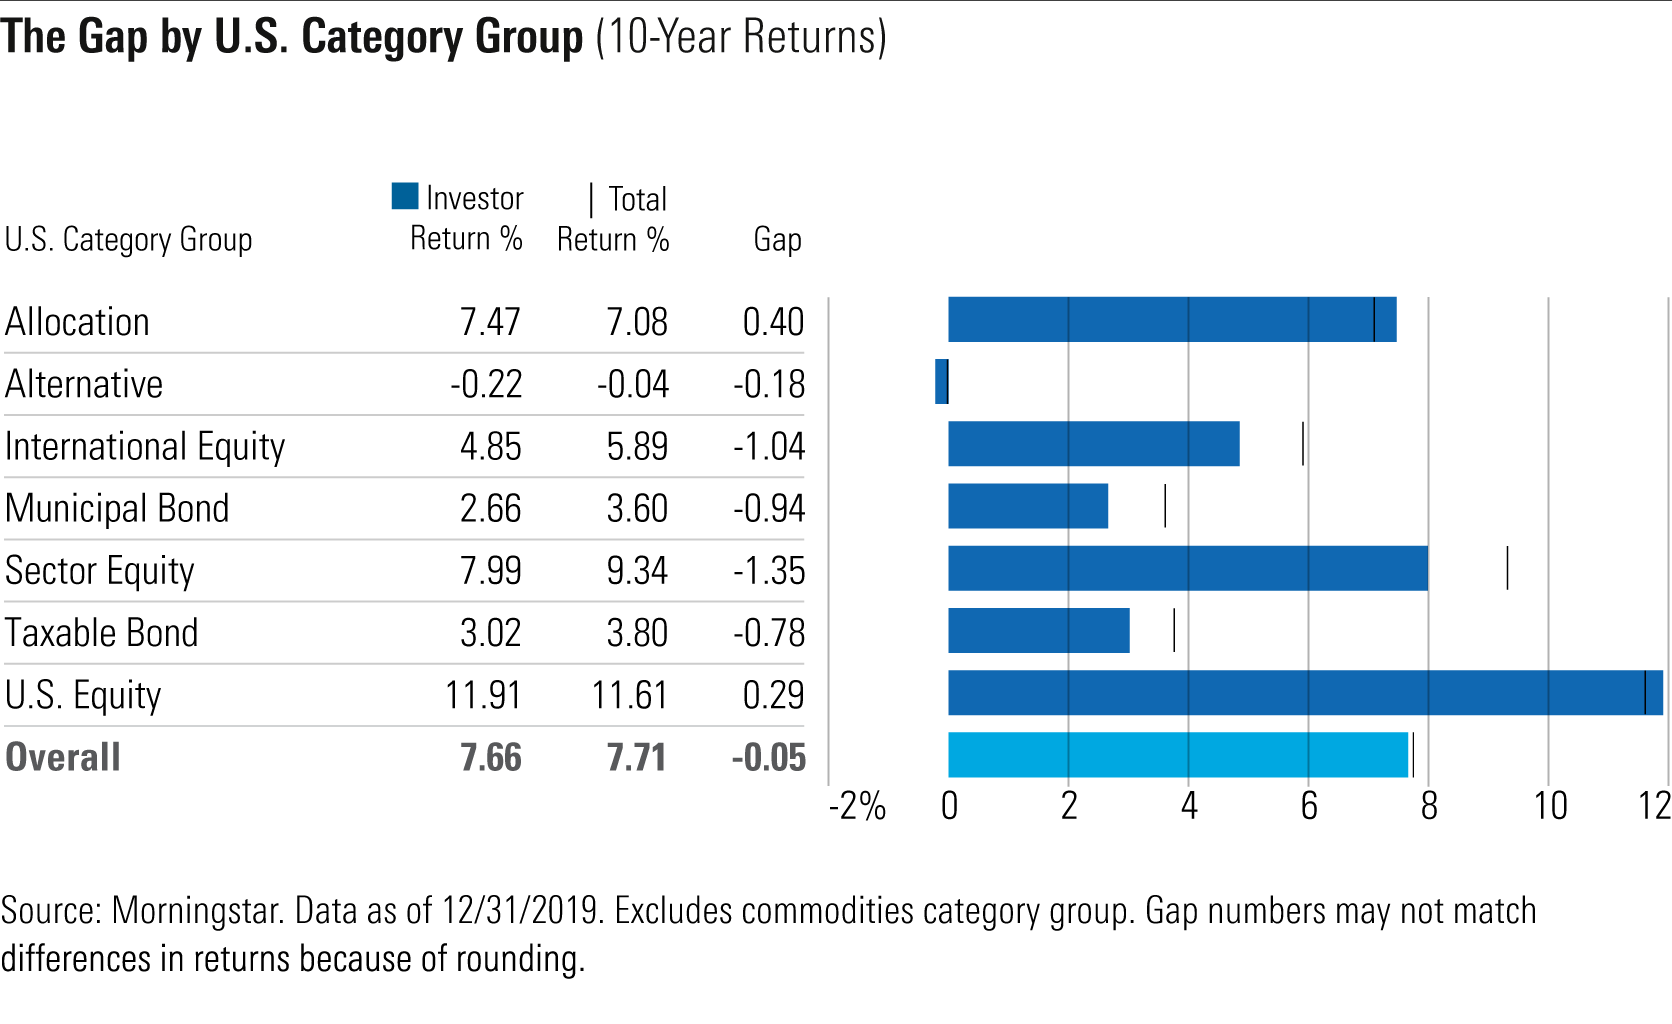
Here, we map out some of the study’s key findings.
What Is the Gap Between Investor Returns and Total Returns? Investor returns (also known as dollar-weighted returns or internal rates of return) often differ from reported total returns due to the timing of cash inflows and outflows.
To use a simple example, let's say an investor puts $1,000 into a fund at the beginning of each year. That fund earns a 10% return the first year, a 10% return the second year, and then suffers a 10% loss in the third year, for a 2.9% annual return over the full three-year period. But the investor's dollar-weighted return is negative 0.4%, because there was less money in the fund during the first two years of positive returns and more money exposed to the loss during the third year. In this case, there was a 3.3 percentage point per year gap between the investor’s return (negative 0.4%) and the fund’s (2.9%).
Our annual Mind the Gap study estimates the gap between investors’ dollar-weighted returns and funds’ total returns in the aggregate. This allows us to assess how large the gap is and how it’s changed over time.
We should note that the methodology used for this study includes funds that merged or became obsolete during the 10-year period ended Dec. 31, 2019, but doesn’t include newly created funds.
The Results: Dollar-Weighted Returns Aren't Too Shabby Overall, the gap between investor returns and reported total returns has shown notable improvement. As a whole, the returns that investors experienced were only slightly lower (by about 5 basis points per year) than reported total returns. That's an improvement over the gaps we found during the previous four 10-year periods, when investors earned about 56 basis points less per year, on average, compared with reported total returns.
Why the improvement? Part of it can be chalked up to the 2008 bear market dropping out of the 10-year period starting in 2018. Dollar-weighted returns improved across the board for the trailing 10-year period ended in 2018 and continued improving in nearly every category group for the period ended in 2019. Most category groups have also benefited from their size and maturity. As asset size has increased, net cash inflows and outflows carry less weight in investor returns. Finally, positive results for U.S. equity funds and allocation funds, which together made up more than half of all assets included in the study, helped offset negative return gaps in other areas.
As we've seen in the past, allocation funds--which combine stocks, bonds, and other asset classes--fared the best, with a positive gap of 40 basis points. By virtue of their diversified approach, allocation funds tend to have more-stable performance and are easier to own than funds that are subject to more-dramatic performance swings. Second, these funds are often used as core holdings for employer-sponsored retirement plans, such as 401(k)s. Retirement plan participants typically invest a set percentage of each paycheck, leading to more-consistent cash flows into the underlying funds.
U.S. equity funds also fared surprisingly well, with a positive return gap of 29 basis points. With about $7.2 trillion total assets for funds included in the study as of the end of 2019, this is by far the largest category group. The sheer size of this group helps buffer the impact of any cash inflows or outflows. In 2019, for example, about $250 billion flowed out of U.S. equity funds included in the study, but that was equivalent to less than 5% of total assets. As a result, total assets continued climbing during 2019, which was a positive as the 11-year bull market continued nearly unabated through the end of the year.
But Still Some Trouble Spots for Dollar-Weighted Returns A few categories yielded less encouraging results in terms of dollar-weighted returns.
- Specialty equity funds had the worst negative return gap, at negative 1.35 percentage points per year, on average. These funds are particularly prone to performance-chasing, with investors often piling into popular sectors after a period of strong performance and then bailing out when they fall out of favor.
- Alternative fund investors also experienced negative results. Not only has performance generally been disappointing, but it appears investors have timed their investments poorly, pumping money into the funds in 2013, only to see three straight years of lackluster returns, and pulling assets out in 2018, missing out on decent returns in 2019.
- Investor returns for municipal-bond funds lagged total returns by close to 1 percentage point per year, on average. Municipal-bond fund investors have been somewhat prone to bad timing, pouring an estimated $49 billion in net flows to funds included in our study in 2012 only to see losses in 2013 amid interest rate and credit concerns. The opposite happened in 2013 when investors, smarting from losses, pulled an estimated $60 billion from muni funds included in our study, thereby missing out on stronger returns when performance rebounded in 2014.
- With international equity funds, we didn't see overwhelming evidence for performance-chasing or erratic cash flows. However, there have been some missteps, such as when strong asset flows in 2013 were followed by negative returns in 2014. In addition, the group's overall asset growth has been a negative because returns haven't been as strong over the past several years. As a result, dollar-weighted returns have lagged total returns by about 1 percentage point per year, on average, for the 10-year period ended Dec. 31, 2019.
- Taxable-bond funds were also impacted by the sequence of returns. Total returns during the first half of the trailing 10-year period averaged 4.7% per year but dropped down to 3.05% per year during the second half of the period, when average asset levels were higher. That means returns in the second half carried more weight in the dollar-weighted return calculation. As a result, investor returns lagged total returns by about 0.9 percentage points per year. In percentage terms, taxable-bond funds (along with municipal-bond funds) had some of the bigger investor return gaps compared with total returns.
Comparing the Results: How Does Systematic Investing Impact Dollar-Weighted Returns? For the first time, we added a series of returns to see how the results would look in a hypothetical scenario in which an investor contributed equal monthly investments (dollar-cost averaging) to funds in each broad category group. We did so in order to gauge what investor returns would have looked like assuming consistent monthly cash flows.
Unlike our investor return data, which is weighted by asset size, the dollar-cost averaging analysis is based on equally weighted cash flows. By comparing investor returns with what they would have been assuming steady monthly investments, though, we can zero in on the impact of cash flow timing on investor returns.
We found areas that saw positive investor return gaps, such as U.S. equity and allocation, would have fared worse with a dollar-cost-averaging approach. Both of these category groups have experienced cash outflows for the past few years, but total assets have continued increasing. In other words, the majority of fund shareholders have followed a buy-and-hold approach, which helped dollar-weighted returns during a period of generally positive market performance.
On the flip side, investors would have captured more of their funds’ returns by taking a dollar-cost-averaging approach in the category groups that had negative gaps: alternative funds and sector equity funds. In these cases, investors would have been better served by dollar-cost averaging, the implication being that investors mistimed their purchases and sales.
The dollar-cost averaging data also helps shed light on the impact of sequence of returns. Across six of the seven category groups, returns for the dollar-cost averaging were lower than time-weighted total returns. This simply reflects the underlying math of total returns: If returns are generally positive, investors are typically better off making a lump-sum investment and holding it for the entire period.
Consistency Reaps Rewards for Dollar-Weighted Returns This year's results show that for the majority of dollars invested in mutual funds and exchange-traded funds, the returns investors actually experienced have been relatively close to reported total returns and even came out ahead in some cases. In addition, four out of the seven major category groups have shown improving investor return gaps over the past five 10-year periods. Most of the category groups with the largest asset bases have improved, meaning that the average investor experience for the bulk of investor assets has improved over time.
To be sure, there are still some spots where investor returns have lagged reported total returns, partly because of investor dollars that flood in after a strong performance period or head for the exits after an area turns south. Consistently negative return gaps for alternative funds and sector equity funds, in particular, suggest that many investors have failed to use these funds effectively. Overall, though, investors who follow a consistent investment approach and avoid chasing performance have been well-rewarded over time.
This article is adapted from research that was originally published in Morningstar Direct's Research Portal. If you're a user, you have access. If not, take a free trial.
/cloudfront-us-east-1.images.arcpublishing.com/morningstar/DOXM5RLEKJHX5B6OIEWSUMX6X4.png)
/cloudfront-us-east-1.images.arcpublishing.com/morningstar/ZKOY2ZAHLJVJJMCLXHIVFME56M.jpg)
/cloudfront-us-east-1.images.arcpublishing.com/morningstar/IGTBIPRO7NEEVJCDNBPNUYEKEY.png)
:quality(80)/s3.amazonaws.com/arc-authors/morningstar/360a595b-3706-41f3-862d-b9d4d069160e.jpg)