
U.S. Fund Flows Increase Equity Funds’ Pain in July
U.S. and international equity fund flows are ugly so far in 2020.
/s3.amazonaws.com/arc-authors/morningstar/a25c5a3e-6a5c-495e-9278-eb867855f392.jpg)

Editor’s note: Read the latest on how the coronavirus is rattling the markets and what investors can do to navigate it. This is an excerpt from the Morningstar Direct U.S. Asset Flows Commentary for July 2020. Download the full report.
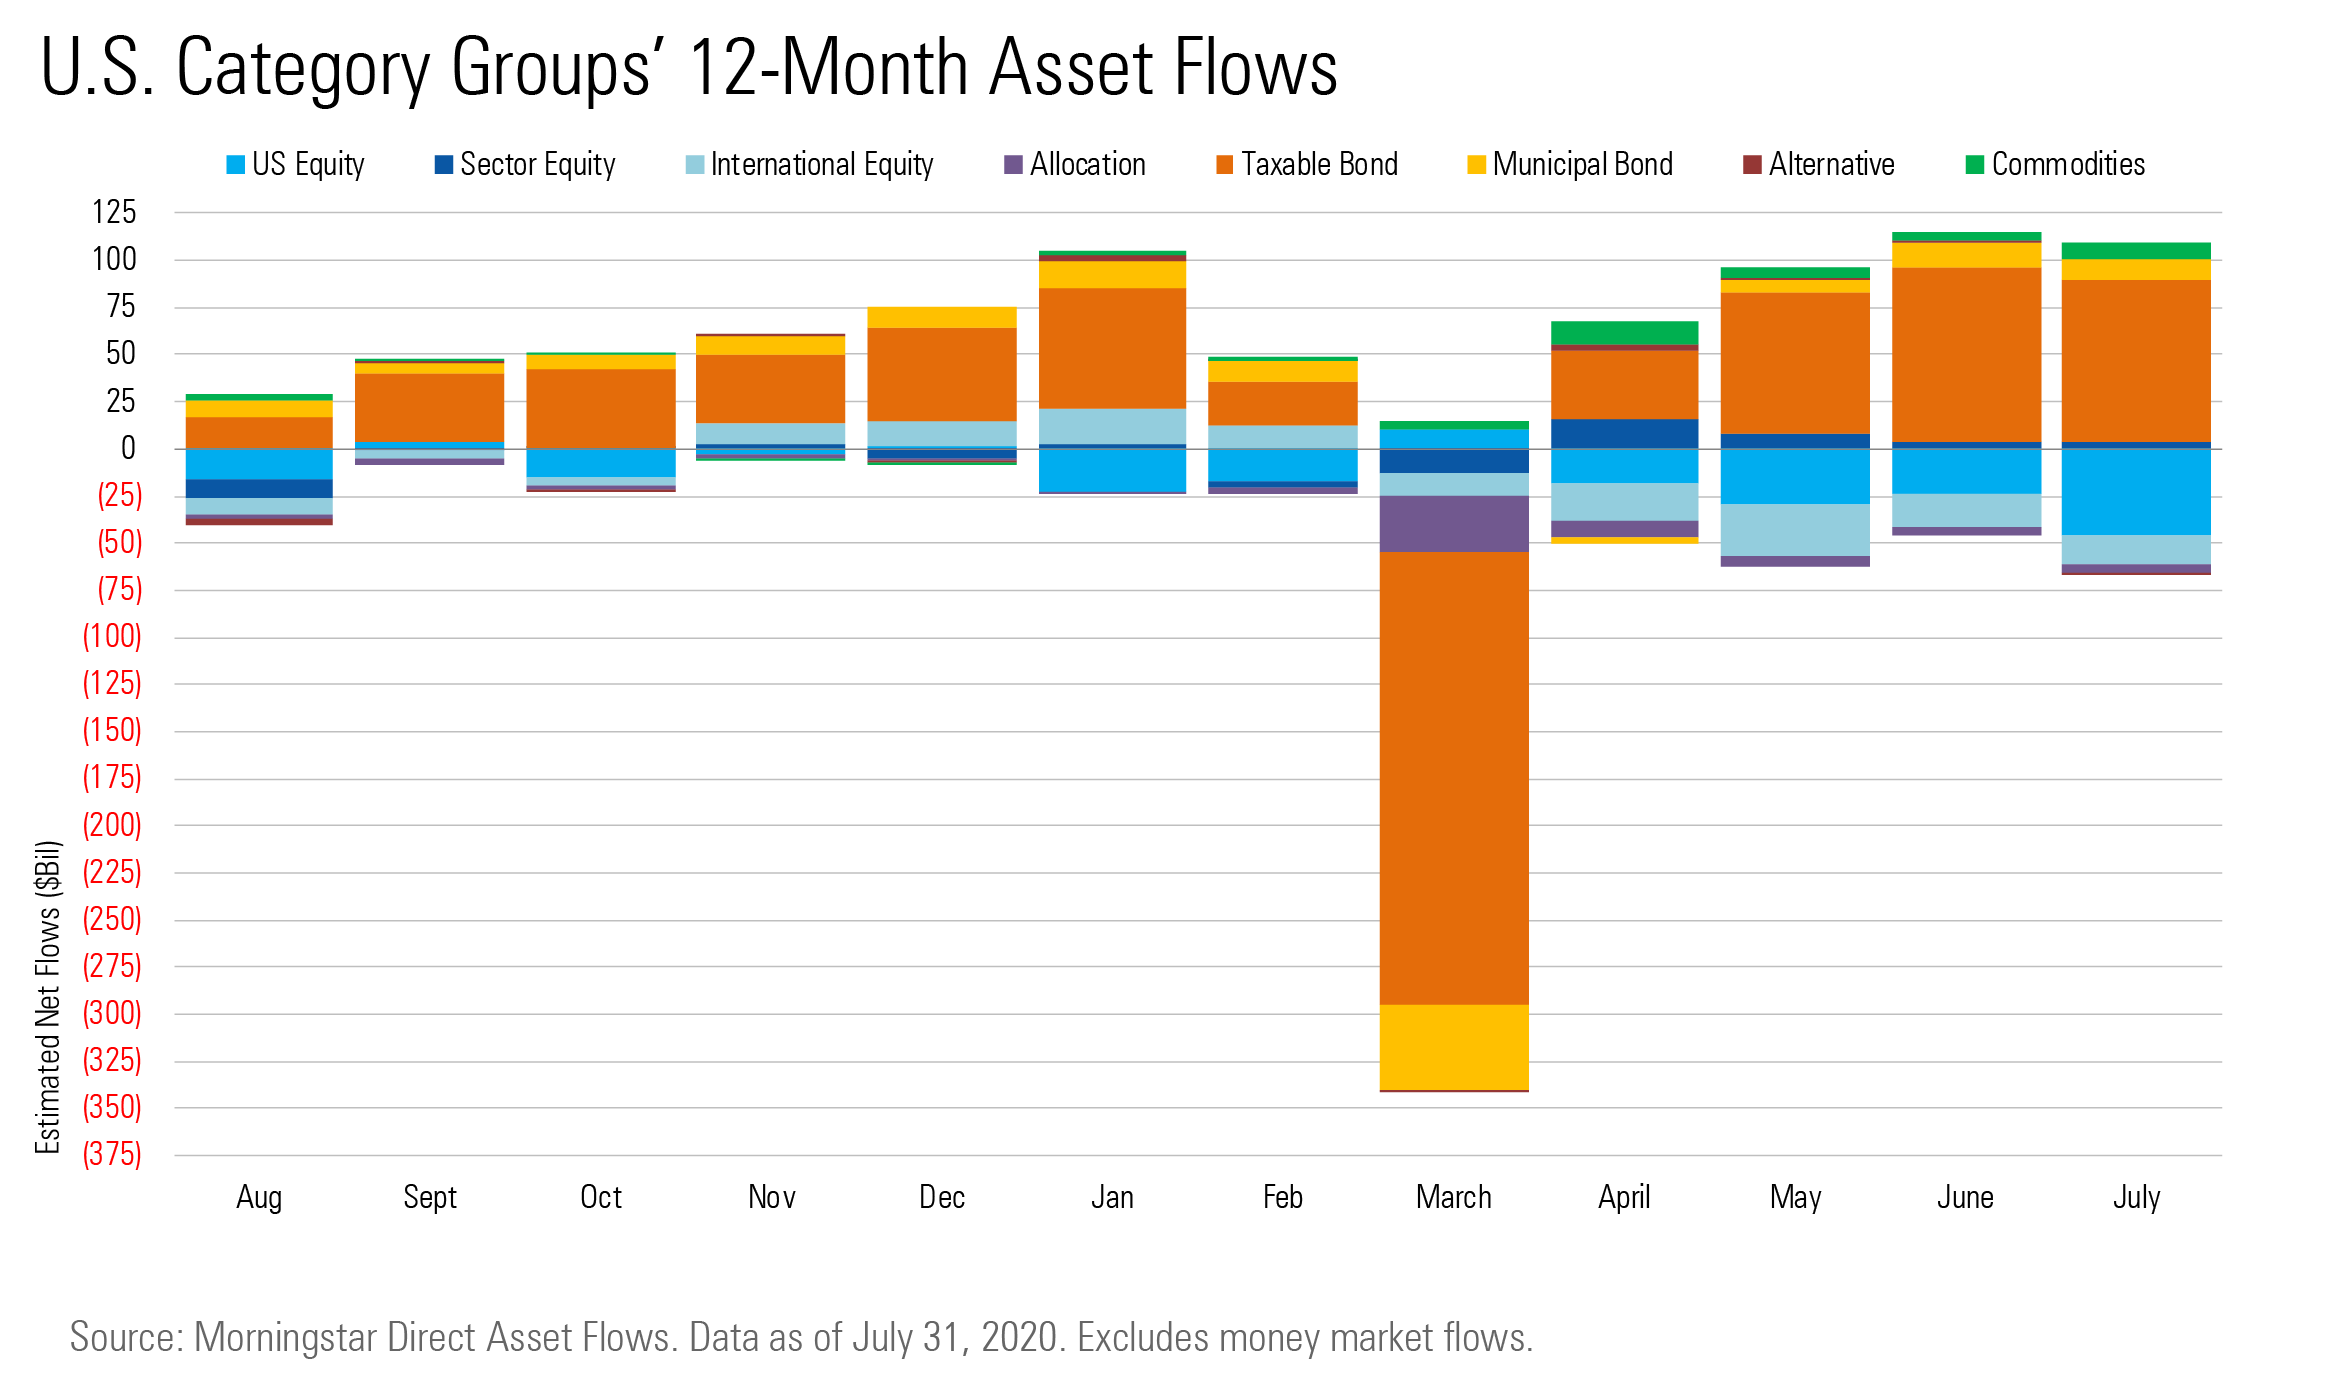
Asset flows have followed some consistent patterns since the market's turmoil in February and March 2020. Investors continue to look toward taxable-bond funds while turning away from U.S. equity and international-equity strategies. Long-term open-end mutual funds and exchange-traded funds have collected assets each month since April, including $43 billion in July.
Long-term funds still have a way to go, however, before they recoup their outflows from March. Total inflows from April through July were $164 billion, just more than half of the $327 billion of outflows those funds suffered in March.
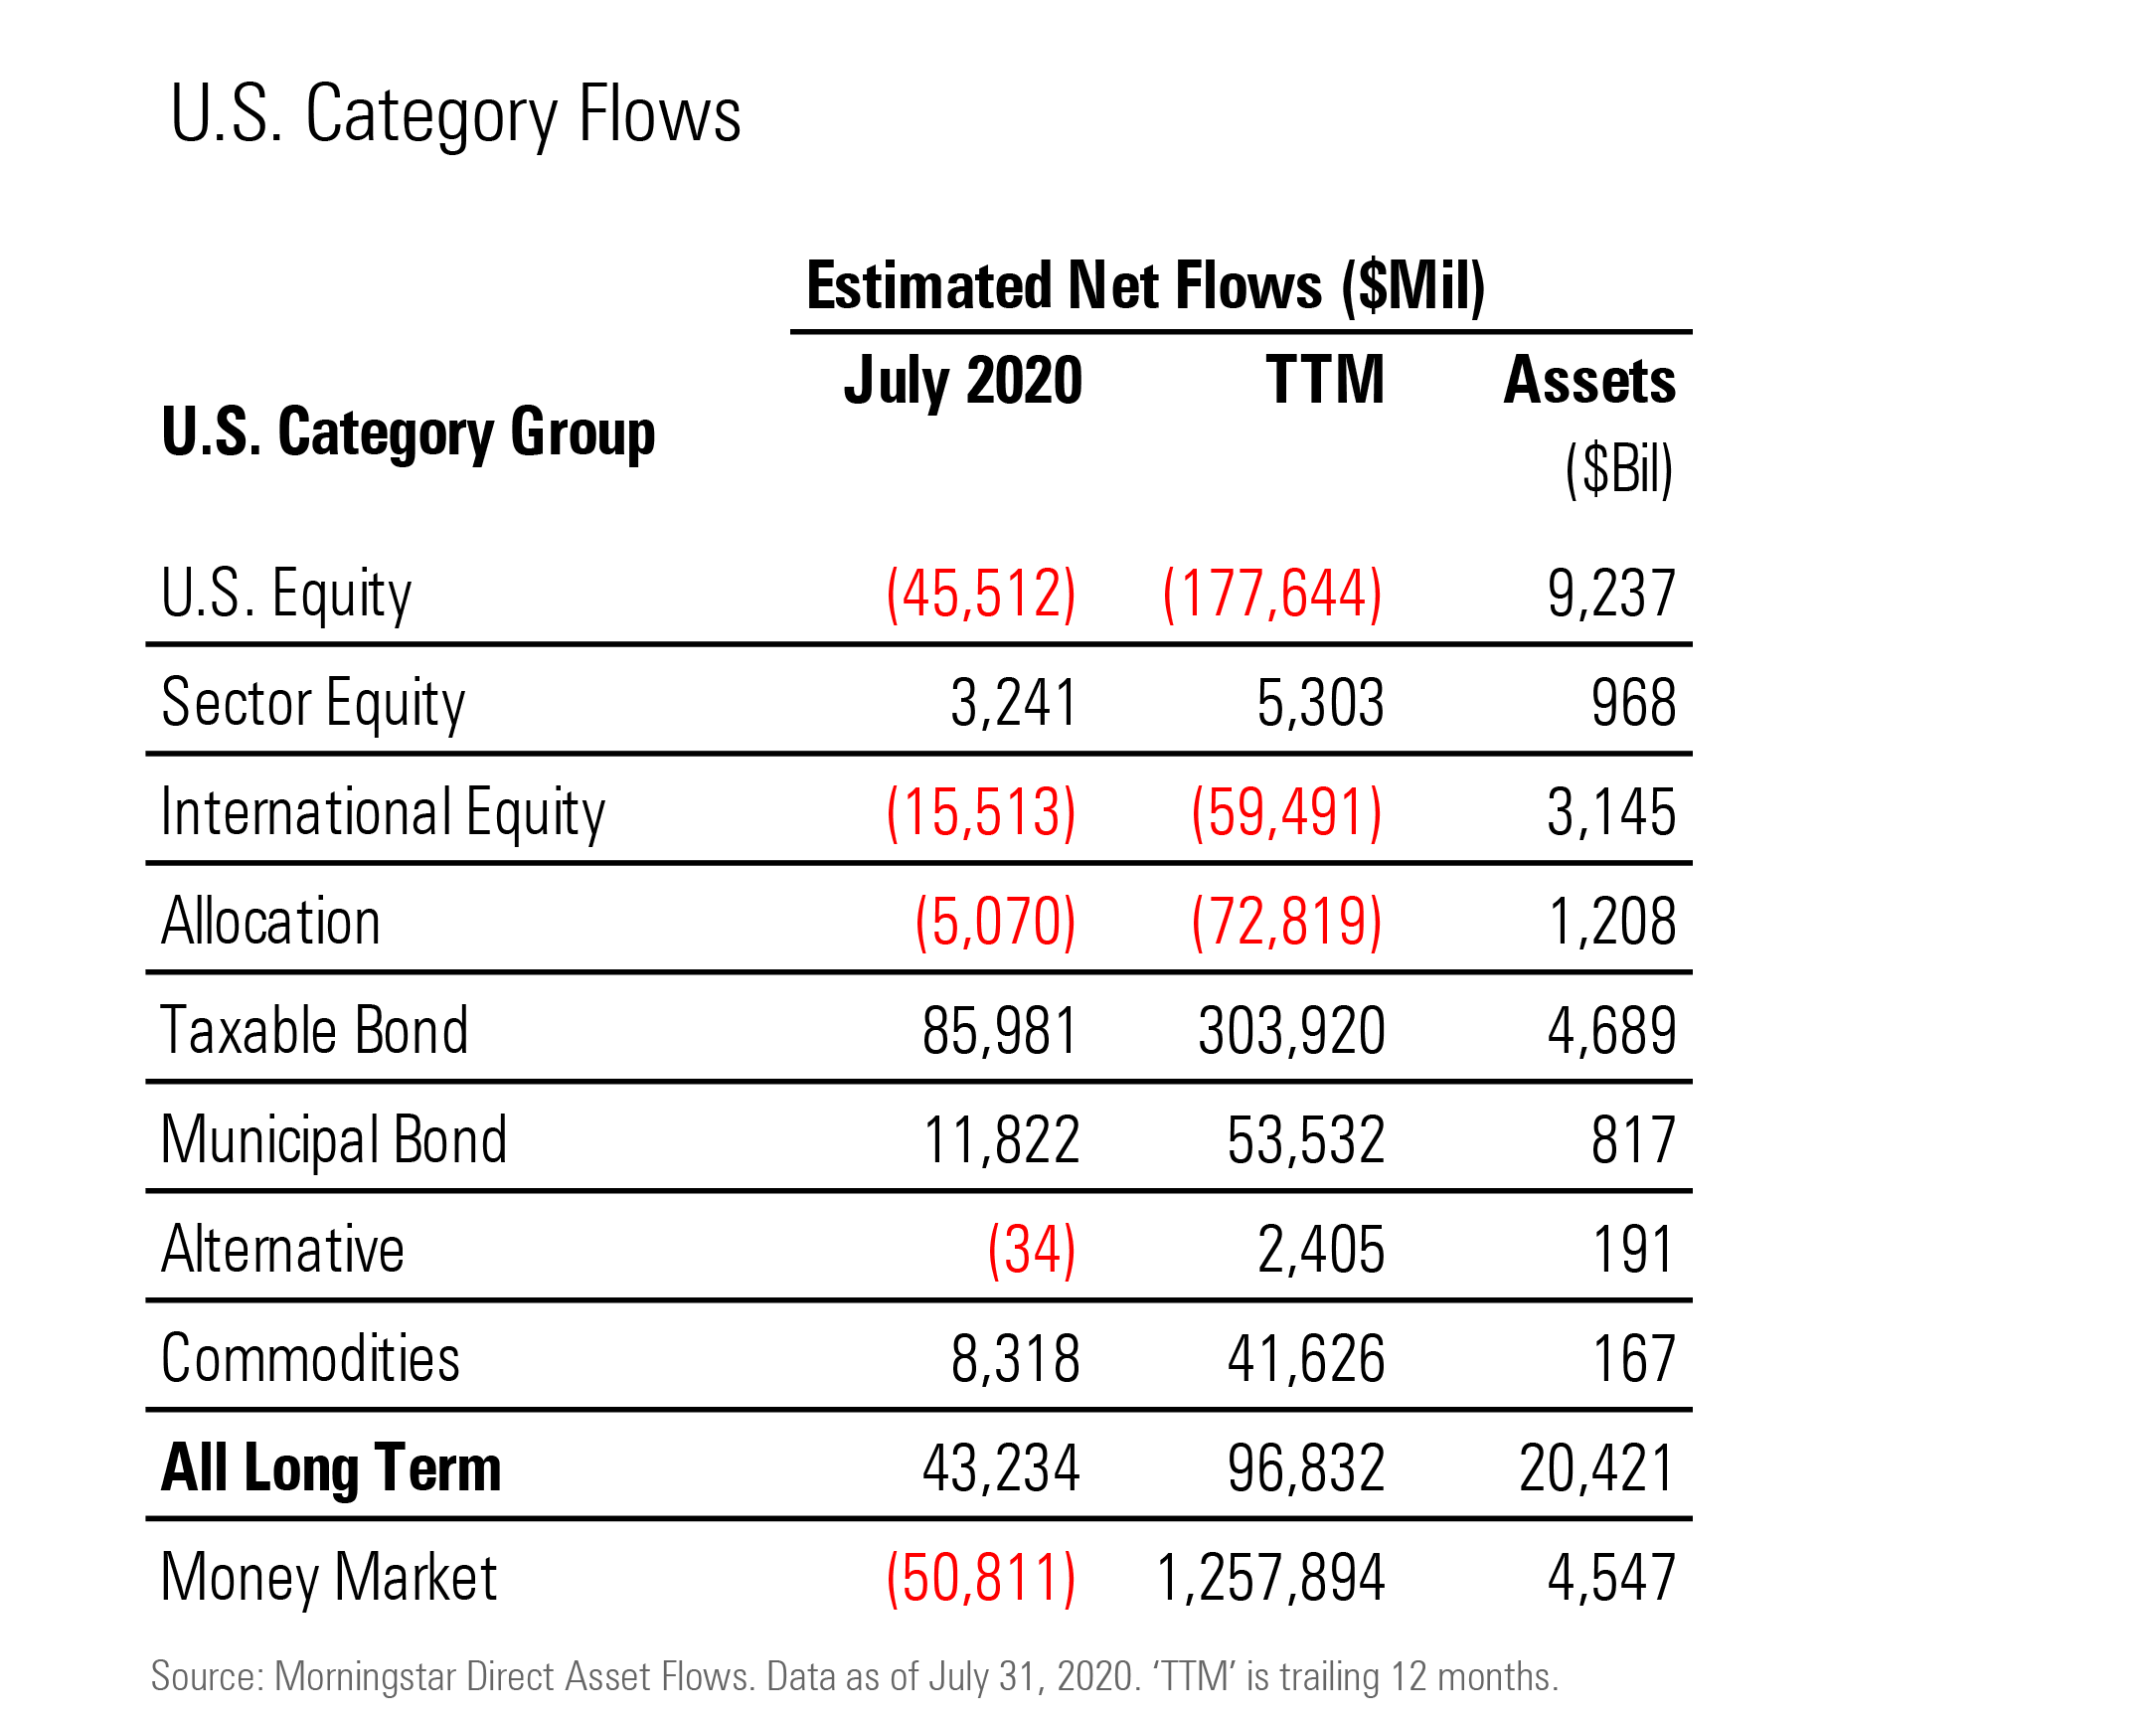
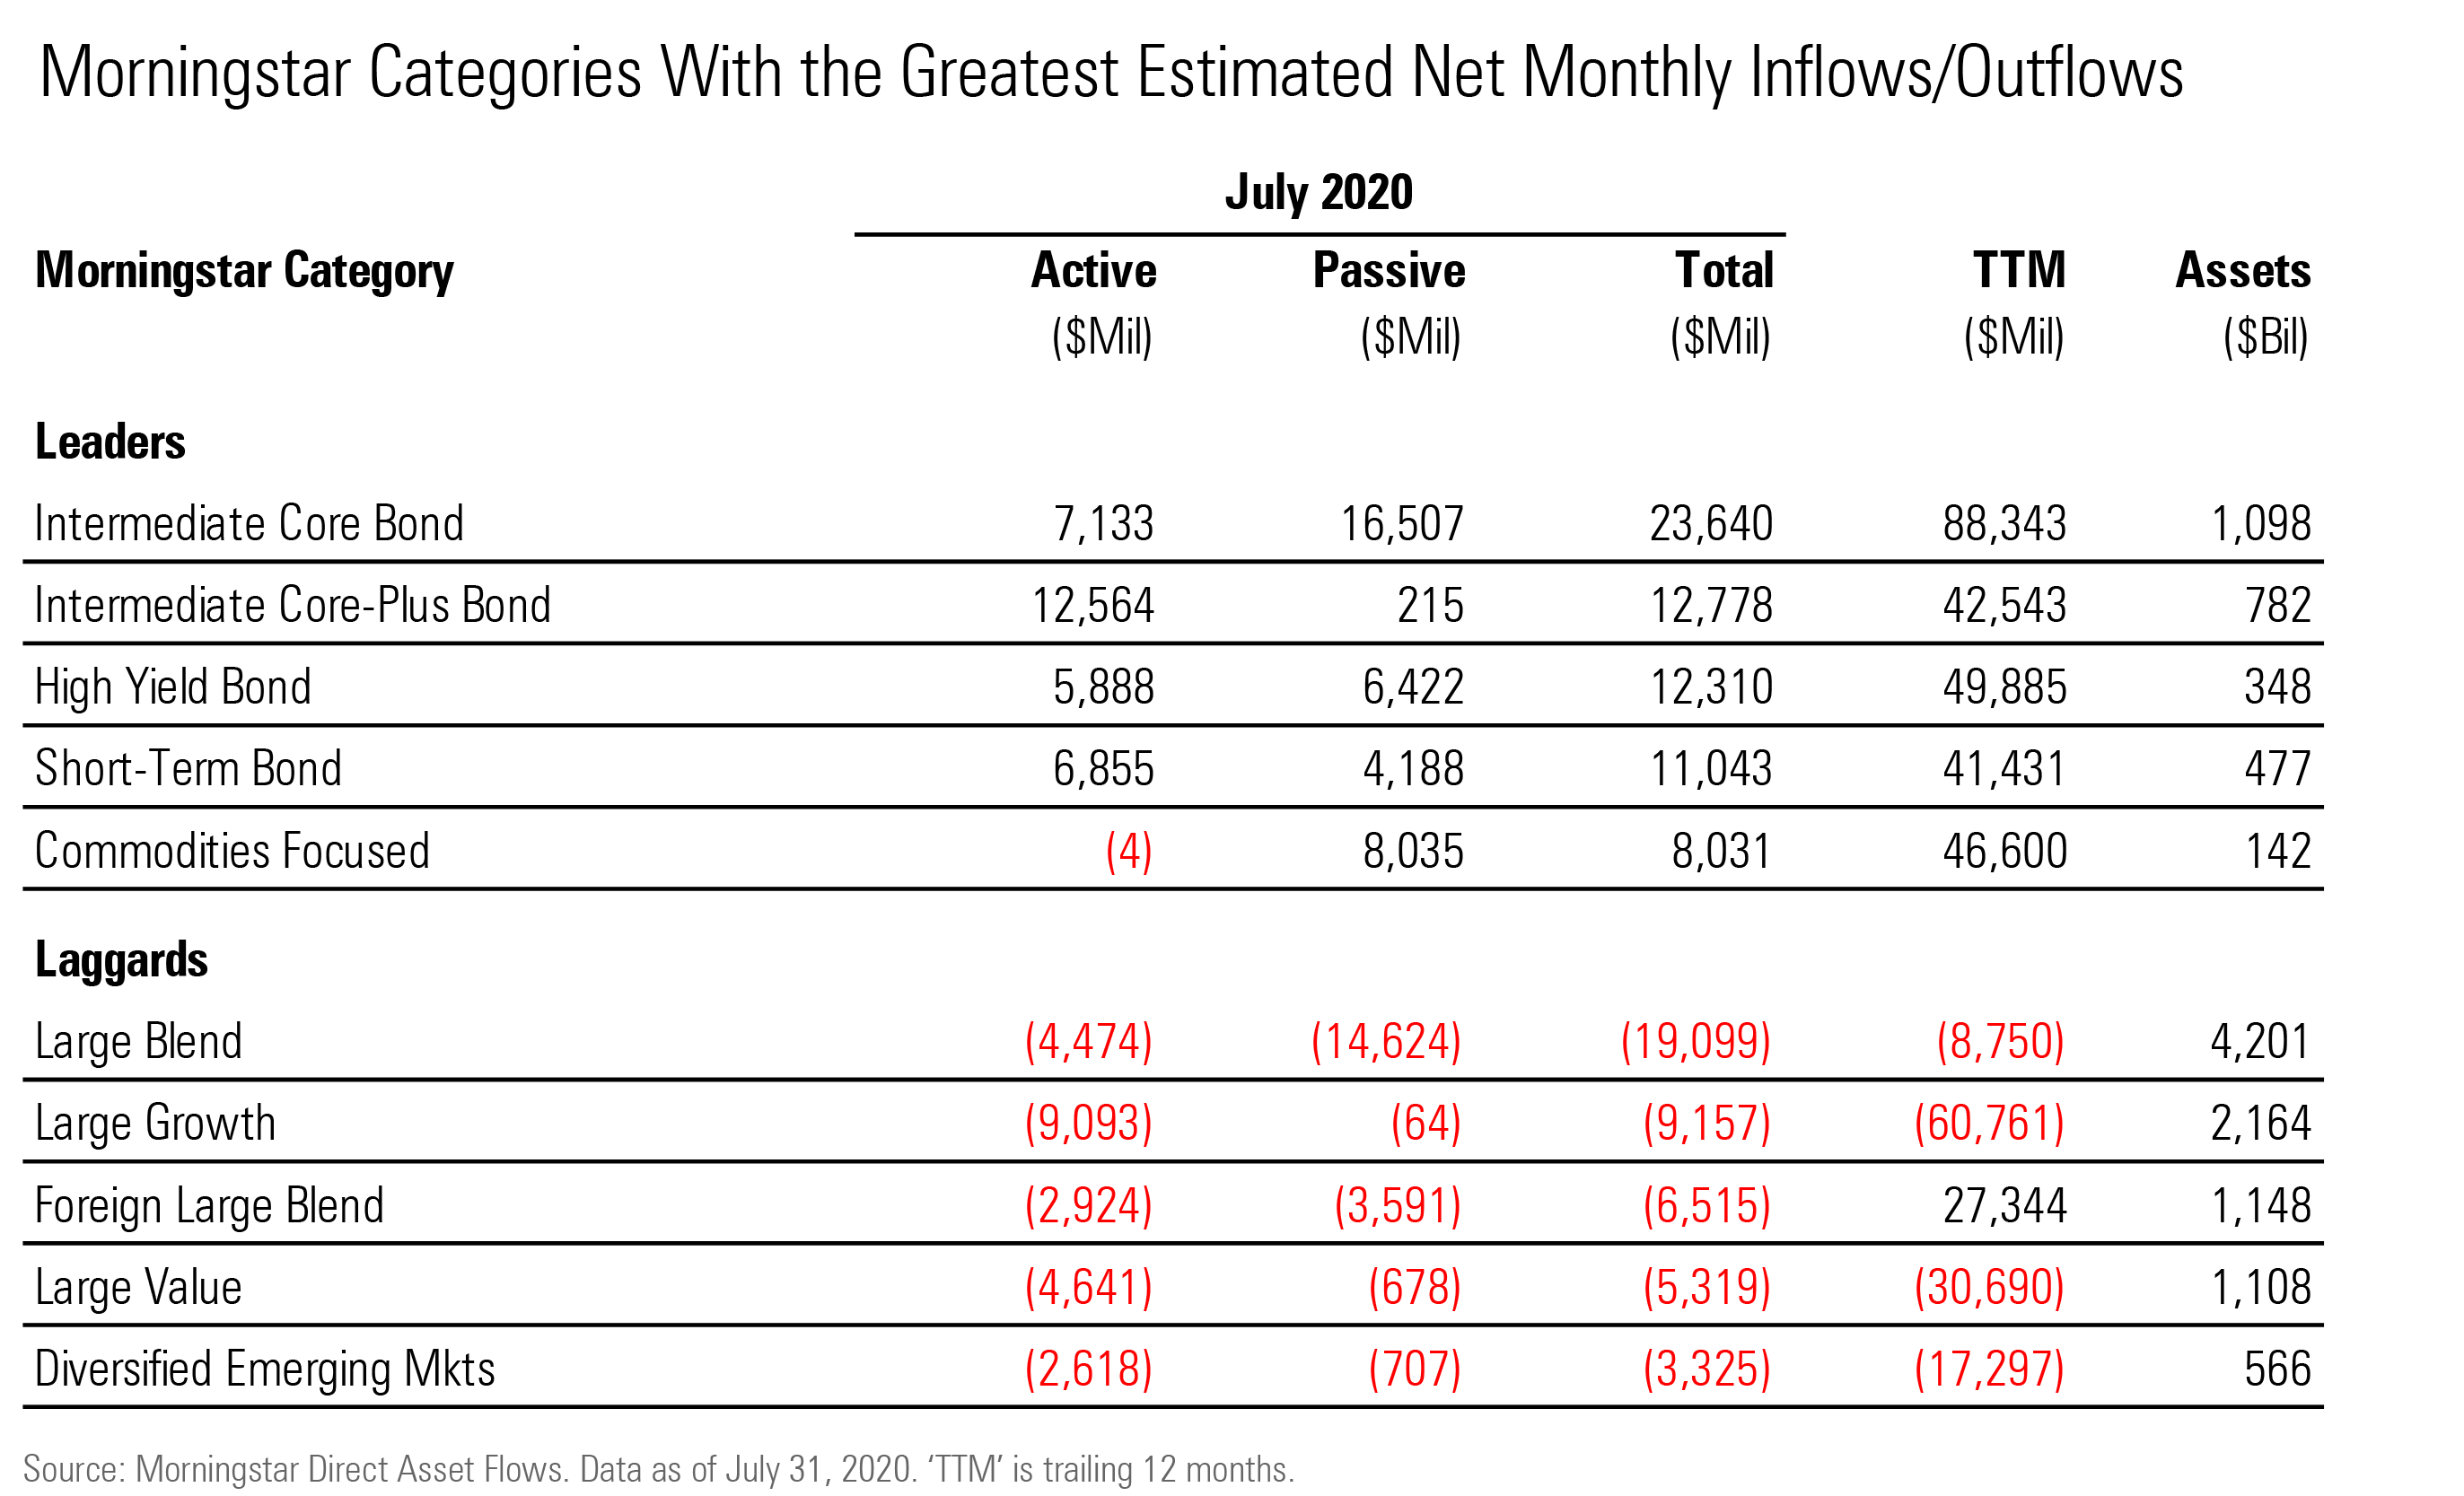
Apart from a brief but severe detour in March, taxable-bond funds are thriving. They took in $86 billion in July, the second-highest monthly tally behind June's $92 billion record. Many investors sought middle-of-the-road exposure to credit and interest-rate risk. Intermediate core bond funds took in a record $24 billion, edging the previous record of $23 billion set just one month prior. Intermediate core-plus bond funds landed $13 billion of inflows in July, also a record.
In contrast to taxable-bond funds' inflows, U.S. equity funds had record outflows of nearly $46 billion in July. All told, U.S. equity funds' $147 billion of net outflows puts 2020 on track to become the group's worst year ever. That tally already exceeds the calendar-year record of $63 billion of outflows in 2015, and it tops the $143 billion withdrawn from 2010 through 2012.
No domestic Morningstar Style Box category (large growth, small value, and so on) had positive flows in July, for the year to date, or for the trailing 12 months. International-equity funds' $63 billion of net redemptions so far in 2020 is well ahead of calendar-year 2008's record of $53 billion. In fact, 2020 is set to become only the third year of net outflows for the category group (along with 2008 and 2001) in data going back to 1993.
Allocation funds have been in the doldrums for a while. Their $5 billion of net redemptions in July marked the group's 62nd consecutive month of outflows. As a result, those funds' $1.2 trillion in total assets in July was just about the same as in June 2015 despite the market's appreciation in the interim.
Sector-equity funds have been a rare bright spot, however. Investors have targeted sectors such as technology and health that could benefit from social distancing policies, work-from-home arrangements, e-commerce, and the search for a coronavirus vaccine. July's $3 billion of inflows marked the group's fourth consecutive positive month. Tech funds alone added more than $2 billion, more assets than any other equity category in July.
Commodities funds also posted another strong month in July. Investors continued to seek protection in precious-metals funds, plowing $4.0 billion into SPDR Gold Shares GLD and a total of $3.5 billion into iShares Gold Trust IAU and iShares Silver Trust SLV.
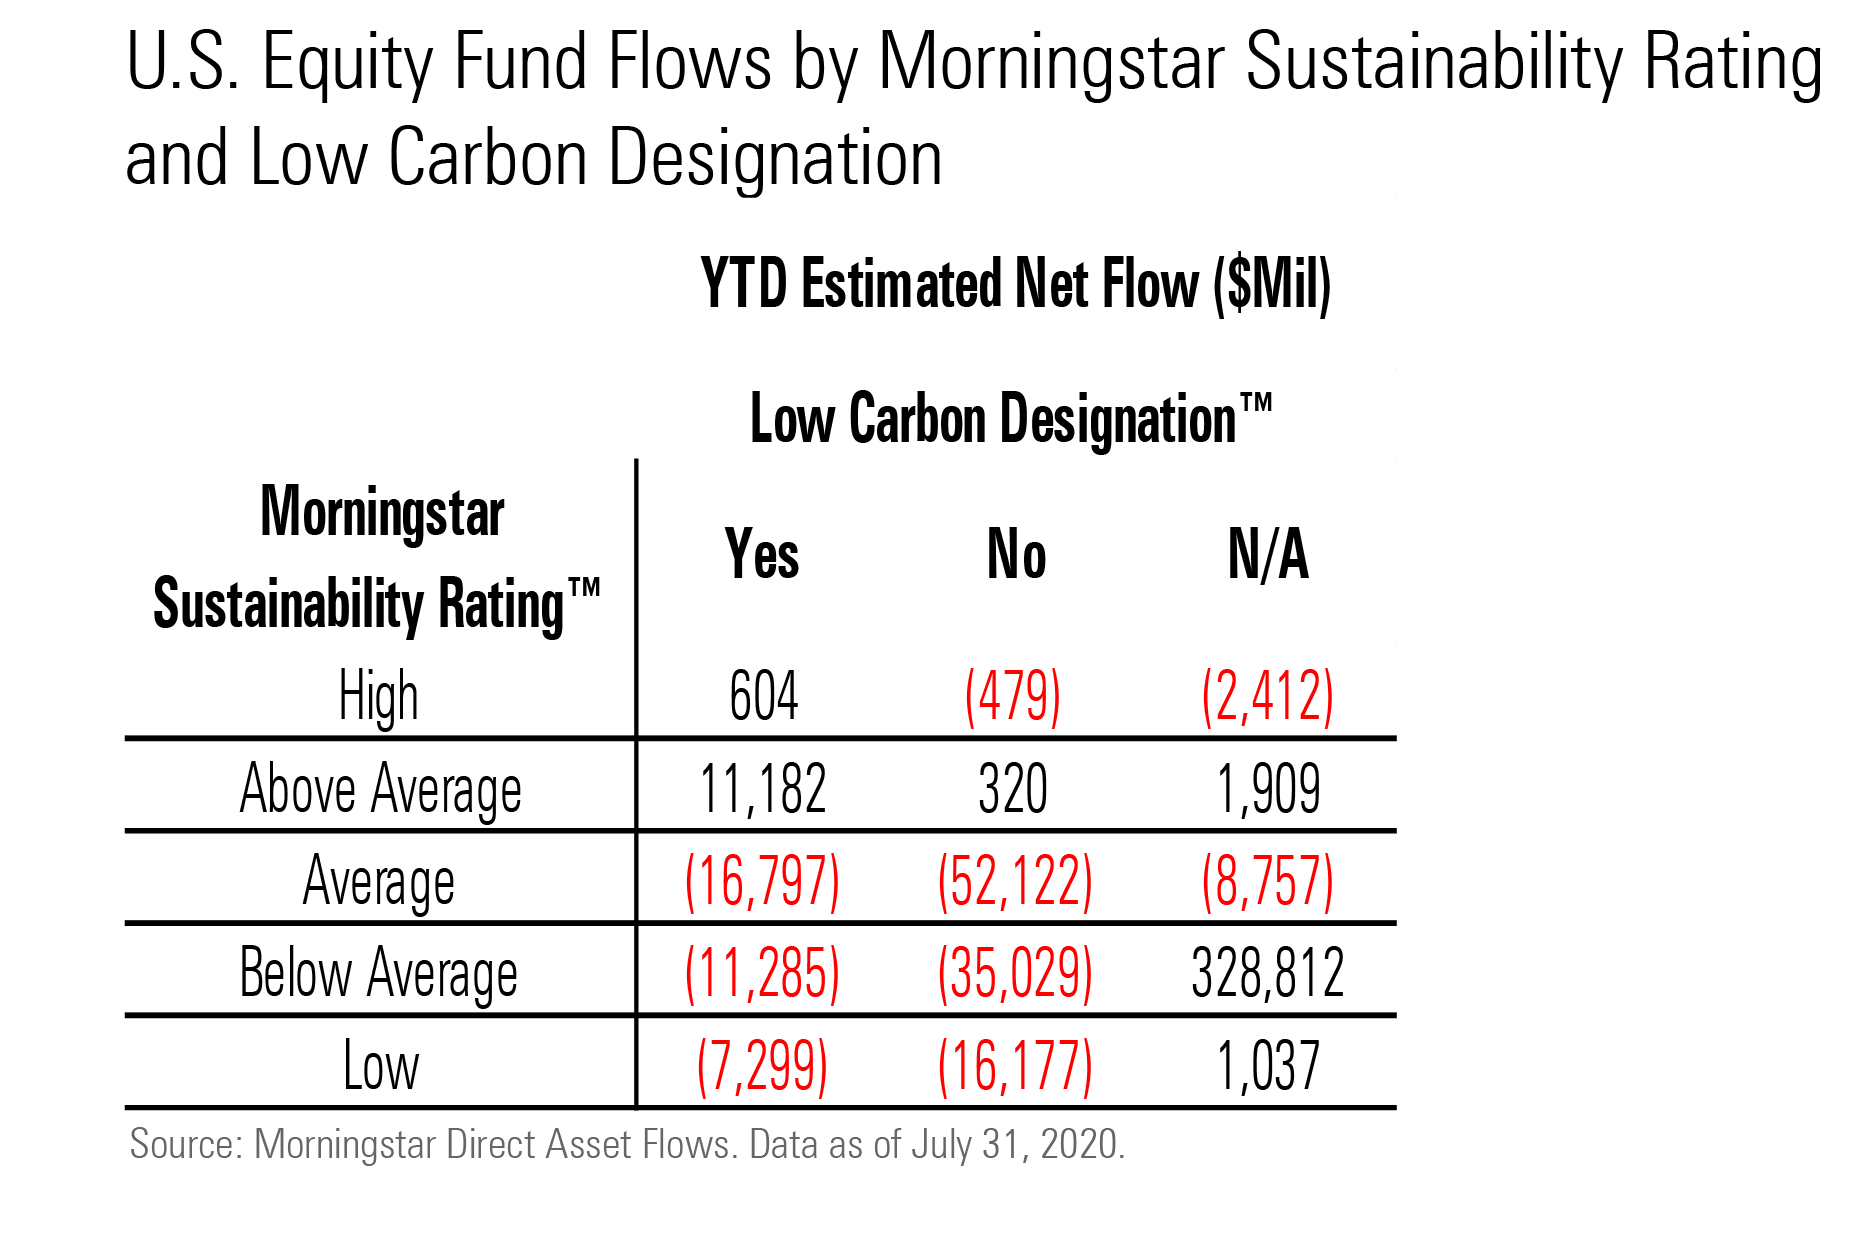
Morningstar debuted two environmental, social, and governance-related lenses for looking at flows in July: the Morningstar Sustainability Rating (or "globe rating") and the Morningstar Low Carbon Designation. U.S. equity funds with the Low Carbon Designation and High or Above Average sustainability ratings (in other words, the most ESG-friendly funds) have had net inflows for the year to date; most other combinations had net outflows.
IShares followed a strong June with another $16 billion of inflows in July, topping the list of fund families. Much of that went into taxable-bond funds, including investment-grade and high-yield corporate bond ETFs. The Federal Reserve continues to be active in those segments, but its purchases do not account for all (or even the majority) of iShares' flows. The Fed reported only $157 million in total purchases of iShares iBoxx $ Investment Grade Corporate Bond ETF LQD and iShares iBoxx $ High Yield Corporate Bond ETF HYG for July, just a fraction of those funds' estimated $5 billion of inflows. Beyond taxable bonds, investors also pumped money into iShares' sector-equity funds such as iShares US Medical Devices ETF IHI and iShares Nasdaq Biotechnology ETF IBB.
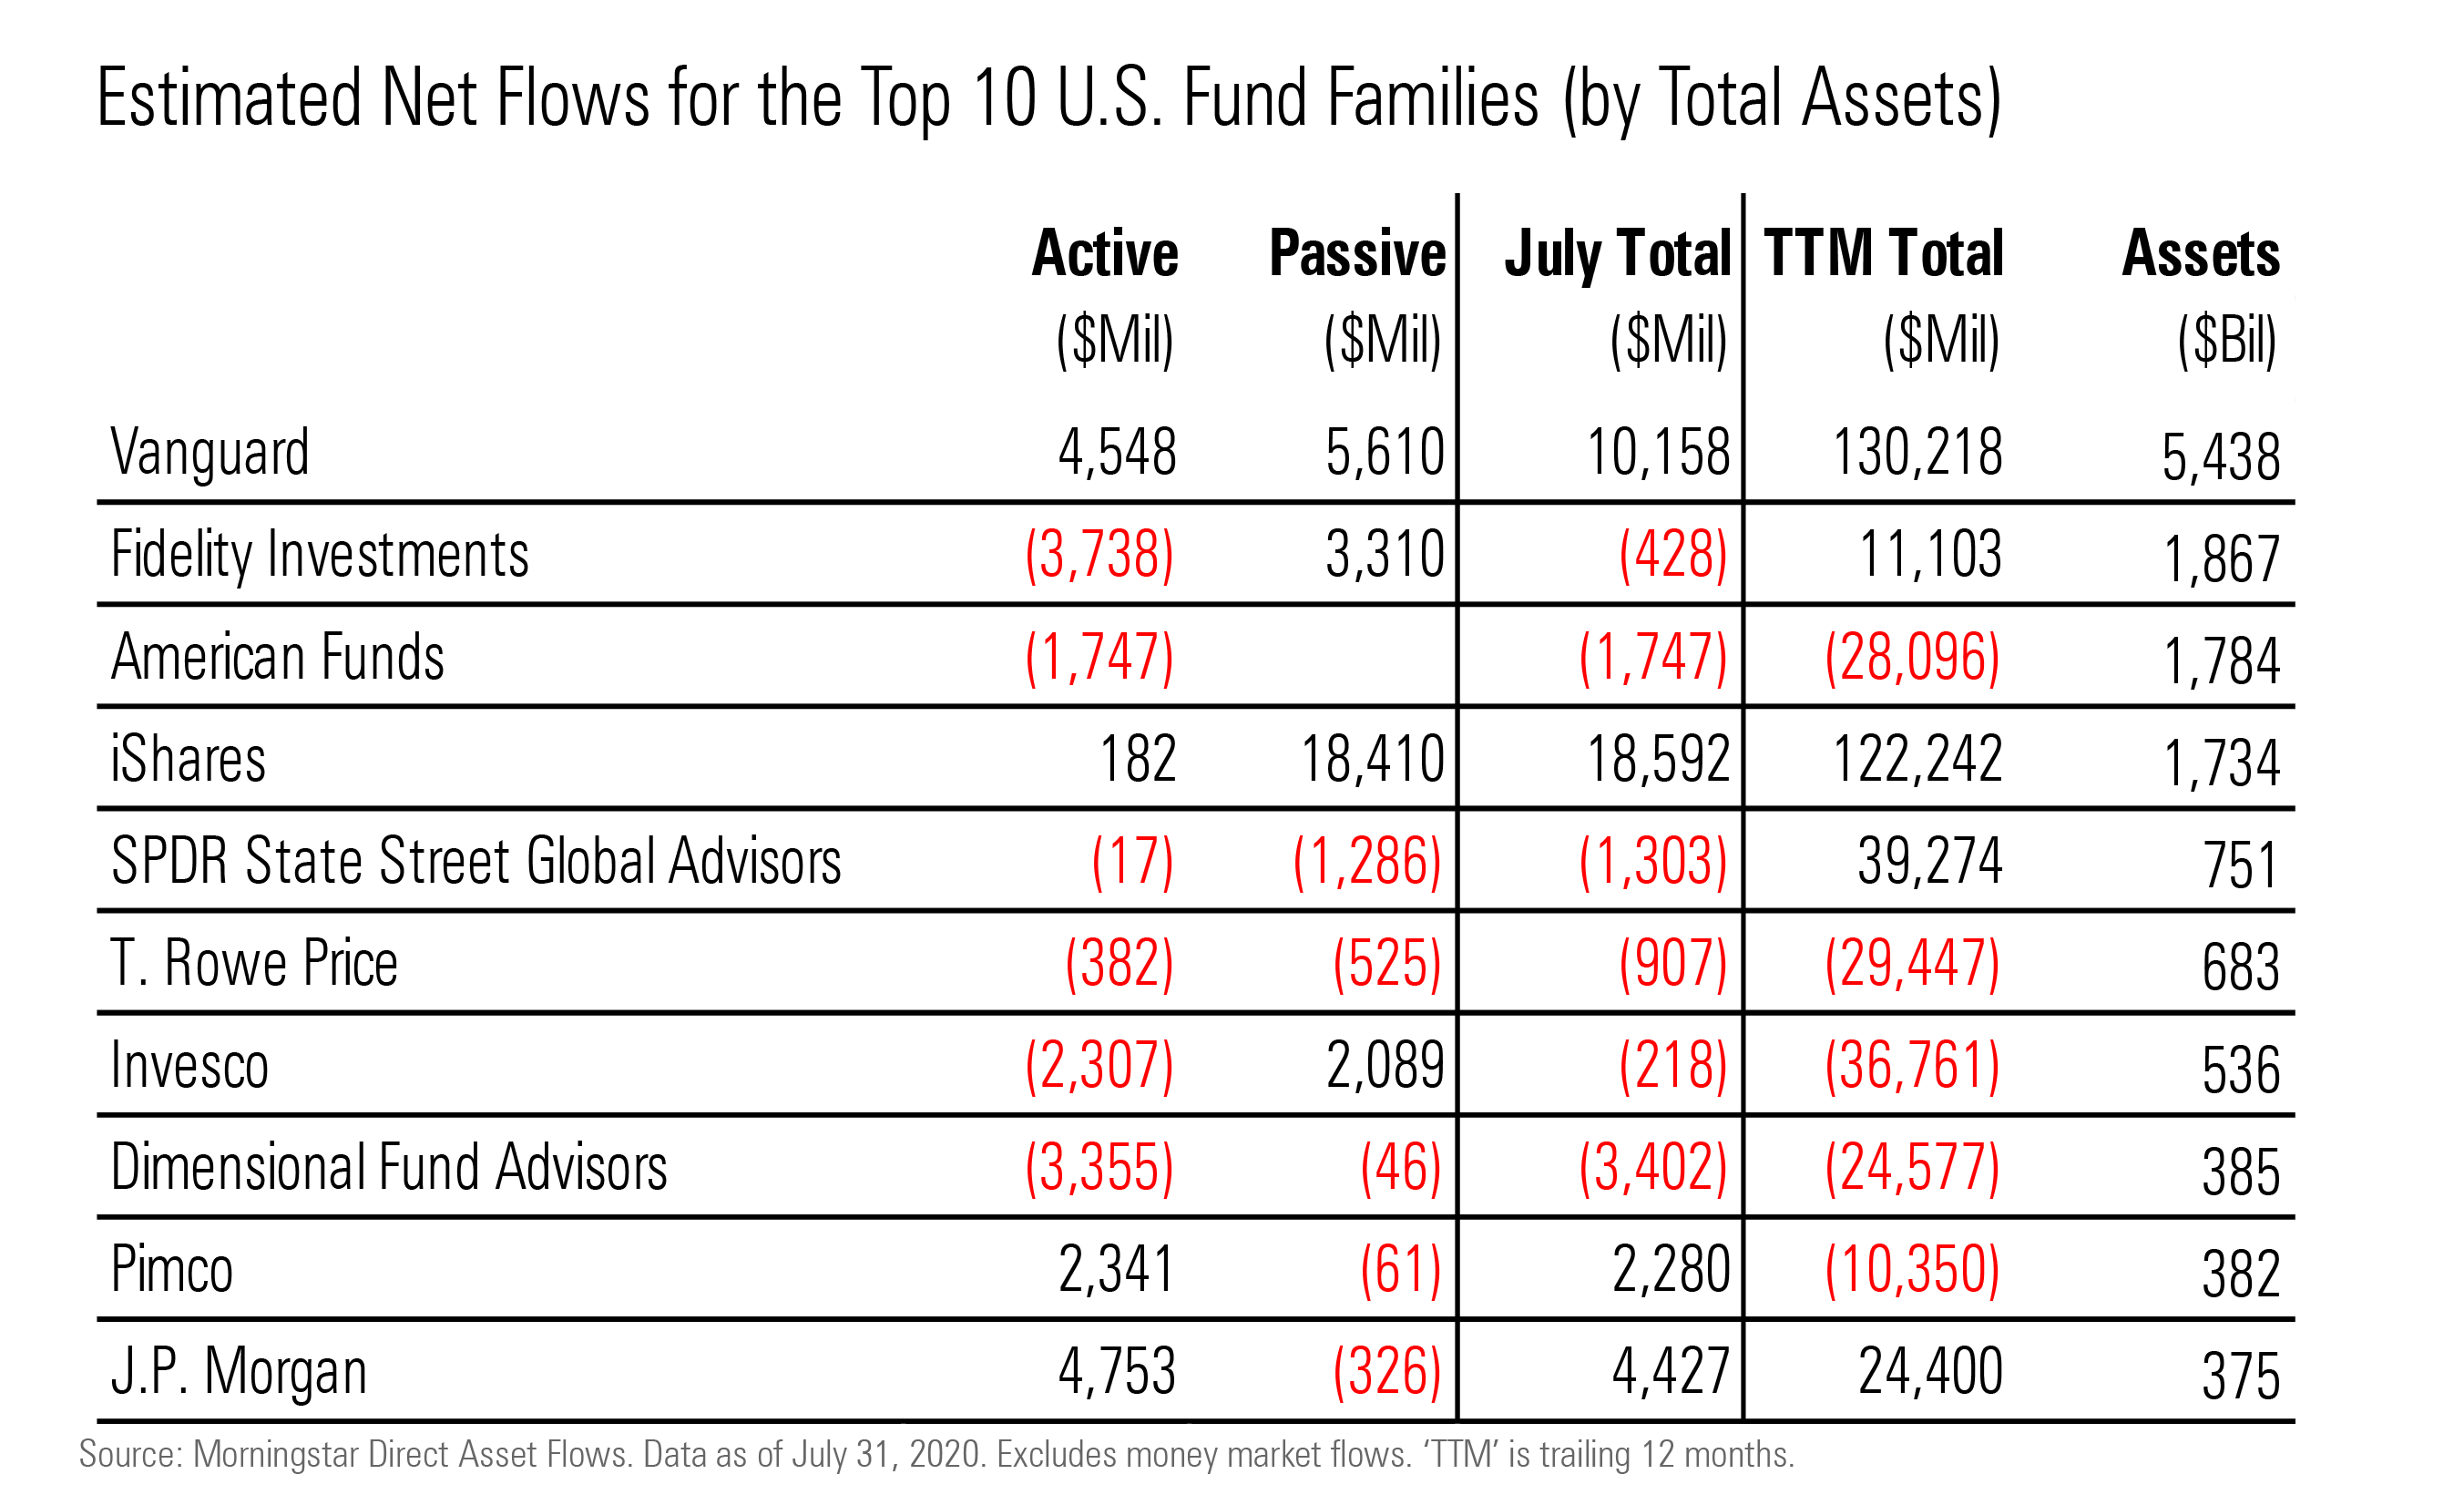
Vanguard's actively and passively managed products roughly split the firm's $10 billion of inflows in July. On the active side, taxable-bond funds ruled, with Vanguard Ultra-Short-Term Bond VUSFX collecting $1.4 billion. Among its passive funds, the rotation from stock to bond strategies stood out, as Vanguard Total International Bond Index VTABX and Vanguard Total Bond Market Index VBTLX took in more than $12 billion, while investors yanked a total of $8 billion from Vanguard Total International Stock Index VTSNX and Vanguard 500 Index VFIAX. Some of this might owe to investor rebalancing as the S&P 500 rose 5.6% in July.
Some active managers continued to suffer in July. Dimensional Fund Advisors and American Funds had redemptions of $3 billion and $2 billion, respectively. Meanwhile, Oakmark bled more assets. The firm had $1.4 billion of outflows in July, extending a streak of monthly outflows going back to May 2018. Over that time, the firm's total long-term fund assets nearly halved, to $49 billion from $96 billion. While Oakmark's value-leaning approach might explain some of its struggles in a growth-favoring equity market, that can't be said for Primecap. Primecap's strategies tilt toward growth--yet the firm's suite of funds suffered nearly $740 million of outflows in July.
Note: The figures in this report were compiled on Aug. 11, 2020, and reflect only the funds that had reported net assets by that date. Franklin Templeton and Artisan had not reported. Morningstar Direct clients can download the full report here.
The author or authors do not own shares in any securities mentioned in this article. Find out about Morningstar’s editorial policies.
/cloudfront-us-east-1.images.arcpublishing.com/morningstar/ZKOY2ZAHLJVJJMCLXHIVFME56M.jpg)
/cloudfront-us-east-1.images.arcpublishing.com/morningstar/IGTBIPRO7NEEVJCDNBPNUYEKEY.png)
/cloudfront-us-east-1.images.arcpublishing.com/morningstar/HDPMMDGUA5CUHI254MRUHYEFWU.png)
:quality(80)/s3.amazonaws.com/arc-authors/morningstar/a25c5a3e-6a5c-495e-9278-eb867855f392.jpg)