
Where Are the Liquid Alternative Shareholders’ Yachts?
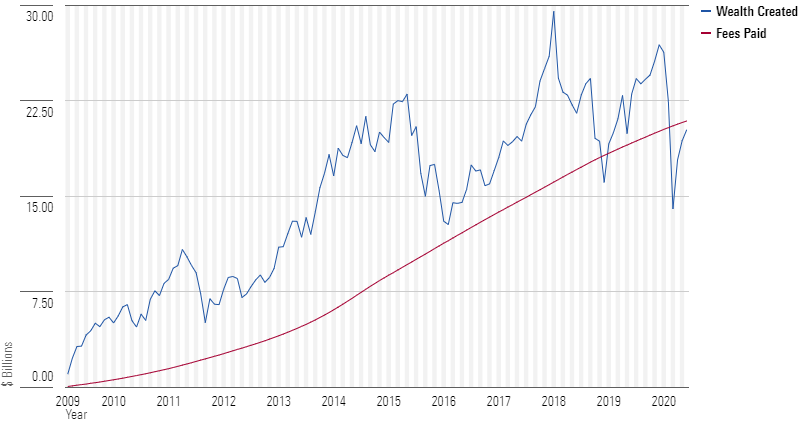
Since March 2009, investors have collectively paid $1 billion more in fees to liquid alternative mutual funds than what they’ve gained in return.
/s3.amazonaws.com/arc-authors/morningstar/af89071a-fa91-434d-a760-d1277f0432b6.jpg)
/s3.amazonaws.com/arc-authors/morningstar/fadee740-dfeb-494d-95b1-c462d0ac1f59.jpg)
There’s an old joke about the economic imbalance between firms that provide financial services and their investors. Upon seeing the fleet of bankers’ and brokers’ boats in New York Harbor, a Wall Street tourist asks, “Where are all the customer’s yachts?” Of course, those didn’t exist because the benefits of offering financial services was greater than their wealth generation.
A lot has changed in financial services since Fred Schwed, a former broker, first popularized this joke in 1940, and most of these changes have been in investors' favor. The SEC abolished fixed brokerage commissions in 1975, opening the way for the arrival of discount brokers. Leaving investment advice to their full-service counterparts, they started a trend of lowering trading costs to now a fraction of their pre-1975 levels, where they exist at all anymore. Investment shops' management fees have also come down considerably as index funds have enabled buy-and-hold investors to essentially match the market for what would have been regarded as a pittance when Jack Bogle pioneered the first retail version, beginning in 1975 as well.
Against this backdrop, liquid alternative strategies, a relative newcomer to the industry, seem stuck in the past. Born amid the ashes of the 2008 financial crisis from ideas drawn from hedge funds, they were supposed to bolster the diversification of traditional stock and bond portfolios. Unfortunately, liquid alternatives have done a better job mimicking hedge funds’ high fees than delivering differentiated sources of return. We estimate investors collectively paid about $21 billion in fees to liquid alternative funds between March 2009 and June 2020 while reaping only $20 billion in return. By contrast, funds within the allocation--50% to 70% equity Morningstar Category over the same period generated 17 times more wealth than investors paid in fees.
Liquid Alternative Fees Have Bucked the Low-Cost Trend Investors have reaped less from liquid alts in part because they've paid more. Liquid alternative funds, in other words, tend to charge a premium compared with more-traditional strategies. For example, long-short equity funds had an average management fee of 1.21%, as of June 30, 2020, almost double the average 0.63% levy of actively managed U.S. large-cap equity funds.
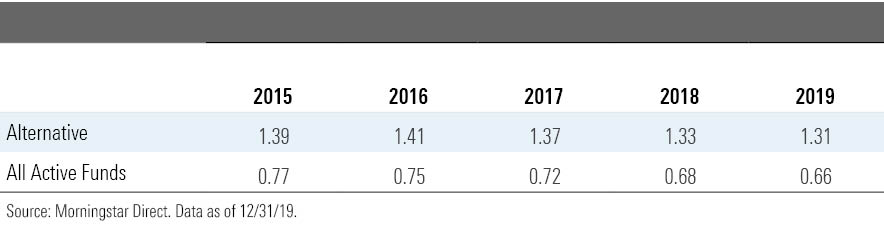
In 2019, investors paid an asset-weighted fee of 1.31% for alternative funds according to Morningstar’s 2020 U.S. Fee Study. That figure doesn’t include the additional costs of shorting securities, which are inherent to alternative strategies. Leaving that aside, the fees investors paid to alternatives were nearly double the 0.66% asset-weighted average cost of all active funds. Nor have the fees for alternatives fallen at the same pace as other active funds over the last five years. The exhibit below shows that the asset-weighted average fee for all active funds declined by 14% (to 0.66% from 0.77%) between 2015 and 2019, versus a drop of only 6% (to 1.31% from 1.39%) for liquid alts.
The next exhibit shows the cumulative fees paid by investors and the cumulative wealth created by liquid alternative funds from March 2009 through April 2020.[1]
- source: Morningstar Direct, author's calculations. Data as of 6/30/20.
There’s considerable irony in how investors have collectively paid $1 billion more for liquidity alternative strategies than what they’ve gained. Although investor interest in capital preservation played no small role in their creation and proliferation, market downturns have been their undoing. As the preceding exhibit shows, had it not been for the 2015-16 correction, the late 2018 drop, and the early 2020’s bear market, liquid alternatives would have been able to outpace their fees. In March 2020, for example, the wealth created by liquid alternative funds fell by $8 billion, or more than one third of the $22 billion they had created to that point. Our colleagues Erol Alitovski and Bobby Blue highlighted some of the pain points for liquid alternatives in the first-quarter bear market.
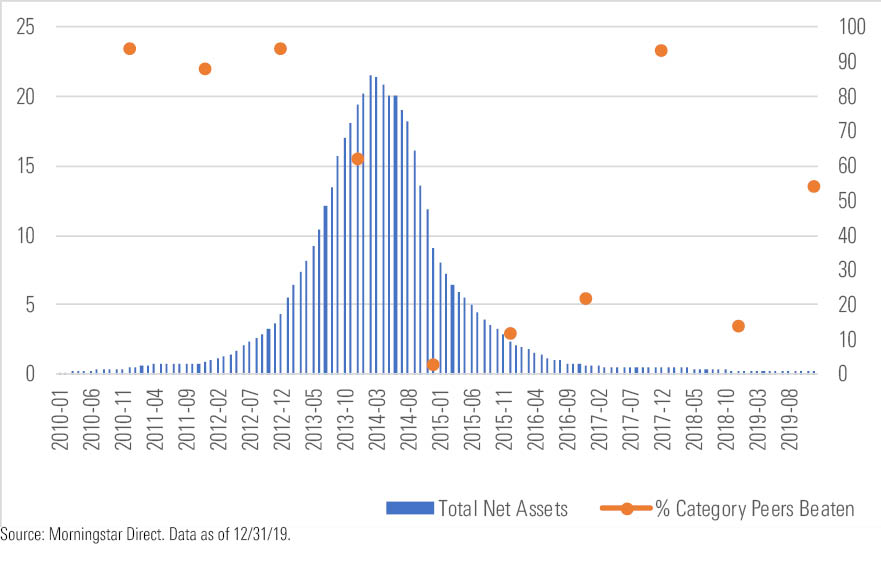
Performance Chasing Has Also Hurt Investors' Returns While liquid alternative funds' returns have been challenged, investors' poor timing has exacerbated the gap between the fees they've paid and their returns. Consider the stampede into Mainstay Marketfield, now just Marketfield MFLDX, in 2013. The fund then averaged more than $1 billion of inflows a month and grew from $4.3 billion in assets at the start of the year to $20 billion by year-end. Subsequent performance issues led to the money flowing right back out. Over the past decade, the fund's negative 2.4% investor return was well short of its 3.6% annualized time-weighted return over the same period. That's a whopping 6-percentage-point return gap.
The exhibit below shows Marketfield’s assets over time (bars, left axis) and the percentage of long-short equity Morningstar Category peers it outperformed each year (dots, right axis). It’s a classic case of performance chasing. After three top-quartile calendar-year finishes in a row, money flooded in and assets under management multiplied. Then money flooded out and AUM collapsed after three finishes in or near the peer group’s bottom quartile. Few investors thus benefited from the fund’s 2017 rebound, though they also spared themselves from another harrowing year in 2018.
Marketfield is far from the only liquid alternative fund investors have timed poorly and bailed on quickly. AQR’s liquid alternative funds have had a similar boom and bust profile. Unlike Mainstay, which handled distribution for Marketfield until 2016, AQR at least sent investors a sign to calm down by closing their funds to new investors early. Even so, our Mind the Gap 2019 study showed that the gulf between investor and fund returns for alternative strategies was wider than for any other asset class. Indeed, alternatives’ investors’ negative 1.44-percentage-point deficit was roughly triple the gaps in equity and fixed-income funds.
You Win Some, You Lose Most The past decade has been one of the best for a simple 60/40 portfolio of U.S. stocks and bonds. Any attempt to diversify beyond that, even with non-U.S. stocks or bonds, likely detracted from returns over the past 10 years.
One has to wonder, though, if the popularity of liquid alternative strategies has contributed to their undoing. Edward O. Thorp, who helped pioneer many of the quantitative approaches still used in liquid alternative strategies today, reports that his Princeton Newport Partners fund beat the S&P 500 by nearly 5 annualized percentage points after fees between November 1969 and year-end 1988. Thorp's trades have since become far more crowded, and their return potential has diminished--or disappeared entirely in some cases--which makes overcoming high fee hurdles even more difficult. Whether or not further study would bear that out, it's hard to look at the last decade of liquid alternative funds' returns and what investors paid to get them and not conclude that their benefits skew in favor of the offering firms.
[1] To estimate the fees investors have paid to liquid alternatives and the wealth created by liquid alternative funds, we used the monthly assets, gross returns, and net of fee returns of all share classes of alive and dead funds in the long-short credit, long-short equity, market neutral, multialternative, and options-based Morningstar Categories from March 2009 through April 2020. By using share class level assets and returns, we can more accurately estimate the fees paid and wealth created.
We measured the difference between the gross and net of fee returns for each share class and multiplied that by the share classes' assets at the beginning of the month to estimate how much investors paid each month. It should be noted that not all of the difference between gross and net of fee returns goes to the asset manager; a small portion may go to various intermediaries like financial advisors.
We multiplied the net of fee returns by the share classes’ starting assets each month to estimate the wealth created.
/cloudfront-us-east-1.images.arcpublishing.com/morningstar/OMVK3XQEVFDRHGPHSQPIBDENQE.jpg)
:quality(80)/s3.amazonaws.com/arc-authors/morningstar/af89071a-fa91-434d-a760-d1277f0432b6.jpg)
:quality(80)/s3.amazonaws.com/arc-authors/morningstar/fadee740-dfeb-494d-95b1-c462d0ac1f59.jpg)