
5-Star AES Plugs Into Renewable Energy Growth
The global power company's dividend is yielding above 4%.
/s3.amazonaws.com/arc-authors/morningstar/20ab29d0-a934-4b10-b861-770e63c08853.jpg)
/s3.amazonaws.com/arc-authors/morningstar/ea0fcfae-4dcd-4aff-b606-7b0799c93519.jpg)
AES AES trades at a wide discount to our $20 fair value estimate and has a dividend that yields 4.1%, creating a buying opportunity for growth and income investors, in our view. Public policy and corporate demand continue to support renewable energy growth. We expect U.S. renewable energy generation to grow 8% annually during the next decade. Also, AES’ Green Blend and Extend strategy gives us confidence that renewable energy growth in South America will accelerate after the economic impact of the coronavirus fades. Our confidence in the post-pandemic growth potential of the South American renewable energy market mirrors our U.S. renewable energy growth outlook.
AES reinstated its dividend in the fourth quarter of 2012 after not paying one for 20 years. In January 2015, the board doubled the dividend to an annual rate of $0.40 per share and increased it 8%-10% annually through 2018. The increase slowed to 5% in 2019 and was also 5% in 2020’s first quarter.
AES’ current dividend is $0.57 per share on an annualized basis, yielding roughly 100 basis points higher than the industry average and representing a payout ratio of approximately 42% on our 2020 adjusted earnings per share estimate of $1.37. This is more conservative than a typical U.S. regulated utility’s payout but appropriate, given AES’ financial structure, which relies on businesses financed with nonrecourse debt and minority partners. Because of this structure, a significant amount of cash is required to remain at the subsidiary level due to loan covenants.
Management has indicated that its dividend policy will be flexible and tied to parent free cash flow. We estimate the dividend payout to parent free cash flow will be approximately 51% in 2020. We estimate parent cash flow increasing at 7% annually over the next five years, giving us confidence that the dividend is secure and can grow at 5% per year for the foreseeable future.
Renewable Energy Tailwind Drives Earnings Growth as Well We forecast adjusted EPS growing 7% annually over the next five years, the lower end of AES' 7%-9% guidance range through 2022. Although our 2020 EPS estimate is roughly flat with 2019, we expect 8% average annual earnings growth from 2020 to 2024. This results in 7% average annual EPS growth off AES' adjusted 2018 base, the basis for its 7%-9% guidance.
The strong earnings recovery after the economic impact of COVID-19 is driven in large part by our bullish view of U.S. renewable energy growth combined with solid renewable growth in South America. In the United States, we think renewable energy will grow faster than consensus forecasts, climbing 8% annually during the next decade and reaching 22% of total electricity generation by 2030 versus 10% last year. AES’ renewable energy business, supported by its battery storage joint venture with Siemens, is well positioned to take advantage of this macroeconomic tailwind, sustaining this EPS growth rate through the next decade.
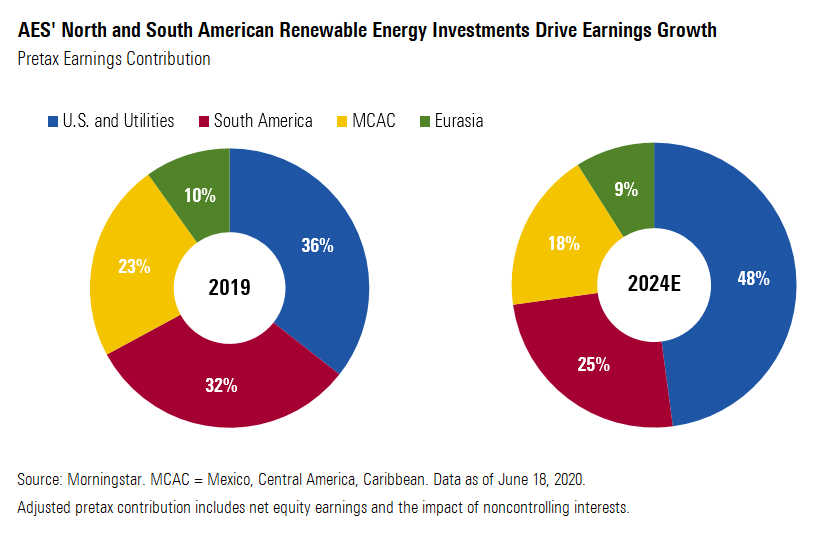
We believe pretax contribution is a better measure of a subsidiary’s earnings power than its annual distribution to the parent company. Subsidiary distributions can vary due to retention of cash at the subsidiary to fund capital expenditures, cash retention related to nonrecourse debt covenant restrictions, working capital needs, and other timing issues.
However, a look at the history of distributions from subsidiaries shows the importance of the U.S. and South American strategic business units. Last year, subsidiaries of the U.S. and South American SBUs contributed four of the five largest distributions to the parent and over 50% of the total.
By 2024, we expect the U.S. and South American SBUs to generate 73% of pretax contribution to the parent and roughly 75% of subsidiary cash distributions. AES’ change in strategy over the past 10 years provides more-stable cash flow from narrow-moat U.S. utilities with favorable regulatory frameworks and wind and solar energy with long-term power sales agreements. The strategy change has allowed the company to reinstate and regularly increase its dividend.
Green Blend and Extend Strategy a Success In May 2018, 67%-owned AES Gener launched its Green Blend and Extend strategy. The strategy was based on negotiating extensions to existing power purchase agreements with customers, many of them multinational corporations, that had contracted with AES Gener's coal-fired power plants in Chile and hydroelectric facilities in Colombia. The contract extensions would give AES Gener the revenue certainty to invest in new wind farms and solar plants and improve the sustainability profile of the multinational company counterparties.
The strategy has been a success. AES Gener has signed approximately 1.7 gigawatts of new solar and wind power purchase agreements since 2018 with contract durations of 10-21 years. Most of these were Green Blend and Extend agreements with Google and international mining and chemical companies, including Teck, Mantos Copper, Candelaria, Gensa, Ecopetrol, Pucobre, and Quimpac. In May, AES Gener provided a COVID-19 update and indicated 96% of current revenue was from investment-grade counterparties, 89% under long-term contracts, and 79% under dollar-denominated contracts, giving us confidence in the reliability of the future earnings and cash flows from the recently signed power purchase agreements.
On April 17, AES Gener shareholders approved a $500 million capital increase to provide the equity for the $1.8 billion investment for the solar and wind projects. AES will provide $335 million, 67% of the capital increase, to maintain its level of ownership in AES Gener.
In 2017, about 23% of AES Gener’s 5.8 GW of capacity was renewables, mostly hydroelectric. By 2024, due in large part to Green Blend and Extend and the completion of the 531-megawatt Alto Maipo hydroelectric facility, generating capacity is expected to have expanded to 6.9 GW, with over 50% from renewable generation.
Before COVID-19 spread worldwide, AES Gener was on pace to sign more than double the power purchase agreements it signed in 2019. Although we expect the economic impact of COVID-19 to slow the near-term signing of new power purchase agreements, AES Gener added 522 MW of new agreements in Chile in the first quarter of 2020.
AES expects generation from coal to be less than 30% by 2020 year-end and decline to less than 10% by 2030 for its entire international generating fleet. AES has not announced specific retirement dates for its Chilean coal plants, but with the success of the Green Blend and Extend and the expected completion of the Alto Maipo hydro project in Chile, we expect AES to retire most if not all of its South American coal units by 2030. On June 23, AES announced it had reached an agreement to sell its 49% interest in the 1.7 GW OPGC power plant in India, the largest coal-fired power plant in its portfolio. OPGC Unit 2 was completed in 2019 and we expect it to be the last new coal plant developed by AES.
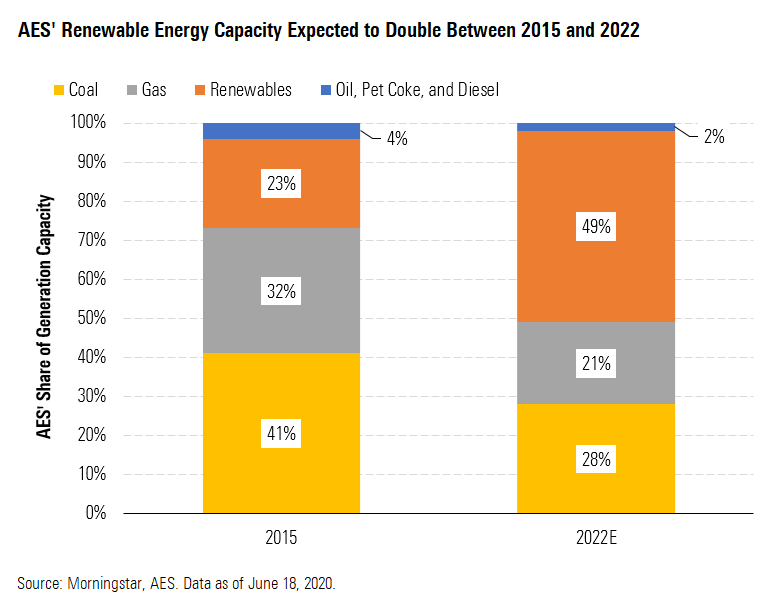
Fertile Ground for Renewable Energy Investment AES is dramatically transforming its generation fleet. We expect the share of renewable energy generation capacity in its fleet to more than double between 2015 and 2022. AES has a total backlog of 5.3 GW of renewable projects under construction or with signed power purchase agreements as of March 31. All of the projects in that backlog are wind, solar, or energy storage except the Alto Maipo hydro project.
Renewable energy is shifting the power generation and investment markets worldwide, including in the U.S. We continue to expect renewable energy to grow 8% annually on average during the next decade, reaching 22% of U.S. electricity generation by 2030, excluding hydropower. This is up from 11% in 2019. AES expects 50% of its new generation projects to be wind and solar projects in the U.S. Our macro view of renewable energy growth in the U.S. supports AES’ strategic shift.
We expect state renewable energy policies to be the primary growth driver. At a minimum, we estimate that renewable energy will more than double by 2030 just to meet current policy targets in 38 states and Washington, D.C. (we estimate that 32 states have not met their renewable portfolio standards). Additional growth will come from corporate purchases and economic development in states without policy goals, notably Texas and Florida. Our forecast was relatively bullish when we developed it in mid-2019, but there are signs that consensus is coming around to our thinking after the U.S. Energy Information Administration raised its 2030 renewable energy forecast by 34% in January. The EIA’s new 2030 estimate is in line with our 8% annualized growth outlook through 2030.
New York (70% by 2030) and California (60% by 2030) represent one third of our renewable portfolio standard-based renewable energy growth estimate during the next decade. Michigan, New Jersey, Illinois, and Pennsylvania also will require big investments based on current state policies. And renewable energy growth is poised to continue well beyond 2030. Eight states--including New York (2040), California (2045), and Hawaii (2045)--and Washington, D.C. (2032) are chasing 100% renewable, carbon-free, or net-carbon-neutral energy goals.
The U.S. is well on track to meeting our forecast despite expectations for a slowdown in renewable energy growth in 2020 and 2021 due to lingering COVID-19 issues such as supply chain disruptions, labor constraints, construction delays, and shrinking financing capacity. We expect capacity that might have come on line in 2020 or 2021 now will come on line in 2022 and beyond, keeping the U.S. on track to meet our 2030 estimated annualized growth rate.
In the U.S., the Solar Energy Industries Association and Wood Mackenzie recently cut their 2020 solar growth estimate to 18 GW, down 9% from their pre-COVID estimate. The EIA’s tally of planned and under-construction projects continues to show solar additions jumping ahead of wind starting next year.
The IEA also cut its most recent worldwide 2020-21 renewable energy growth forecast by 10% from its October 2019 forecast. It now expects 167 GW of renewable energy growth worldwide, or 6%, in 2020 with new solar capacity down 18% from 2019 and new wind capacity down 12% from 2019, based on its Renewable Energy Market Update published in May.
Solar and Batteries: Charging Ahead In early June, Hawaiian Electric announced that AES was one of the winners of its procurement of energy storage and renewables. AES won two bids in Oahu using solar-plus-storage systems incorporating utility-scale battery technology from its Fluence joint venture with Siemens. One project is a 19.5 MW solar facility paired with a 35 megawatt-hour battery storage system. The other winning project was a 60 MW solar farm paired with a 240 MWh system. These two new projects are in addition to the 1.3 GW under construction in 21 countries by the Fluence joint venture that AES management detailed in May.
Many developers are bending toward solar as the preferred renewable energy technology after a decade of favoring wind energy. In addition, all developers are assessing the economics of combining solar and energy storage, typically large batteries that can charge from the solar panels during the day and dispatch power during peak periods in the late afternoon.
In the U.S., California had a long policy-driven head start in the solar and battery market. North Carolina’s policymaking and support for corporate-sponsored development to attract business investment make it the only state outside the Southwest with a sizable mix of solar energy. Leading wind energy states like Illinois and Texas have attracted early battery development.
Solar’s rise is due to quickly falling costs, state incentives, and favorable areas for development closer to load centers than wind projects. Forecasters have consistently underestimated solar growth potential. The EIA has underestimated U.S. solar growth every year since 2015. In 2013, the EIA estimated U.S. solar capacity would be 5.3 GW in 2019, some 30 GW short of actual operating solar capacity last year. Even as recently as its 2017, the EIA’s 2019 forecast ended up 30% lower than last year’s actual operating solar capacity.
COVID-19 Slows Solar Down This could be the first year that utility-scale solar capacity does not substantially exceed the EIA's previous forecasts, in part due to the unanticipated effects of the COVID-19 pandemic. In 2018, the EIA forecast 45 GW of solar capacity at the end of 2020. Through March, operating solar photovoltaic capacity was 37.4 GW, but it could be tough for the industry to add 8 GW by year-end, given COVID-19-caused construction and financing delays.
We estimate there is about 10 GW worth of new projects scheduled to come on line by the end of the year, but some of these might push into 2021 with COVID-19 construction slowdowns. U.S. solar developers have received 13.4 GW of panel shipments during the last nine months--about the time it takes to complete a project after receiving panels--according to EIA data through May. We expect some of those panels are in projects that recently went on line, but many likely are sitting at project construction sites waiting to be installed. A slowdown in shipments during the last month likely is due to COVID-19 impacts at panel factories worldwide, although the monthly shipment rate remains well above pre-2019 rates.
A more challenging project finance market also might delay current projects, but we don’t expect a long-term impact on solar growth. A slowing economy has reduced the market’s eagerness to provide tax equity financing as companies try to shrink their balance sheets and have less taxable income to offset with tax credits. In May, the U.S. government eased renewable energy developers’ urgency to complete projects this year by extending tax credit eligibility by one year.
Solar Costs Are Falling Falling costs are vaulting solar to the top of the technology leaderboard. Solar costs now nearly match all-in costs for wind and natural gas. Utility-scale solar photovoltaic project costs have come down 82% since 2010, according to the International Renewable Energy Agency.
These falling costs are showing up in falling contract prices for solar projects. This has attracted corporates that want to improve their environmental profile but don’t want higher energy costs. More than 200 companies worldwide have committed to using 100% clean energy, according to reports. It also pleases regulators, policymakers, and utilities that can increase the share of renewable energy in the overall energy mix without burdening individuals and businesses with higher utility bills.
In the U.S., average utility-scale solar power contract prices fell 4.7% in 2019 to $27.40/MWh, according to LevelTen Energy, a company that helps match renewable energy buyers and sellers. Lower component and project construction costs aren’t the only factors driving down prices. Low interest rates, competition among developers, and competition among utilities and corporates to lock in long-term contracts have been helping push down contract prices.
Worldwide, average long-term contract prices for new solar photovoltaic projects could hit $39 per MWh in 2021, down 42% from average prices in 2019, according to IRENA. Contracts for new projects in the Middle East and South America are pricing near $30/MWh, but some are well below that. In April, Abu Dhabi Power announced the lowest-ever competitive solar photovoltaic tariff at $13.50/MWh for the 2 GW Al Dhafra project. Energy companies Total and Marubeni are developing an 800 MW project in Qatar, due on line in 2022 and backed by a 25-year agreement at $16.00/MWh.
Falling solar costs are helping battery growth as well. Utility-scale batteries remain prohibitively expensive on a stand-alone basis, with costs near $400 per kilowatt-hour for a four-hour battery. But pairing batteries with solar improves the economics for both by reducing charging costs and boosting solar capacity factors. Even with lithium-ion battery costs falling to as low as $124/kWh in 2018 dollars by 2030 based on a compilation of 25 forecasts by the U.S. National Renewable Energy Laboratory, we expect costs to remain higher than other generation sources, necessitating solar pairing to support investment.
We estimate that any state that aims for more than 50% renewable energy by 2030 will need a sizable share of battery storage to stabilize the grid. This could mean 70 GW or more of battery storage during the next decade. For more on our outlook for lithium-ion batteries and lithium demand, see our Stock Strategist Industry Report published in April.
Hot Spots for Renewable Growth Texas, long the leading wind energy state, is chasing California in solar and energy storage. The Texas electricity grid operator, ERCOT, expects solar to represent about 45% of new additions during the next three years, similar to planned wind additions. ERCOT estimates wind and solar will represent 42% of system capacity by mid-2023 based only on projects that are ready for construction.
Solar’s role is even more notable when adjusting for reliability planning. ERCOT is counting on new solar to represent 65% of new adjusted capacity by mid-2022, given its higher predictability during peak demand periods. New wind projects represent just 22% of new reliability-adjusted capacity the next three years.
Texas also is poised to be a leader in battery storage without any policymaking assistance. The state’s lead in new solar projects--many of which will come with batteries--and need for reliable power on extreme weather days have attracted investment. Battery system developers also favor Texas because its intrastate network allows developers to avoid lengthy delays from ongoing policy debates about how to regulate batteries on interstate electricity networks.
Texas had 124 MW of utility-scale battery storage on its grid at the end of 2019, hardly noticeable among its nearly 100,000 MW of total gross generation capacity but ranking it third among all states. That is set to change quickly, however. ERCOT expects battery capacity to grow to 912 MW by mid-2022 based on current permitted projects and says it is reviewing project proposals totaling up to 7,200 MW of utility-scale battery storage. Battery development interest is so strong that ERCOT has created a battery storage task force.
Texas project sizes are climbing quickly. NRG and Toshiba built a 2 MW battery paired with a wind farm in 2017. Vistra Energy opened a 10 MW battery facility, the largest in the state, in December 2018 along with its 180 MW solar farm. Now Broad Reach Power, a Houston-based private equity-backed developer, is proposing as many as 15 10 MW battery projects with some on line as early as this summer. Broad Reach owns 3,000 MW of solar-plus-battery projects in five states.
California and New York will need a big solar and energy storage push to meet their clean energy ambitions. California has built its lead in solar and storage through more than a decade of policymaking aimed at 80% greenhouse gas reductions from 1990 levels by 2050. New York is just getting started on its clean energy pursuits but plans to top California with 85% greenhouse gas cuts by 2050.
As early as 2006, California set a renewable portfolio standard targeting 20% renewable energy by 2010 and 33% by 2020. In 2015, the state raised the RPS to 50% by 2030 and passed several laws that aim to reduce greenhouse gas emissions by 80% from 1990 levels by 2050. Part of this effort is achieving 100% renewable energy and using much of that clean energy to electrify transportation, homes, and buildings, which produce the bulk of the state’s greenhouse gas emissions.
California’s measured approach won’t work for New York, which needs clean energy development at breakneck speed. New York doesn’t crack the top 15 states in solar generation and doesn’t have any material energy storage. Yet New York Gov. Andrew Cuomo signed the Climate Leadership and Community Protection Act in July 2019, codifying targets that are the most aggressive in the U.S.
California’s utilities are at the center of this decarbonization effort. Southern California Edison, a subsidiary of Edison International, has procured more than 690 MW of energy storage and is aiming for another 580 MW this year, pending regulatory approval. Transportation electrification offers another $1 billion of investment potential. In total, we estimate Edison International will spend the bulk of its four-year, $20 billion capital investment program on supporting the state’s clean energy goals. Similarly, we expect Northern California utility PG&E to spend the bulk of its four-year, $30 billion investment plan supporting the state’s clean energy goals.
New York policymakers are required to deliver a final plan by the end of 2023 that would outline the role and investment potential for the state’s utilities, notably Consolidated Edison. We think New York’s goals are too aggressive and we expect lawmakers will moderate them once they see the technical and financial hurdles. Still, New York offers substantial clean energy investment potential for utilities and renewable energy developers even if the state falls short of its targets.
Florida also is going to challenge as a solar energy leader during the next decade. NextEra Energy’s Florida Power & Light is pursuing plans to add 8 GW of solar capacity in the state between 2019 and 2030. It also has proposed the world’s largest battery storage facility, the Manatee Energy Storage Center, paired with a large solar farm. Duke Energy plans 700 MW of solar additions in 2018-22 in Florida, and Emera’s Tampa Electric plans to add 600 MW by 2021.
Chile, in particular, has pledged 100% renewable energy by 2040, a huge shift in a country that produced 40% of its electricity from coal as recently as 2016. In January 2018, the Chilean government said it would build no new coal plants. In June 2019, the government announced it will retire 8 of the country’s 28 coal plants during the next five years, representing 23 GW of capacity. Chile’s electricity grid operator has said the country will need 5 GW of new solar, wind, hydro, and batteries by 2040 to replace all coal plants.
Like many states in the U.S., natural gas generation will continue to grow as the primary generation fuel in South America to get countries from high shares of coal generation to high shares of renewable energy in their energy mixes.
/cloudfront-us-east-1.images.arcpublishing.com/morningstar/TP6GAISC4JE65KVOI3YEE34HGU.jpg)
/cloudfront-us-east-1.images.arcpublishing.com/morningstar/RFJBWBYYTARXBNOTU6VL4VSE4Q.png)
/cloudfront-us-east-1.images.arcpublishing.com/morningstar/YQGRDUDPP5HGHPGKP7VCZ7EQ4E.jpg)
:quality(80)/s3.amazonaws.com/arc-authors/morningstar/20ab29d0-a934-4b10-b861-770e63c08853.jpg)
:quality(80)/s3.amazonaws.com/arc-authors/morningstar/ea0fcfae-4dcd-4aff-b606-7b0799c93519.jpg)