
4 Lessons From Another Year of Falling Fund Fees
Asset-weighted fees dropped to 0.45% in 2019, according to Morningstar’s latest fund fee study.
/s3.amazonaws.com/arc-authors/morningstar/a90ba90e-1da2-48a4-98bf-a476620dbff0.jpg)
The average expense ratio paid by fund investors has been falling for two decades. In 2019, the asset-weighted average expense ratio across all mutual funds and exchange-traded funds [1] was 0.45%. This is roughly half what investors paid in fund fees as of the turn of the millennium.
Fund investors themselves deserve much of the credit for this movement, as the shift toward low-cost funds has been the primary driver of this decline.
However, the lowering of fund costs doesn’t necessarily mean that the total costs borne by investors have followed in lockstep. While some costs have diminished, others have taken new shape. For example, the cost of advice has increasingly been stripped out of funds’ fees and resurfaced in the form of advice fees. Investors should be ever vigilant of what Vanguard founder John Bogle referred to as “the tyranny of compounding costs” and be informed about what they’re paying both for their investments and for advice.
Here's a closer look at some of the key takeaways from Morningstar's annual fund fee study. Morningstar Direct and Office clients can access the full report here.
A Small Decline in Fund Fees Adds Up to Billions Saved Asset-weighted fund fees fell to 0.45% in 2019 from 0.48% in 2018. While this might seem like an insignificant decline, it amounted to $5.8 billion in savings for fund investors across the United States.
And a few billion saved means more than a few billion earned in the years to come. Compounding investors’ 2019 fund fee savings at a rate of 4.93% [2] over the next 10 years would equate to $9.4 billion more in investors’ pockets come 2030.
These savings have disproportionately accrued to investors in passive funds. Since 1990, the asset-weighted fee across all passive funds has declined 57%, landing at 0.13% as of 2019. Meanwhile, the asset-weighted fee paid by investors in active funds has fallen 22%, standing at 0.66% in 2019. The chart below may be one of the few line graphs where investors will be pleased to see a slow and steady downward trend depicted.
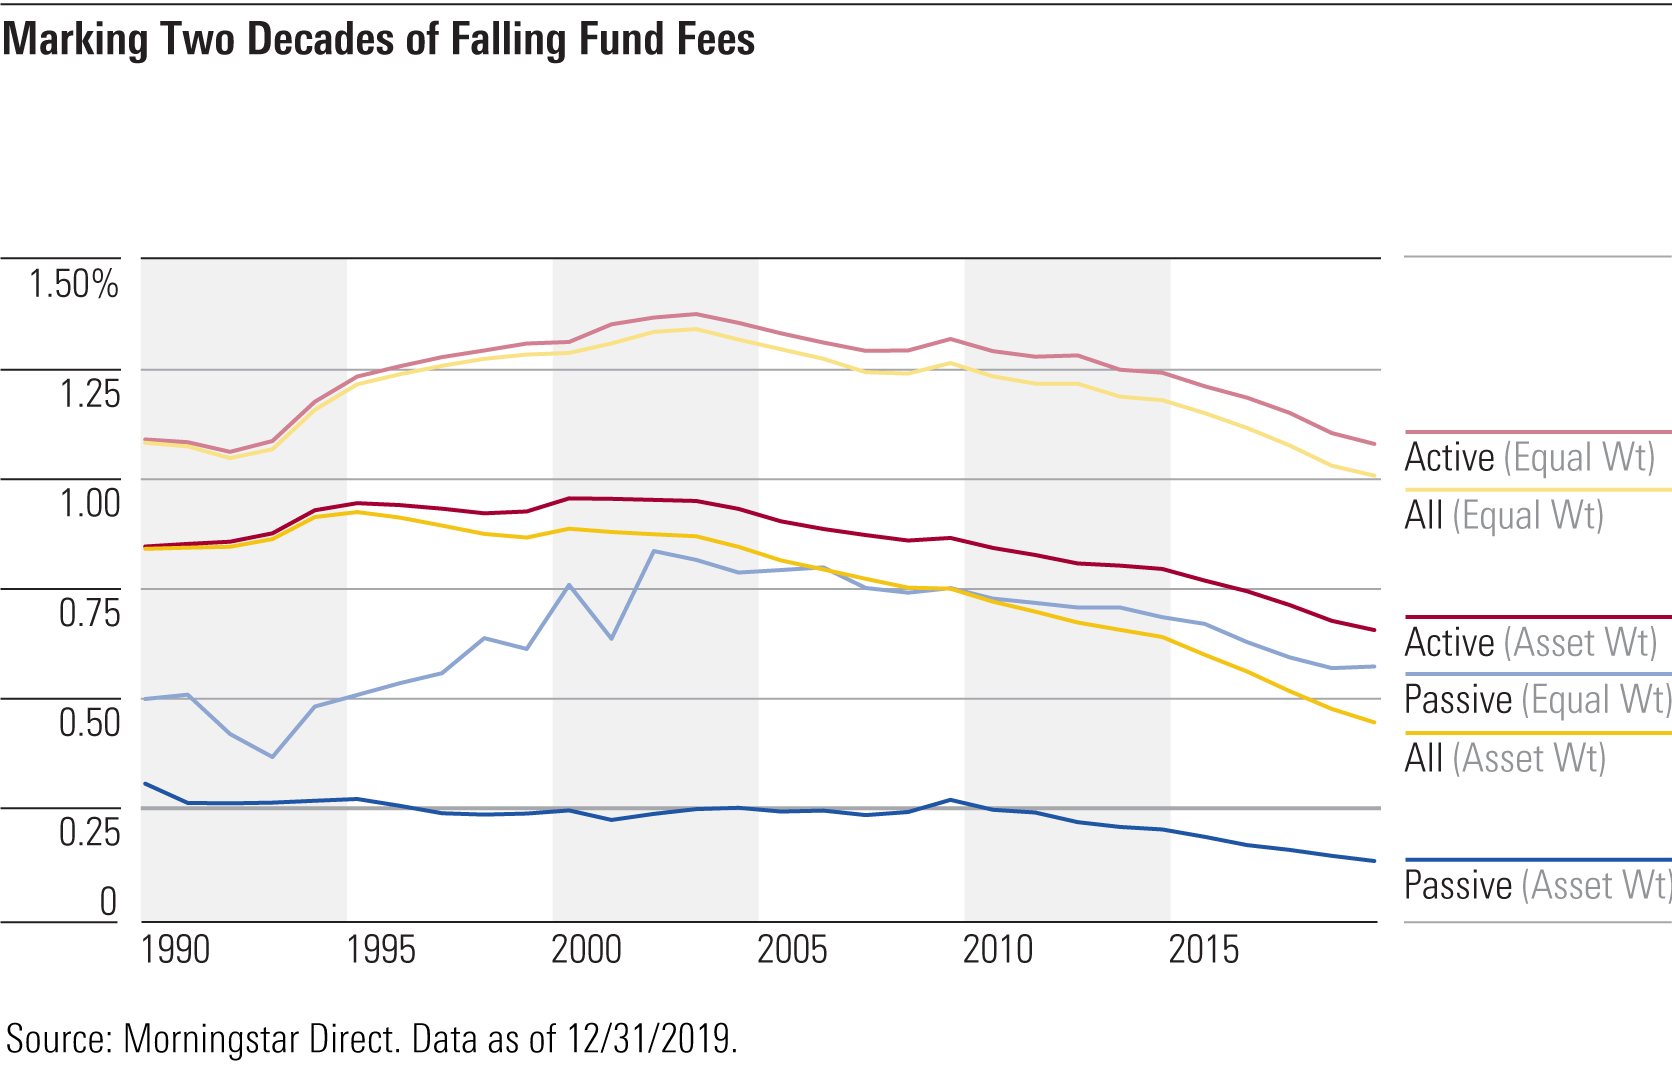
- source: Morningstar Analysts
Asset-Weighted Fees Are Feeling the Biggest Squeeze Investors deserve most of the credit for putting the squeeze on fees. Asset-weighted fees represent the average amount investors are paying for the funds they invest in, while equal-weighted fees measure the toll taken by the average fund. Thus, the fact that asset-weighted fees have dropped more sharply than equal-weighted fees indicates that investors, on average, choose funds with below-average fees.
The chart below shows aggregate flows into all funds based on how their fees stack up versus their Morningstar Category peers. For six years running, the cheapest 20% of funds across all Morningstar Categories have, as a group, experienced positive net flows. Meanwhile, money has poured out of the remaining 80%. The sums are staggering: Nearly $3.6 trillion has flowed into the low-cost cohort during this six-year span, while $1.6 trillion has been pulled from the remaining funds.
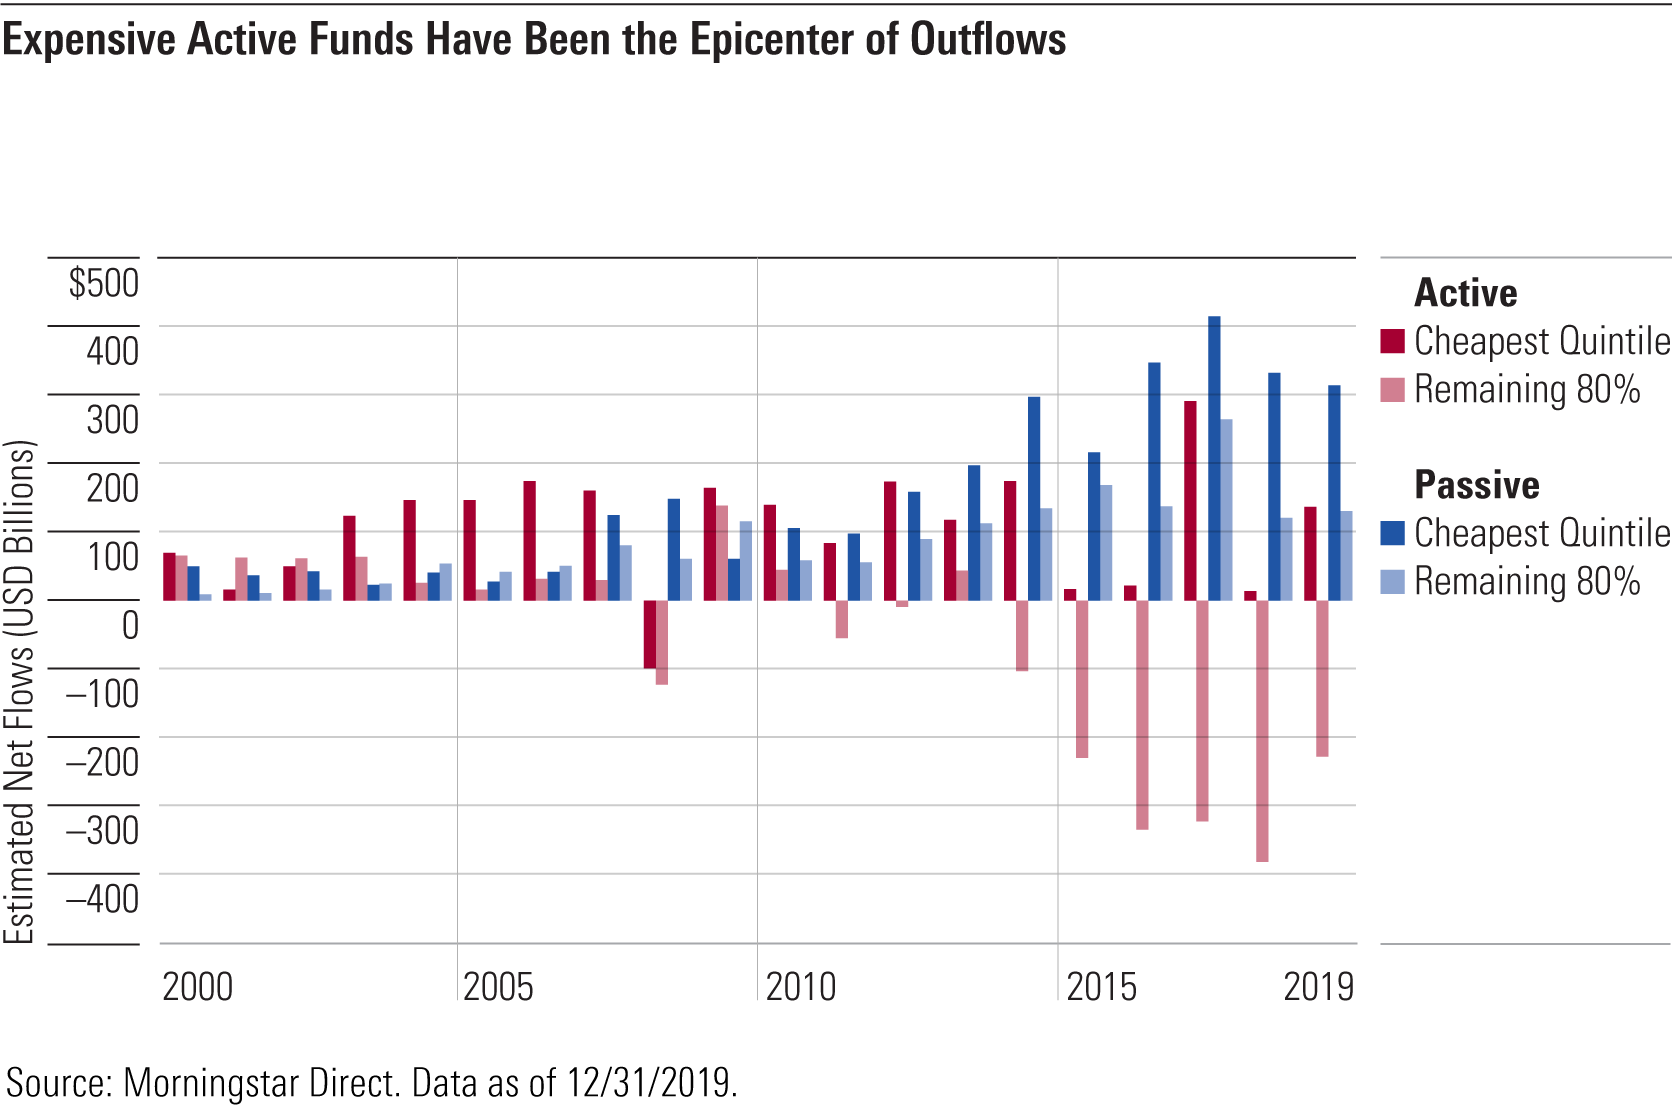
- source: Morningstar Analysts
The lion’s share of flows into these low-cost funds has gone to index mutual funds and exchange-traded funds. These funds’ growth has been driven by a variety of factors, most notably shifting investor preferences, the evolving economics of the financial advice industry, and the ascendance of target-date funds as the default investment option in retirement plans.
Investors’ tastes can be fickle, but the trend toward indexing in general and ETFs in particular appears to be durable.
Three factors help explain the sea change we have witnessed from active funds to passive ones, costly ones to expensive ratios:
- Investors of all stripes are partaking in the movement toward low-cost, tax-efficient index funds, as they've become increasingly disillusioned with active managers and fed up with high fees and regular capital gains distributions.
- In the advice space, the shift away from transaction-driven business models and toward fee-based ones has led advisors to recommend lower-cost funds to their clients. This is, in part, to make more room for their own fees, which are often charged as a percentage of client assets under management.
- And in the retirement space, target-date funds have experienced significant growth as they are now the default investment option in many retirement plans. The majority of target-date fund assets are now in target-date series composed exclusively of index mutual funds.
Trends in Active versus Passive Fund Fees The chart below shows the trend in equal-weighted fees for active and passive funds across Morningstar Broad Category Groups. As you can see, from 2015 through 2019, the average expense ratio for passive funds dropped 15% and the average fee for active funds dropped 10%.
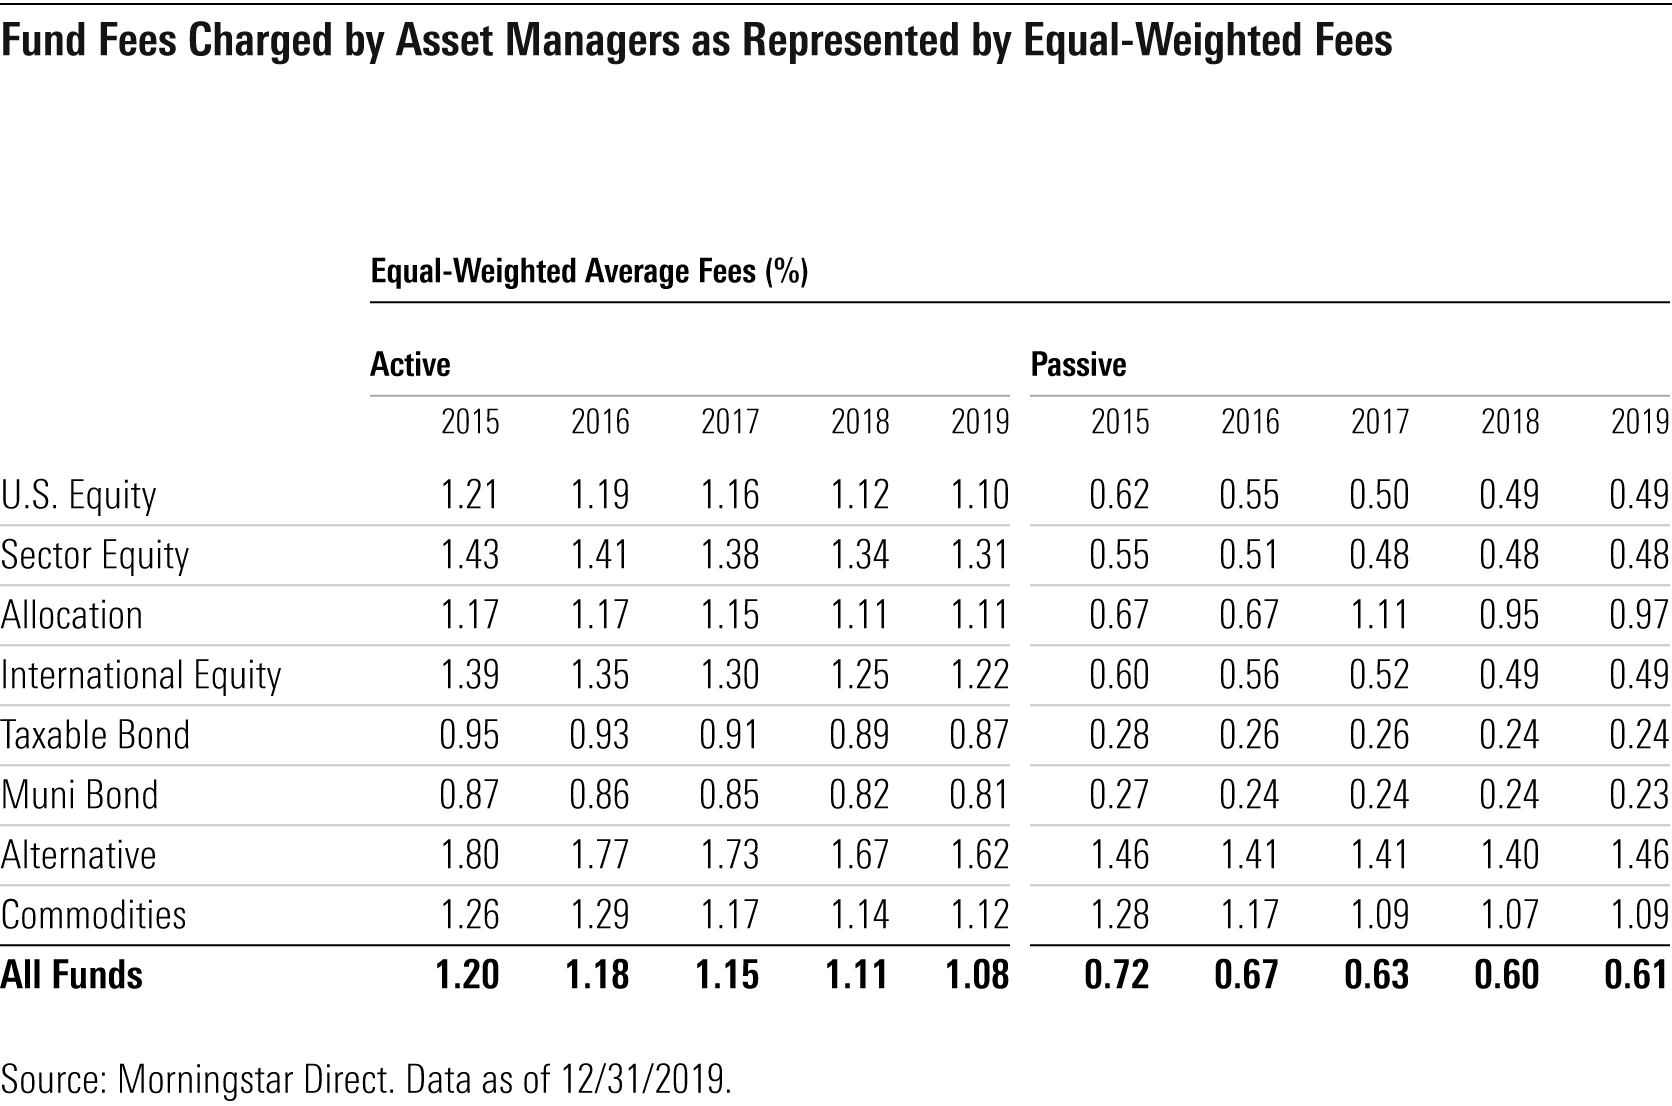
- source: Morningstar Analysts
Overall, fund companies are charging investors less than they were five years ago. This is partly because they are dropping certain line items from investors’ bills. As advice (for example, loads) and marketing and distribution costs (for example, 12b-1 fees) get scrapped to reflect the evolution of advisory practices, fund fees are getting stripped down to manufacturing costs (that is, management fees). This effect has been most pronounced among active funds, where these expenses are--or at least historically were--most prevalent.
How Low Can Fund Fees Go? We expect that the bar will go even lower, as the downward pressure on fund expenses is unlikely to abate. Competition has driven fees to zero in the case of a handful of index mutual funds and ETFs. The same forces that spawned these zero-fee funds have begun to spread to other corners of the fund market, where there is still ample room for fees to fall further.
However, we may see a brief reversal of the trend as we did in 2009, when sharp outflows sent funds through asset fee breakpoint levels for management fees. This caused expense ratios to rise before flows and appreciation took fund assets back above those breakpoint levels.
[1] This analysis excludes money market funds and funds of funds.
[2] The 10-year expected return for a 60/40 stock/bond portfolio based on Morningstar Investment Management LLC’s forecasts of corporate and economic fundamentals as of March 31, 2020.
/cloudfront-us-east-1.images.arcpublishing.com/morningstar/OMVK3XQEVFDRHGPHSQPIBDENQE.jpg)
:quality(80)/s3.amazonaws.com/arc-authors/morningstar/a90ba90e-1da2-48a4-98bf-a476620dbff0.jpg)