Looking Back at April Through an ETF Lens
Global markets picked themselves up off the mat last month.
Global financial markets picked themselves off the canvas and came back swinging in April. Here, I will look at how major asset classes performed, where investors were putting their money, and whether there may still be bargains--all through the lens of exchange-traded funds.
Don't Call It a Comeback Most major asset classes bounced back in April. Of the 2,130 nonleveraged exchange-traded products in Morningstar's U.S. database, just 160 (7.5%) posted losses for the month. Prominent among them were funds investing in municipal bonds and ETPs that invest in oil futures. Municipal bond markets saw continued price pressure in April; the outlook for state and local government budgets continues to deteriorate as tax revenues shrivel. Oil-based ETPs experienced sharp price declines as lousy market fundamentals kept pressure on prices and the front-month futures contract tipped into negative territory for the first time in history.
Exhibit 1 features April market price performance figures for a sampling of Morningstar Medalist ETFs representing most major asset classes. Investors in a blended global market portfolio gained just over 7% in April. Stock markets were up across the board, though some fared better than others. U.S. stocks outperformed both developed international and emerging-markets stocks.
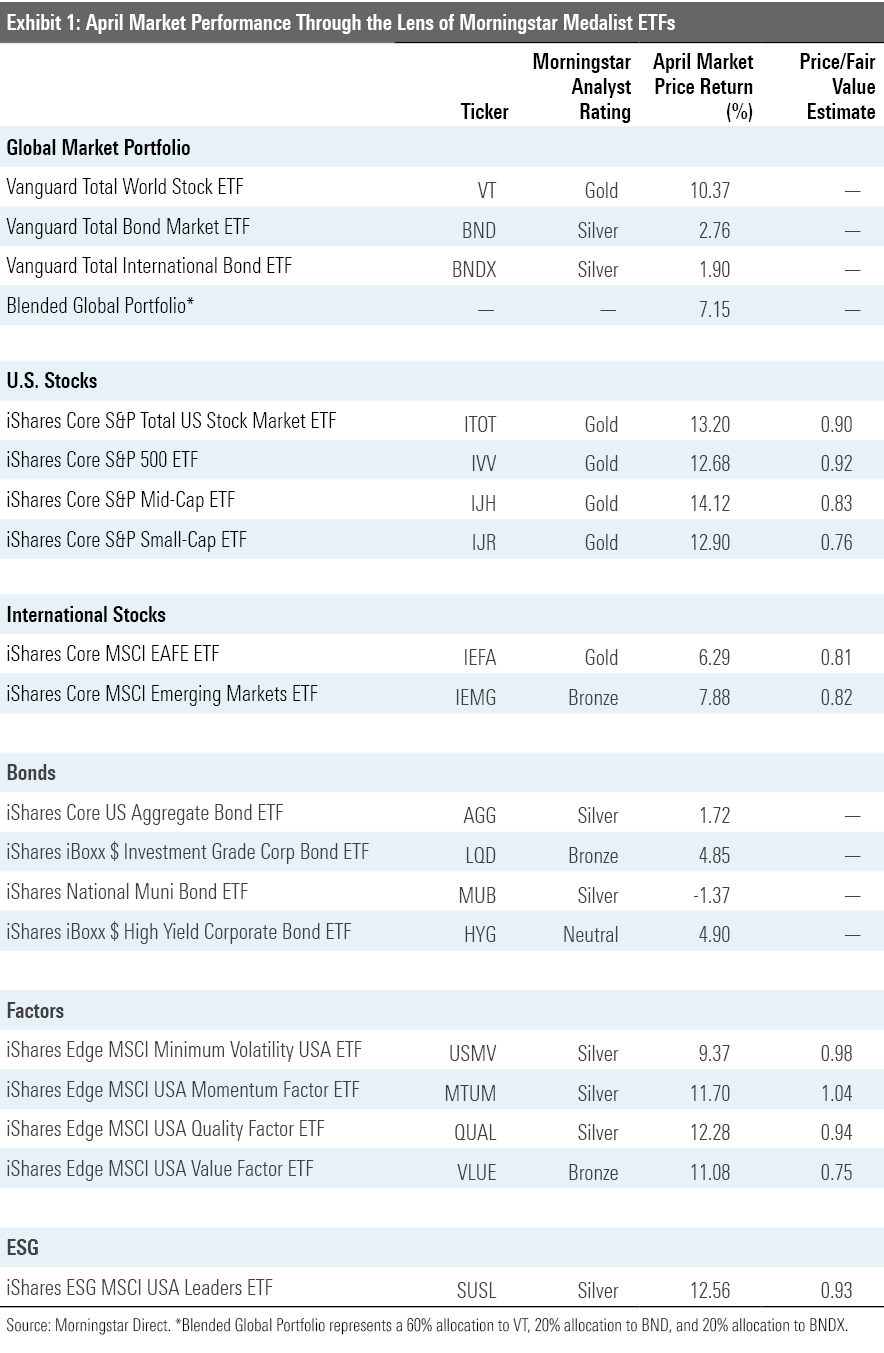
Within the U.S. market, mid-caps outperformed both large and small caps. IShares Core S&P Mid-Cap ETF IJH, which has a Morningstar Analyst Rating of Gold, outpaced Gold-rated iShares Core S&P 500 ETF IVV, chiefly because of its exposure to better-performing names in the consumer discretionary and healthcare sectors. IJH also outstripped Gold-rated iShares Core S&P Small Cap ETF IJR in April. In this case, much of its relative performance can be attributed to stock selection within the healthcare and financials sectors. The performance spread across the diagonal of the Morningstar Style Box narrowed in April. For example, iShares S&P 500 Growth ETF IVW, which falls in the large-growth Morningstar Category, outperformed iShares S&P Small-Cap 600 Value ETF IJS, which sits in small-value, by just 36 basis points. In March, IJS lagged IVW by nearly 15.5 percentage points. IJS’ greater exposure to economically sensitive names in the financials, consumer discretionary, real estate, and energy sectors contributed to its poor showing in March. In April, many of these same exposures--most notably in energy stocks--gave the small-value fund a lift.
Apart from municipal bonds, fixed-income markets recovered in April. Credit markets snapped back following the Federal Reserve’s late-March intervention--even though the Fed won’t begin purchasing corporate bonds and corporate-bond ETFs until later this month. The mere act of the Fed brandishing its bazooka was enough to bring some semblance of order back to the market.
Strategic-beta ETFs representing a variety of individual factors all lagged the broader stock market in April. Despite the fact they put up positive returns, value-oriented funds continue to struggle on a relative basis. Meanwhile, momentum stocks continue to be resilient. At the end of April, iShares Edge MSCI USA Value Factor ETF VLUE was trading at a 25% discount to its Morningstar fair value estimate, while iShares Edge MSCI USA Momentum Factor ETF MTUM was priced a bit rich.
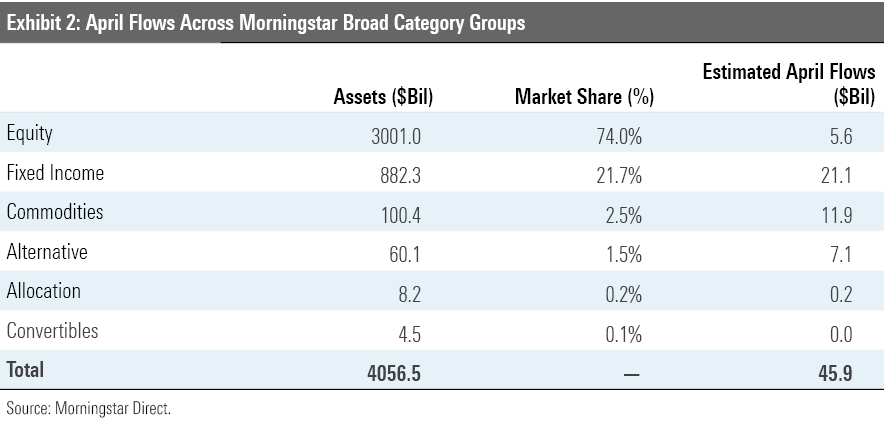
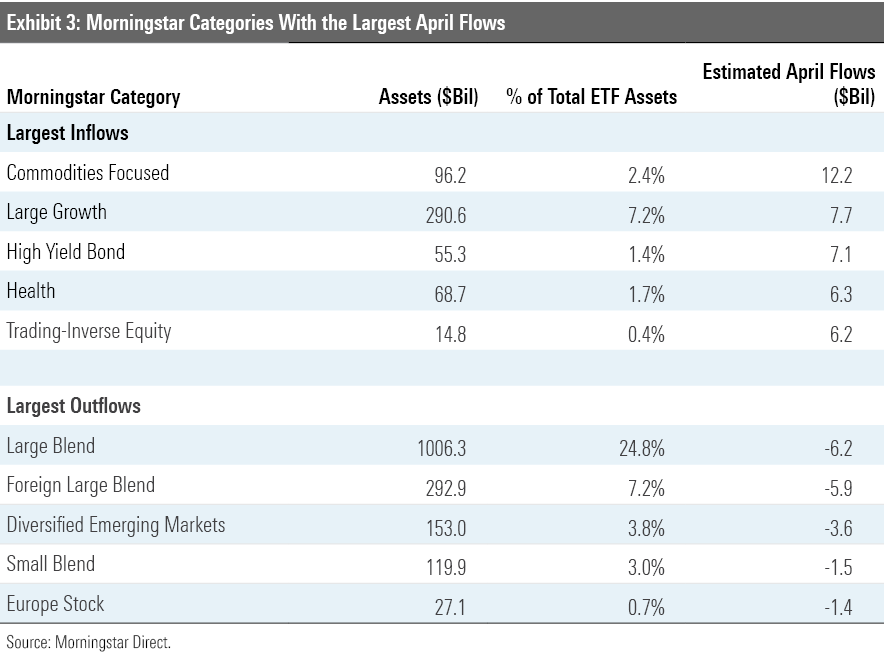
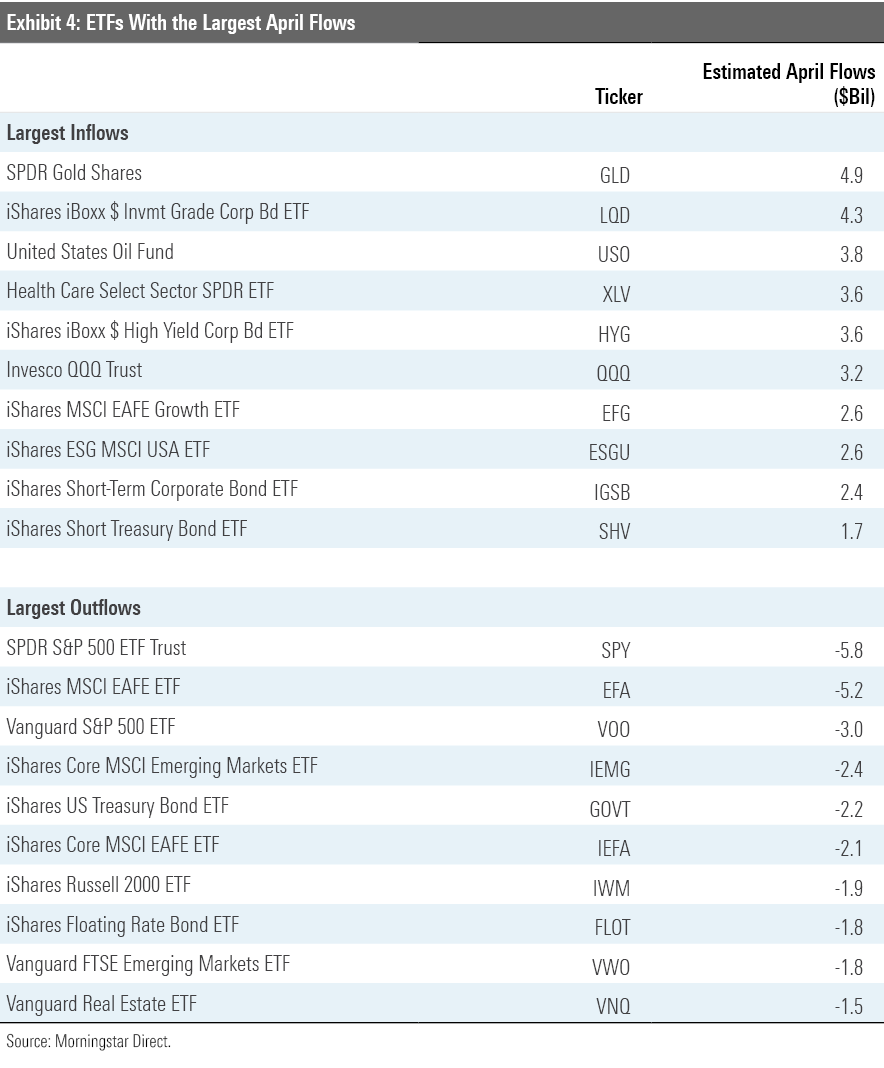
Back Into Bonds and Learning About Commodities Futures the Hard Way ETF flows favored bond funds in April. Fixed-income ETFs took in $21 billion in net new flows during the month, a near mirror image of their experience in March (see Exhibit 2). Notable among the asset gatherers in the bond space were Bronze-rated iShares iBoxx $ Investment Grade Corporate Bond ETF LQD and Neutral-rated iShares iBoxx $ High Yield Corporate Bond ETF HYG. In separate announcements in March and April, the Fed indicated that both funds would be eligible for purchase by the Secondary Market Corporate Credit Facility--a fact that was not lost on investors, as evidenced by the subsequent surge of inflows. For its part, the Fed has yet to buy a single share of any eligible ETF. It recently announced that it would begin making purchases in early May.
Commodities ETPs also saw significant inflows in April. Physical gold ETFs continued to gain assets from safe-haven seekers. SPDR Gold Shares ETF GLD saw $4.9 billion in net new inflows. Oil-futures-based ETPs hit a gusher. Roughly $3.8 billion poured in to United States Oil USO. The product attracted the interest of investors around the world, ranging from individuals looking to make a bet on rebounding crude prices to traders creating new shares to sell short. The result was a debacle. The product had to undergo a turbo-charged metamorphosis to stay afloat--rejiggering its investment objective on the fly in response to unprecedented volatility in oil-futures markets and swelling assets. This episode underscores the need for better labeling for ETPs and greater investor protections.
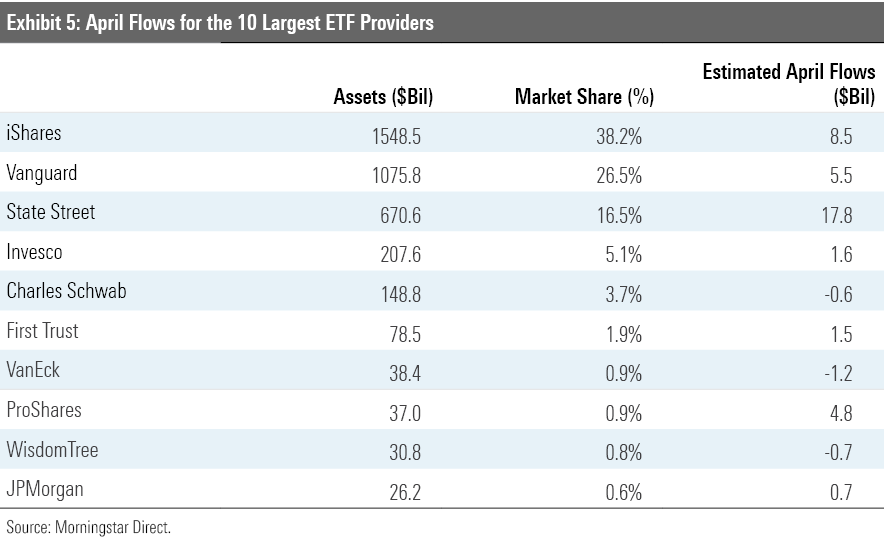
Looking at flows at an ETF issuer level can help tune out some of the noisiness that is a regular feature of short-term ETF flows and yield some signals. From this perspective (see Exhibit 5), it appears that the steady-Eddie clientele served by firms like Vanguard, which tend to serve more advisors and individual investors, are steady as ever. Meanwhile, market volatility continued to be a boon for firms like State Street and ProShares, whose ranges cater to a crowd that uses ETFs in a more tactical manner.
Are There Any Bargains Left? The Morningstar fair value estimate for ETFs rolls up Morningstar's equity analysts' fair value estimates for individual stocks and our quantitative fair value estimates for those stocks not covered by Morningstar analysts into an aggregate fair value estimate for stock ETFs' portfolios. Dividing this value by ETFs' market prices yields a price/fair value ratio. This ratio can point to potential bargains.
Exhibit 6 features the 10 ETFs that were trading at the largest discount to their fair value estimates as of the end of April. Five of them belong to the equity energy category. Pain has been pervasive in the energy sector as demand has declined and supply continues to come to market. With producers running out of places to store their output, prices have collapsed--as have the share prices of firms operating in the oil and gas services industry.
But the market is a discounting mechanism, and in April investors were betting that this too shall pass. Energy stocks rallied in April. Energy Select Sector SPDR ETF XLE, which holds the energy names in the S&P 500, gained nearly 31%. But these stocks have fallen a long way. Even after a double-digit rally, many are still trading at steep discounts.
The list also features a pair of cannabis ETFs. The share prices of firms involved in the cannabis industry had already been under pressure before the onset of the current crisis, which helps explain why they’re featured here in the bargain bin, as well as why they were a bit sluggish in the April rebound.
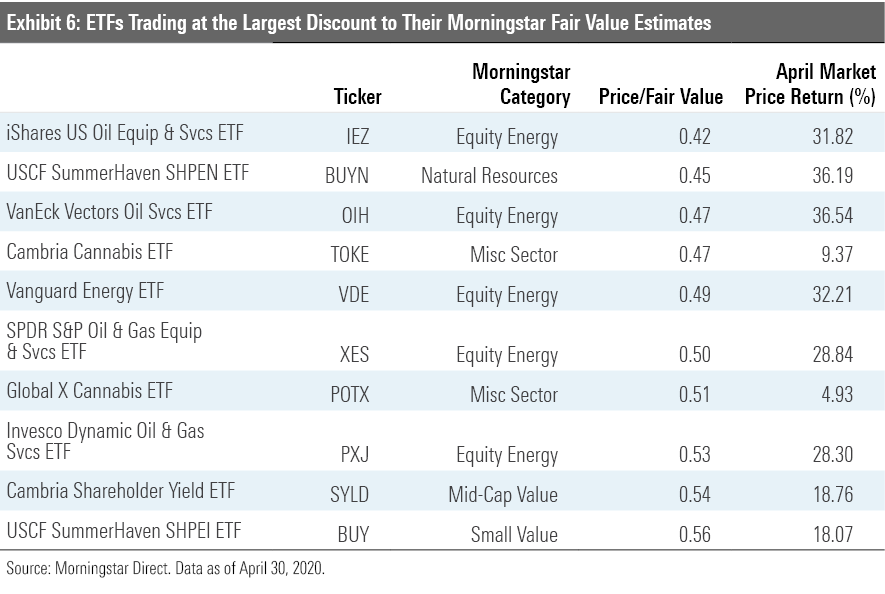
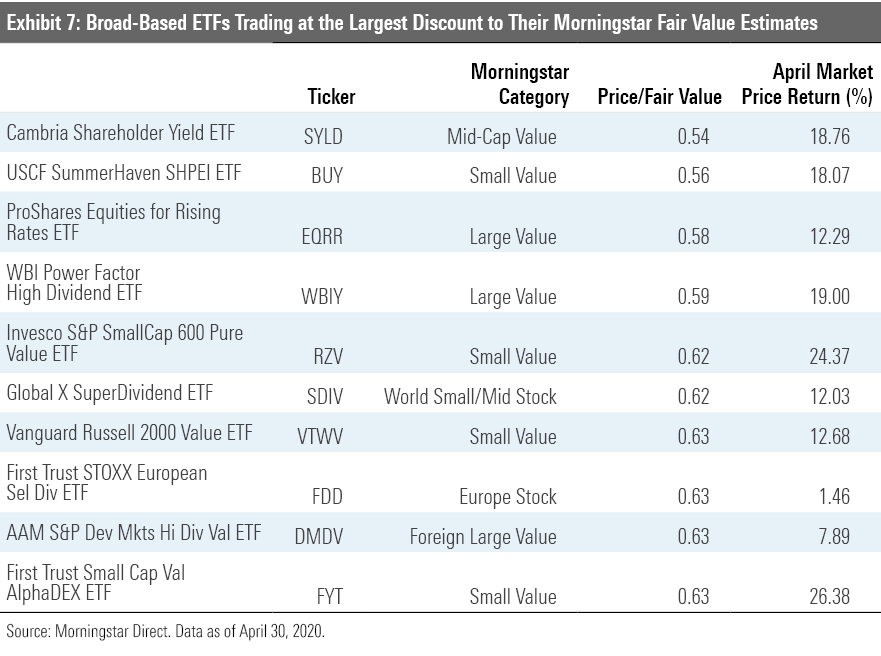
Exhibit 7 features the 10 broad-based ETFs that were trading at the largest discount to their fair value estimates as of the end of April. The common thread among most of these funds is an orientation toward smaller, cheaper stocks. Some of them deliberately lean into value by virtue of selecting and weighting stocks based on value criteria. This is the case for funds like Invesco S&P SmallCap 600 Pure Value ETF RZV. Others back into a deep-value orientation by selecting stocks based on their dividend yields. WBI Power Factor High Dividend ETF WBIY is an example. The fund selects its 50-stock portfolio from the highest-yielding half of its selection universe.
Disclosure: Morningstar, Inc. licenses indexes to financial institutions as the tracking indexes for investable products, such as exchange-traded funds, sponsored by the financial institution. The license fee for such use is paid by the sponsoring financial institution based mainly on the total assets of the investable product. Please click here for a list of investable products that track or have tracked a Morningstar index. Neither Morningstar, Inc. nor its investment management division markets, sells, or makes any representations regarding the advisability of investing in any investable product that tracks a Morningstar index.

/s3.amazonaws.com/arc-authors/morningstar/a90ba90e-1da2-48a4-98bf-a476620dbff0.jpg)
/cloudfront-us-east-1.images.arcpublishing.com/morningstar/T2LGZCEHBZBJJPPKHO7Y4EEKSM.png)
/d10o6nnig0wrdw.cloudfront.net/04-18-2024/t_34ccafe52c7c46979f1073e515ef92d4_name_file_960x540_1600_v4_.jpg)
/d10o6nnig0wrdw.cloudfront.net/04-09-2024/t_e87d9a06e6904d6f97765a0784117913_name_file_960x540_1600_v4_.jpg)
:quality(80)/s3.amazonaws.com/arc-authors/morningstar/a90ba90e-1da2-48a4-98bf-a476620dbff0.jpg)