
Quarter-End Markets Summary: From Record Highs to Worst Since ...
Here's a list of all the hits.
/s3.amazonaws.com/arc-authors/morningstar/ed529c14-e87a-417f-a91c-4cee045d88b4.jpg)
/s3.amazonaws.com/arc-authors/morningstar/8b2e267c-9b75-4539-a610-dd2b6ed6064a.jpg)
Editor’s note: Read the latest on how the coronavirus is rattling the markets and what investors can do to navigate it. This article originally appeared in Morningstar Direct Cloud and Morningstar Office Cloud.
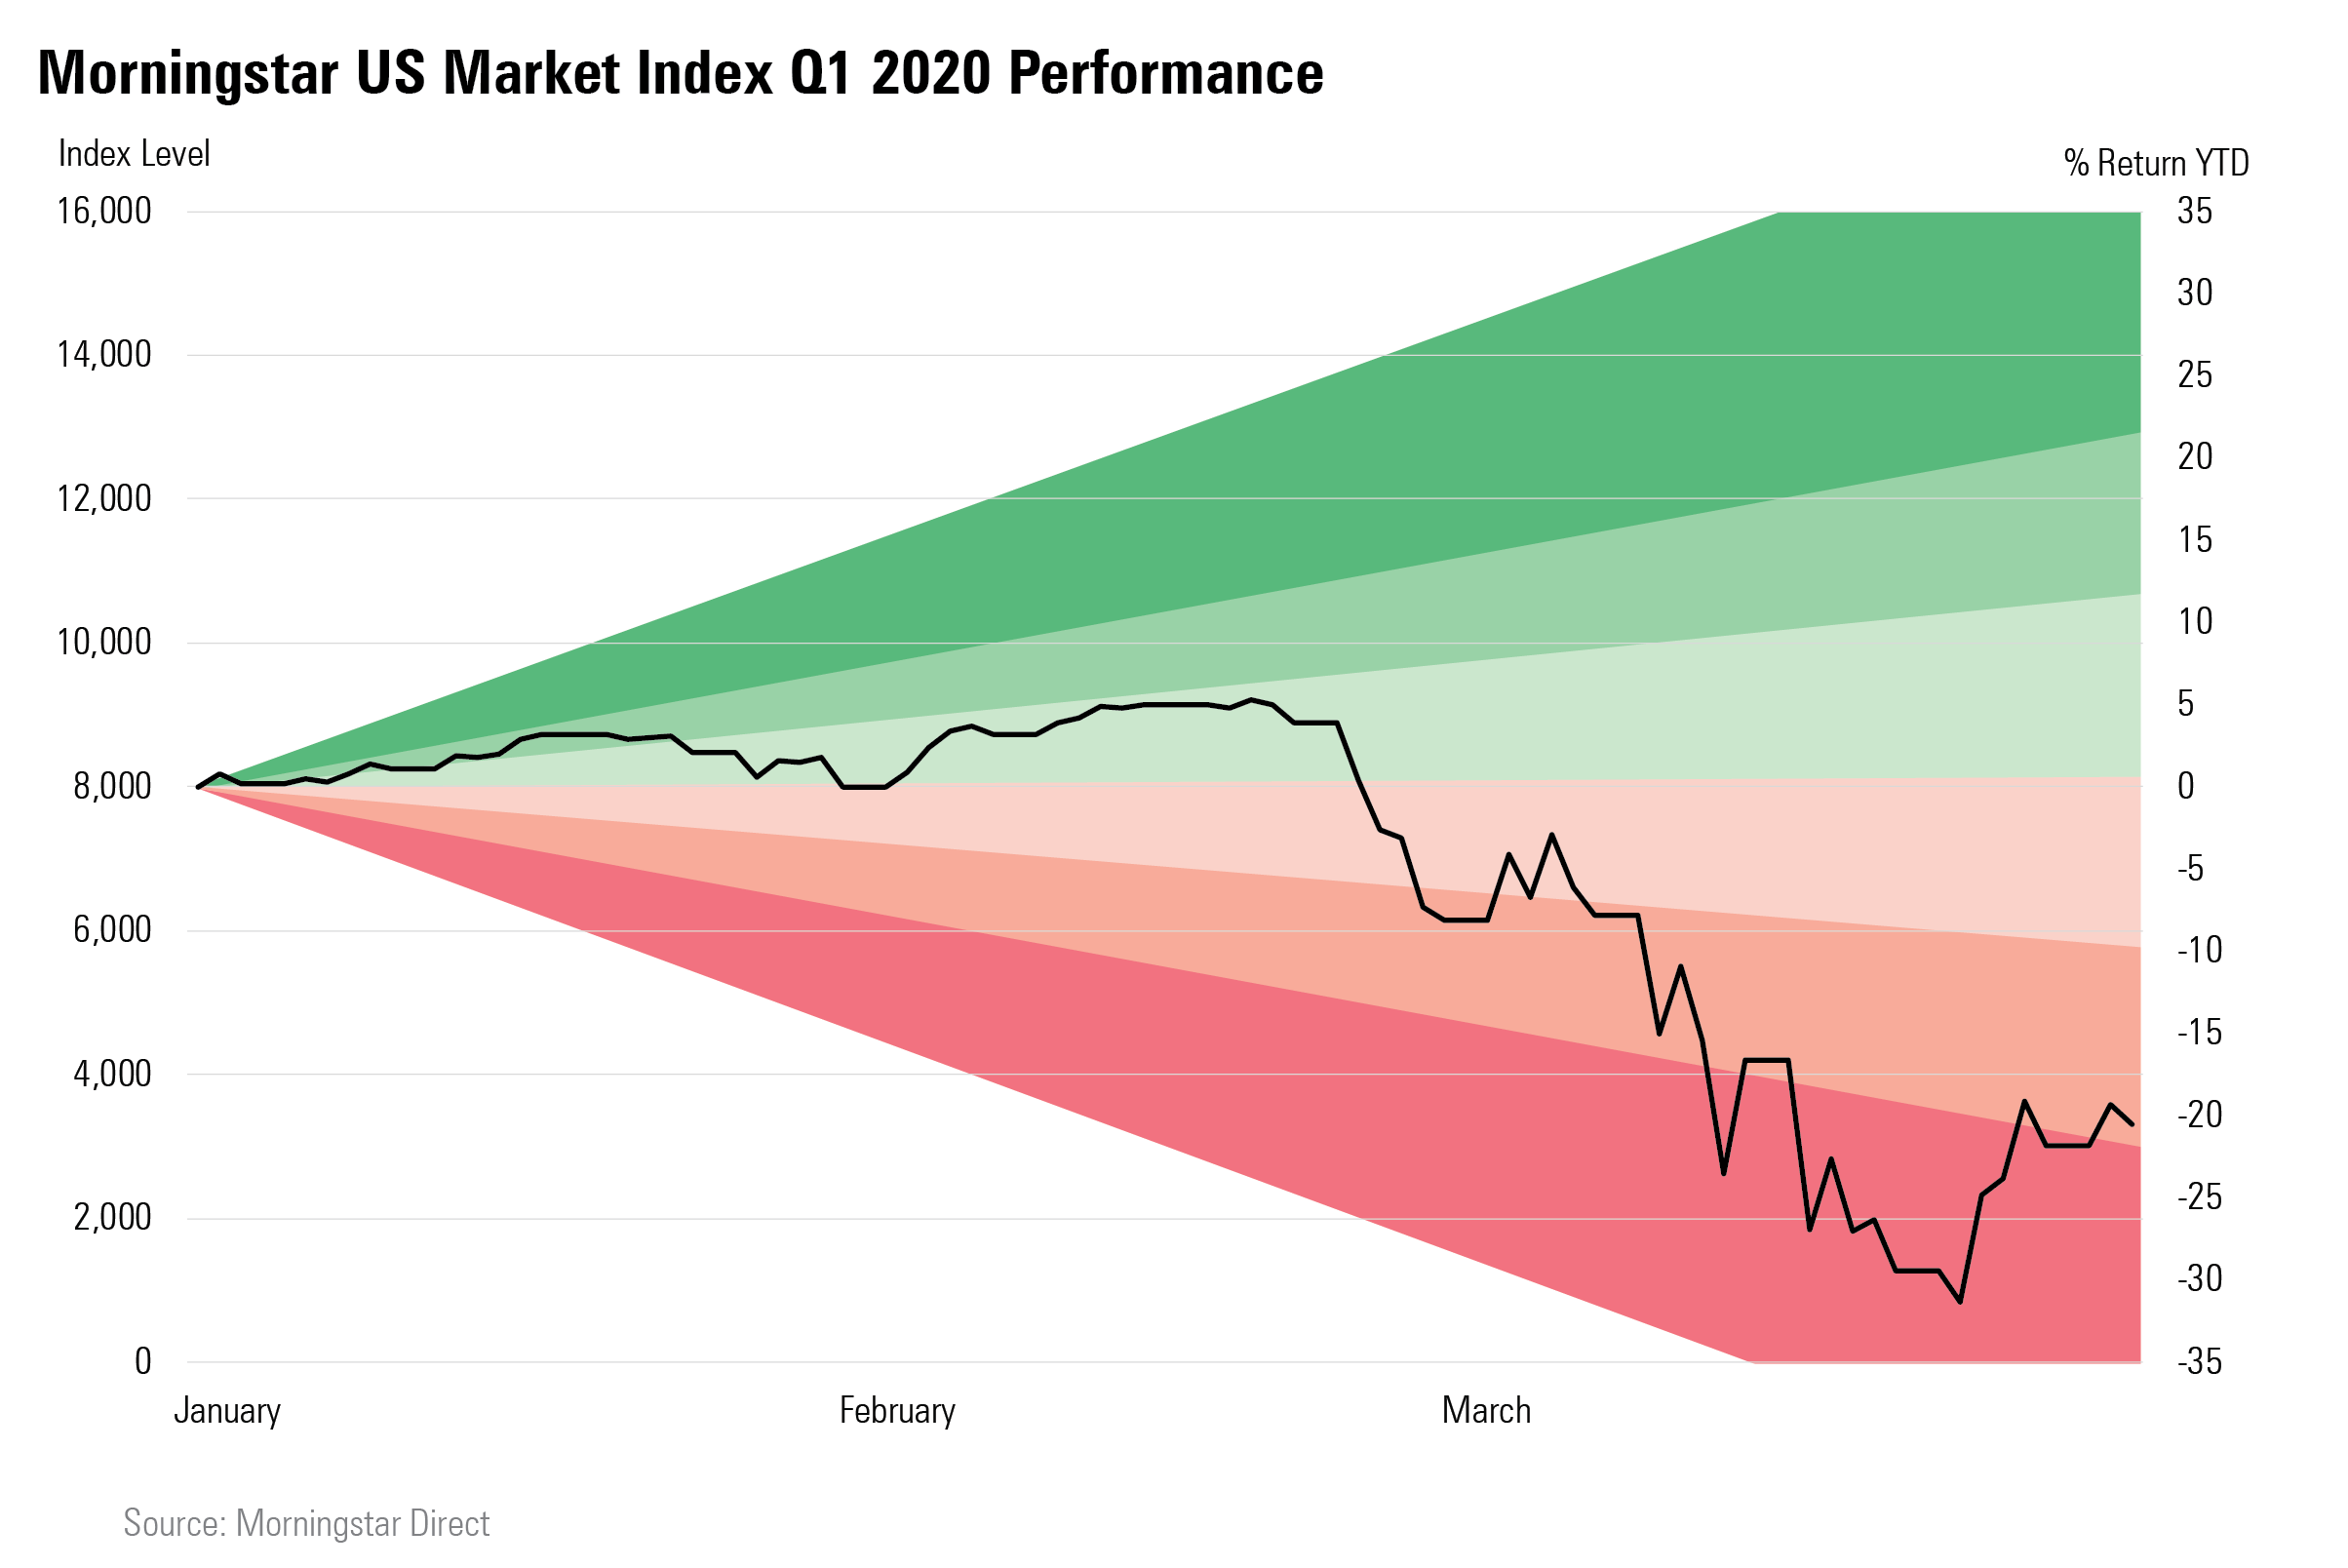
For global markets--as well as just about everything else--the first quarter can be split almost exactly in half: before and after coronavirus.
The year began with financial markets weathering the threat of war between the United States and Iran, and by mid-February U.S. stocks were carving out fresh record highs, thanks in part to easier monetary policy.
Then came the impact of the coronavirus, and the bottom fell out for stocks and credit-sensitive bond sectors. From its peak on Feb. 19 to its trough on March 20, the Morningstar U.S. Market Index fell 32.6% before rebounding from its lows in response to Congressional passage of a $2 trillion economic rescue package and aggressive steps to further ease monetary policy by the Federal Reserve.
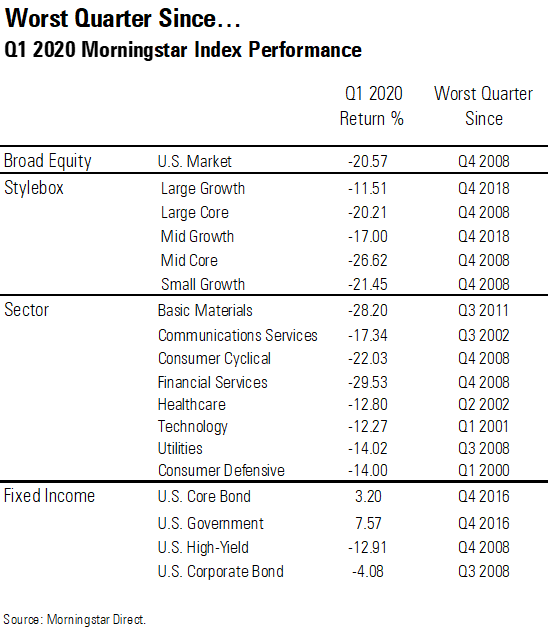
The final tally for the quarter saw the Morningstar U.S. Market Index post its worst decline since the fourth quarter of 2009 during the global financial crisis. For more details on how quarterly index performances ranked, see our “Worst Quarter Since…” table at the end of this article.
Although U.S. stocks did far better than non-U.S. developed and emerging markets, across global equities markets the damage was relatively consistent as COVID-19 crippled economies around the world.
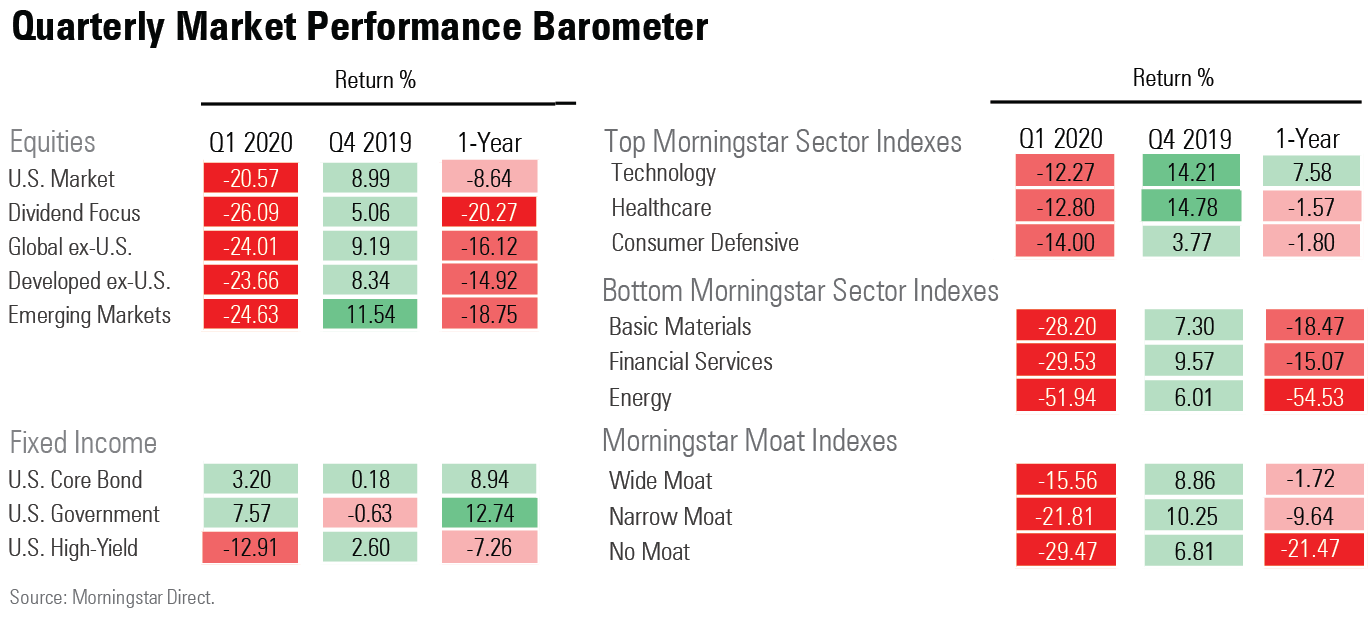
Within the U.S. stock market, the initial days of the sell-off saw indiscriminate selling that saw little distinction between sectors or quality among companies. But as the bear market wore on, some significant distinctions in performance materialized.
Energy stocks extended already significant declines as oil prices collapsed thanks to a double whammy of the abrupt halt to economic activity and as price war between OPEC and Russia had fueled the global oversupply of oil. Financial stocks, meanwhile, posted steep declines as the Fed’s reduction of interest rates to zero hammered expectations for banks’ ability to generate interest income and as the economic collapse raised worries about a jump in delinquent loans.
Technology stocks benefited from their relatively low exposure to the economic fallout from the virus, while utilities stocks benefited from their higher yields as share prices were dragged down by the broader market.
Another trend was the buoyancy of high-quality stocks, as reflected in Morningstar’s Moat Indexes. Wide-moat stocks have the strongest competitive advantage and no moats, the least. Essentially, the moat designations can be seen as a forward-looking definition of quality. Notably, wide-moat stocks outperformed the broader stock market.
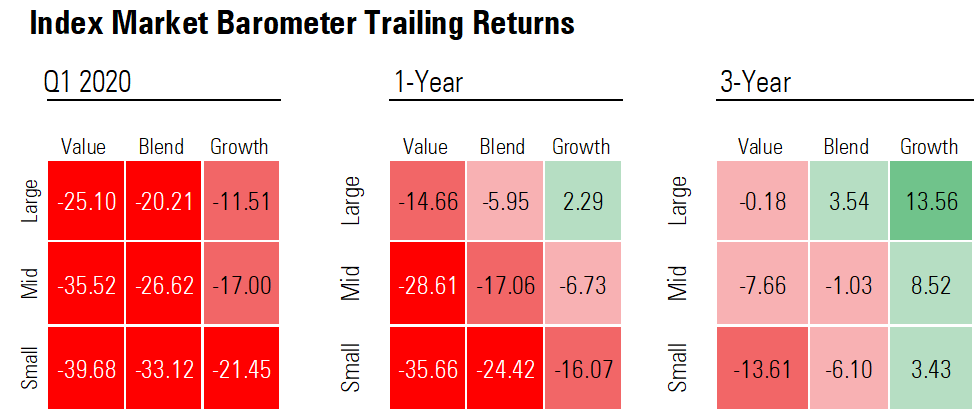
As was the case with sectors, during the first two weeks of the sell-off, whether a stock landed in the growth or value bucket didn’t make much of a difference. But as the market volatility wore on, the trend for long-standing outperformance of growth stocks over value re-emerged. As seen in the following chart, there was a greater correlation between where a stock landed in the growth-value spectrum than market capitalization.
For each of the value categories, the declines were the largest in the 23-year histories for the three Morningstar value indexes, eclipsing financial crisis losses.
The story in the bond market was one of a flight to safety. Bonds with credit risk--such as investment-grade and high-yield corporate bonds--were dragged down by worries about the economic impact of COVID-19, especially for borrowers with lower credit quality. That meant that many portions of the bond market were still in the red for the quarter, offering somewhat less diversification from the stock market decline than investors might have expected from their bond holdings.
While credit spreads widened massively, they did not reach the peak levels seen during the 2008 global financial crisis when the corporate bond market effectively stopped functioning. The Fed’s efforts, coupled with the bailout package from Washington, also helped stop the bleeding in the credit markets before quarter end.
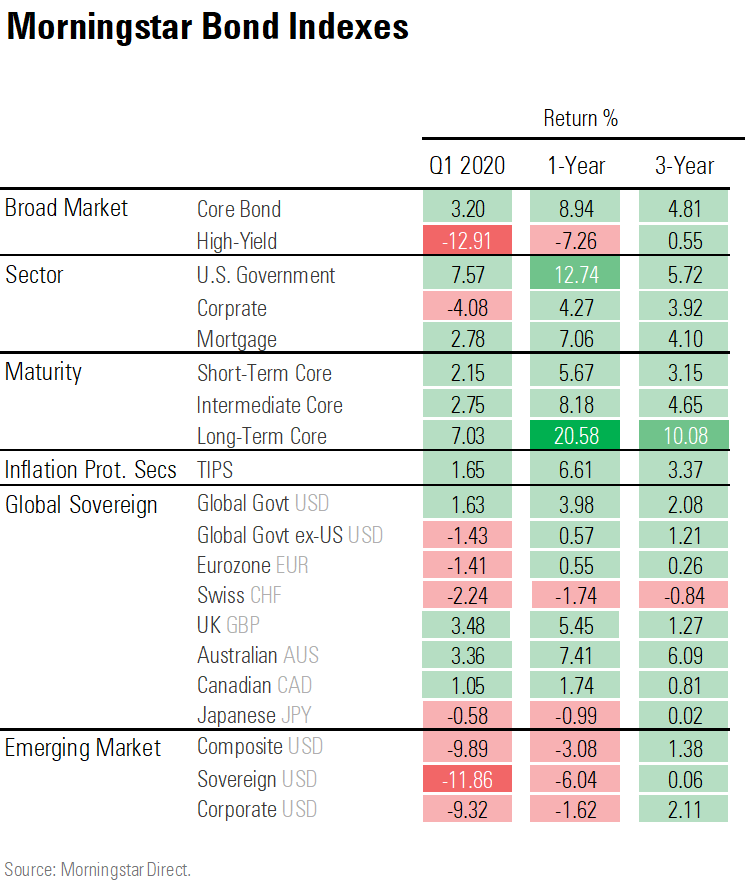
Meanwhile, investors piled into government bond markets in search of safety, as bond prices were given additional lift by the Fed’s efforts to pump money into the U.S. economy.
Here’s our look at “worst since” statistics. Many Morningstar stock and bond indexes posted their worst performance going back more than two decades, to quarters before the index history began. This table shows “worst since” readings for benchmarks in this article where the dates fell within the index history.
/cloudfront-us-east-1.images.arcpublishing.com/morningstar/T5MECJUE65CADONYJ7GARN2A3E.jpeg)
/cloudfront-us-east-1.images.arcpublishing.com/morningstar/VUWQI723Q5E43P5QRTRHGLJ7TI.png)
/d10o6nnig0wrdw.cloudfront.net/04-22-2024/t_ffc6e675543a4913a5312be02f5c571a_name_file_960x540_1600_v4_.jpg)
:quality(80)/s3.amazonaws.com/arc-authors/morningstar/ed529c14-e87a-417f-a91c-4cee045d88b4.jpg)
:quality(80)/s3.amazonaws.com/arc-authors/morningstar/8b2e267c-9b75-4539-a610-dd2b6ed6064a.jpg)