
Analyzing the Recent Performance of the Morningstar Rating for Funds
The star rating appears to succeed in steering investors toward funds likelier to outperform their average peer and away from those more likely to lag.
/s3.amazonaws.com/arc-authors/morningstar/550ce300-3ec1-4055-a24a-ba3a0b7abbdf.png)
Editor's note: Read the latest on how the coronavirus is rattling the markets and what investors can do to navigate it.
How has the Morningstar Rating for Funds, better known as the star rating, performed recently? In this piece, we examine the star rating's performance during the recent sell-off (Feb. 20, 2020-March 31, 2020), the rally that preceded it (Dec. 24, 2018-Feb. 19, 2020), and the roughly 15-month period spanned by the rally and sell-off (Dec. 24, 2018-March 31, 2020). In addition, we assess the relationship between the star rating and fund fees, as well as the star rating's long-term performance.
Executive Summary Funds with higher star ratings (4- and 5-star) outperformed their average peers during the recent sell-off and the rally that preceded it, while lower-rated funds (1- and 2-star) underperformed. Over the full period spanning the rally and sell-off, 5-star funds topped their average peer by about 1.25% per year while 1-star funds lagged by roughly 2% per year. All told, higher-rated funds were about 1.5 times more likely to beat their category average than lower-rated funds over the full period.
Fee differences explain part of the star rating's success in sorting funds. That is, higher-rated funds tended to be cheaper than lower-rated funds, on average, with those fee differences appearing to accrue to investors' benefit.
These findings are consistent with our analysis of the star rating's longer-term performance, which shows the ratings have tended to point investors toward funds that are likelier to outperform and steer them away from those more likely to fall short.
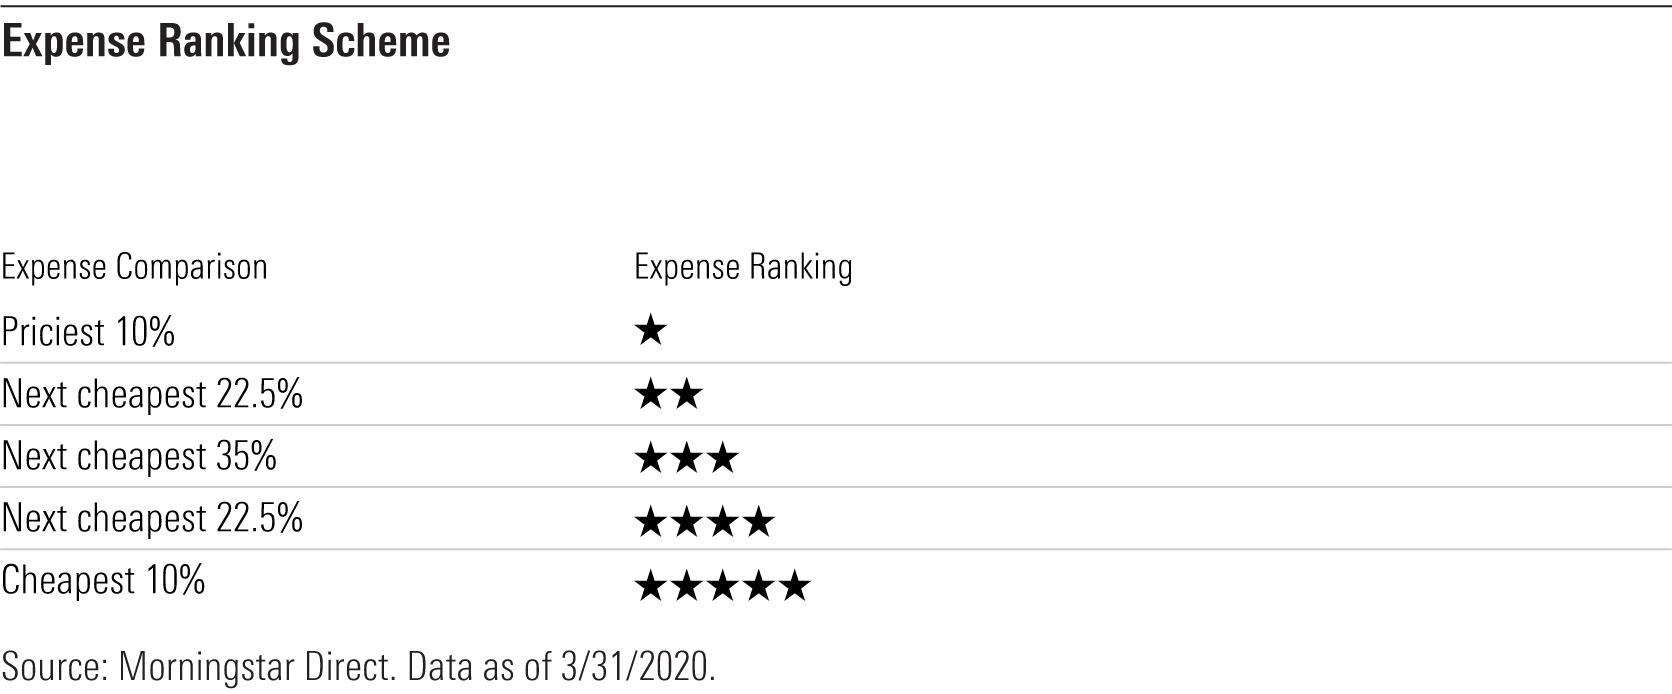
Background The star rating is a quantitative system that rates funds based on their past risk-adjusted performance ranks versus their Morningstar Category peers. The star rating follows a bell-curve distribution, with the best-performing 10% of funds in each category receiving 5 stars, the next 22.5% 4 stars, the middle 35% 3 stars, the next 22.5% 2 stars, and the bottom 10% 1 star.
The star rating is meant to serve as a starting point for research by ranking funds in an objective, transparent manner. It is not intended to predict funds' future performance. That said, we assess its performance to ensure that it is sorting funds in a way consistent with what we'd expect of an effective starting point for research.
Study For an explanation of how we conducted this performance analysis, please see the "Notes" section at the end of this article.
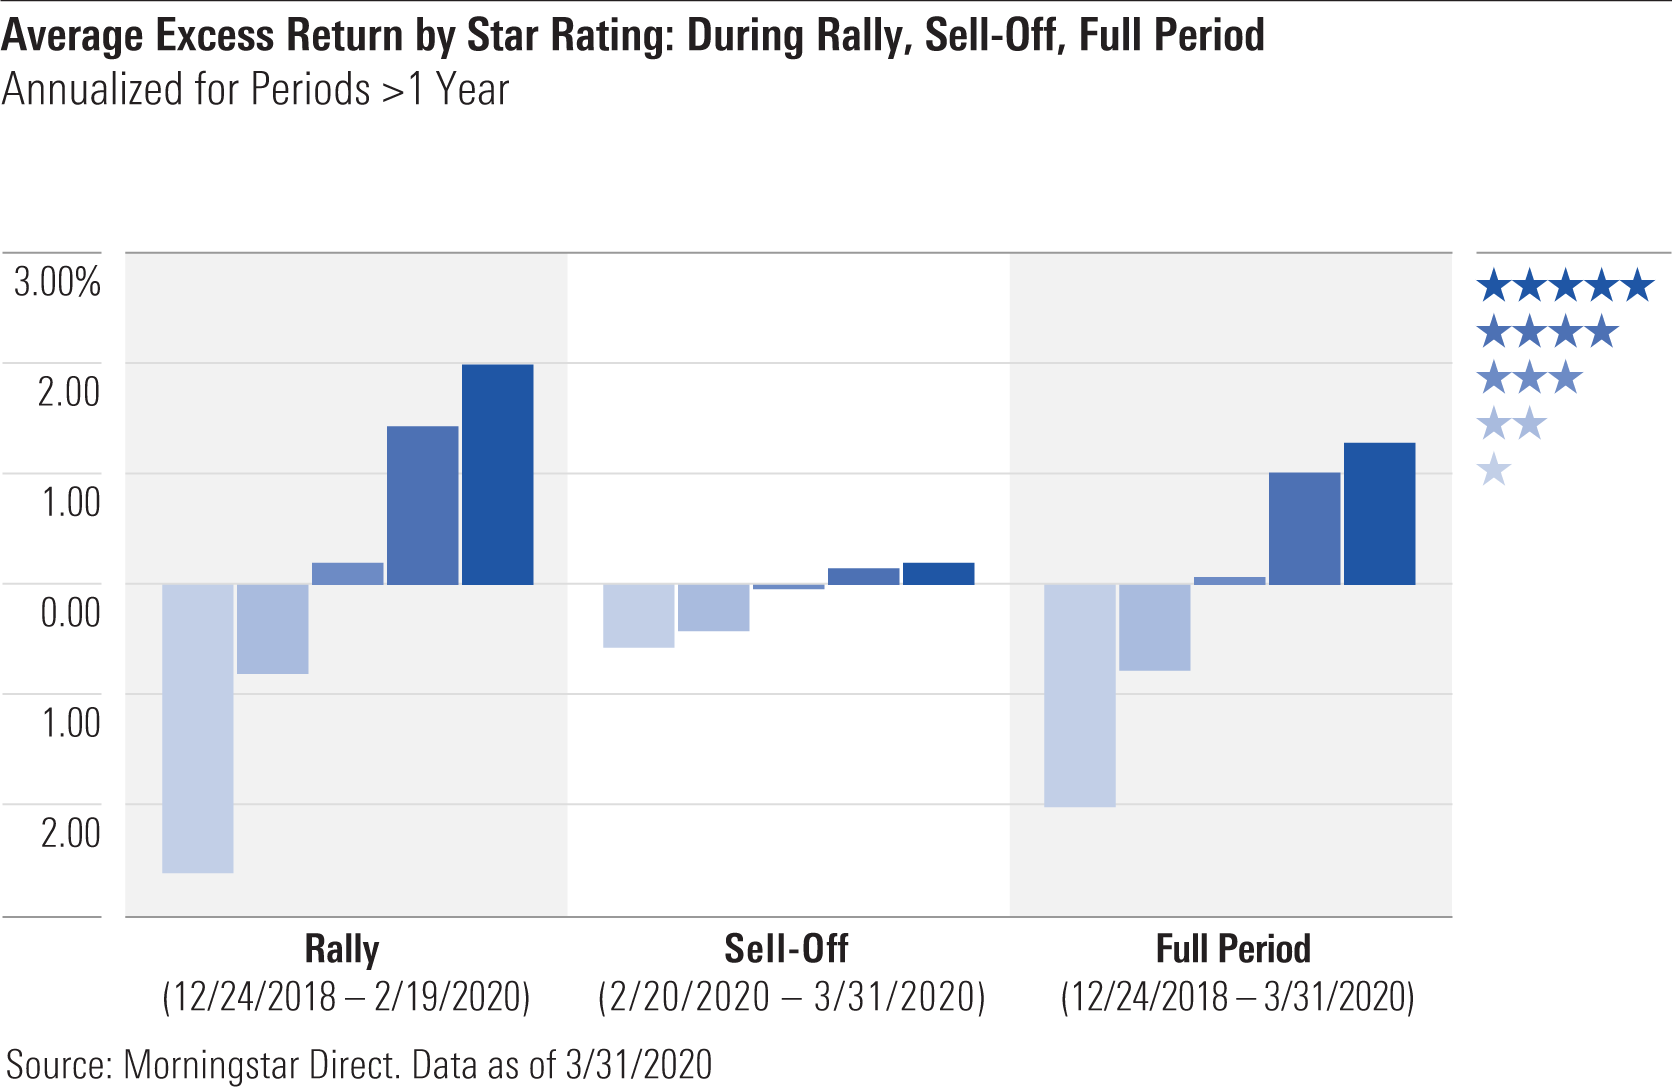
Recent Performance In summary, the average higher-rated fund beat its average peer during the sell-off, the preceding rally, and the period spanning the rally and the sell-off, while lower-rated funds lagged.
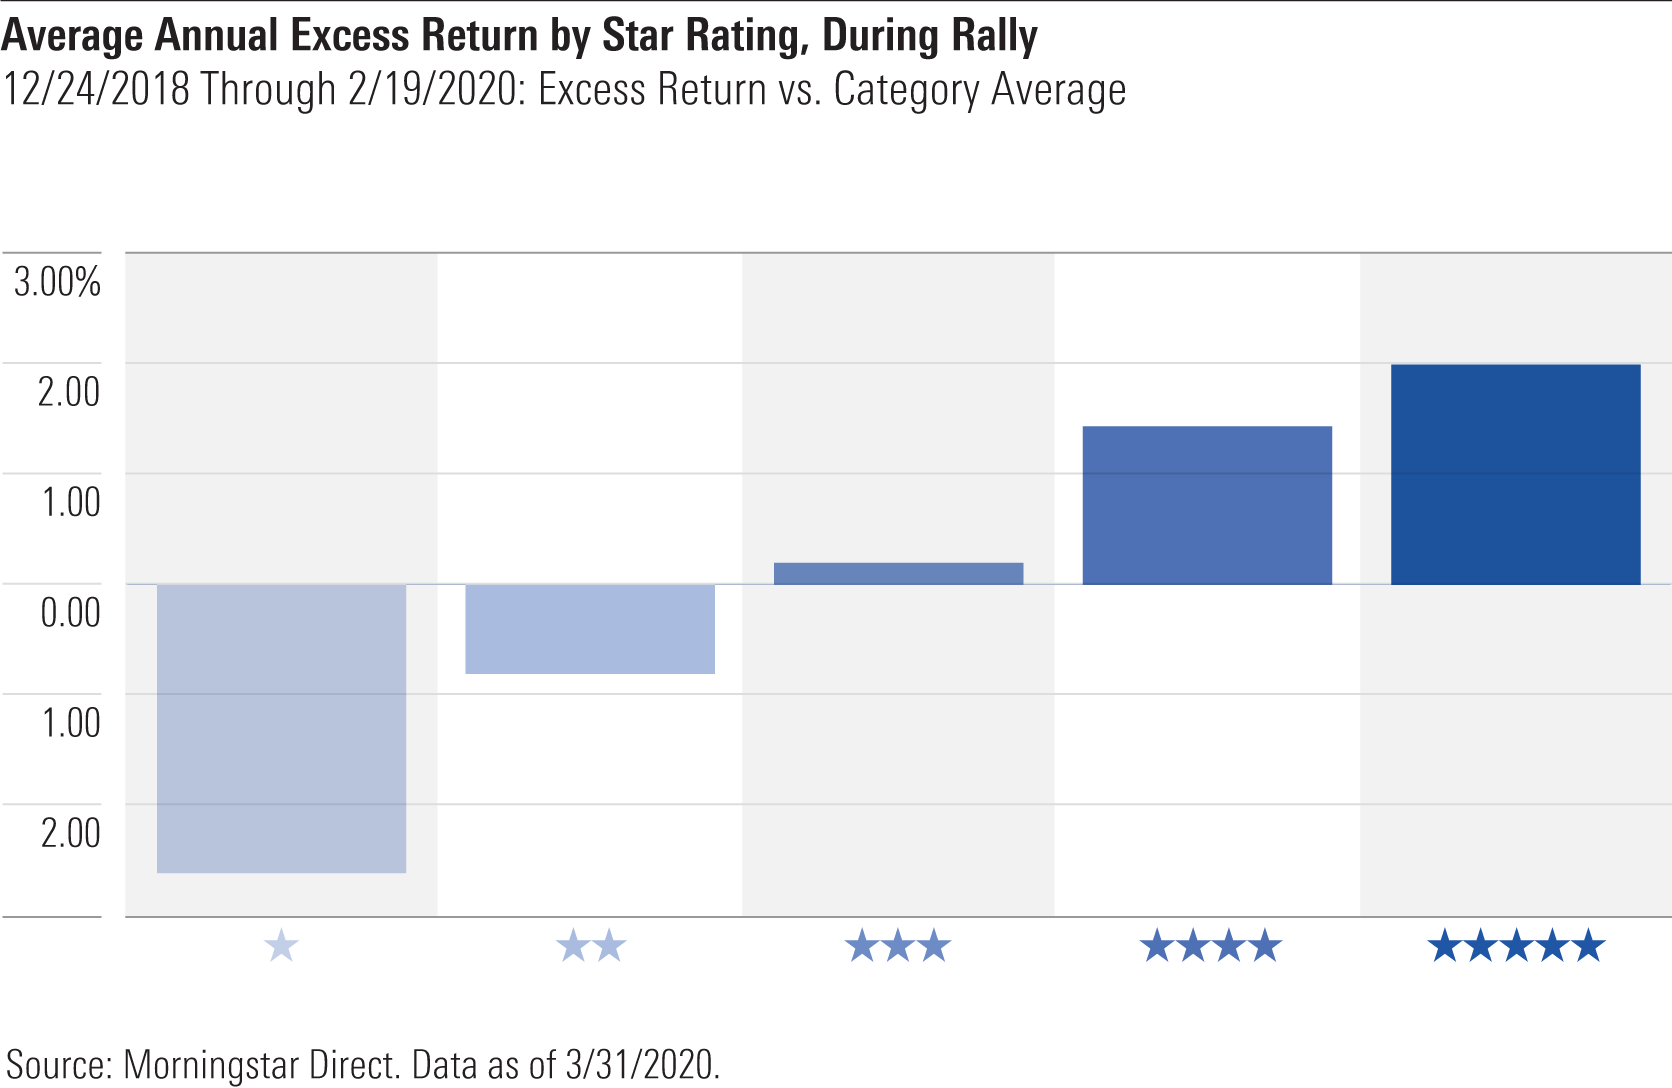
During the rally, the average 5-star fund beat its category average peer by 2% per year. In contrast, the average 1-star fund trailed its average peer by more than 260 basis points per year.
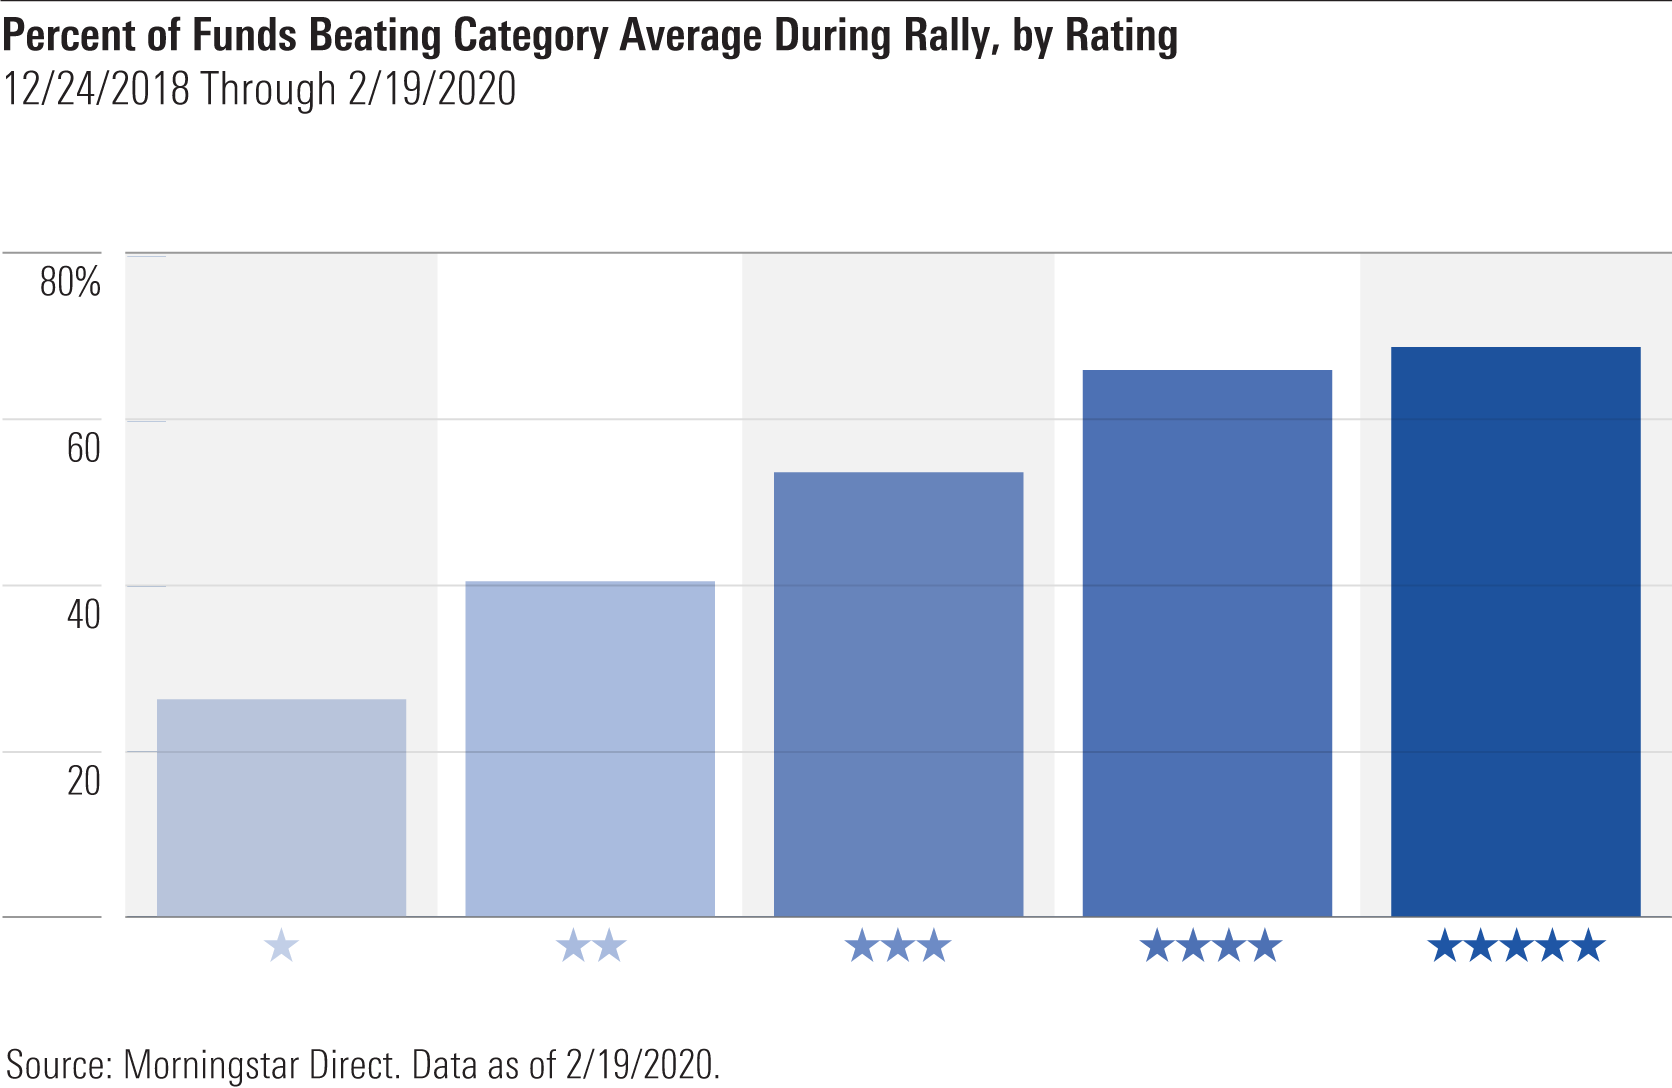
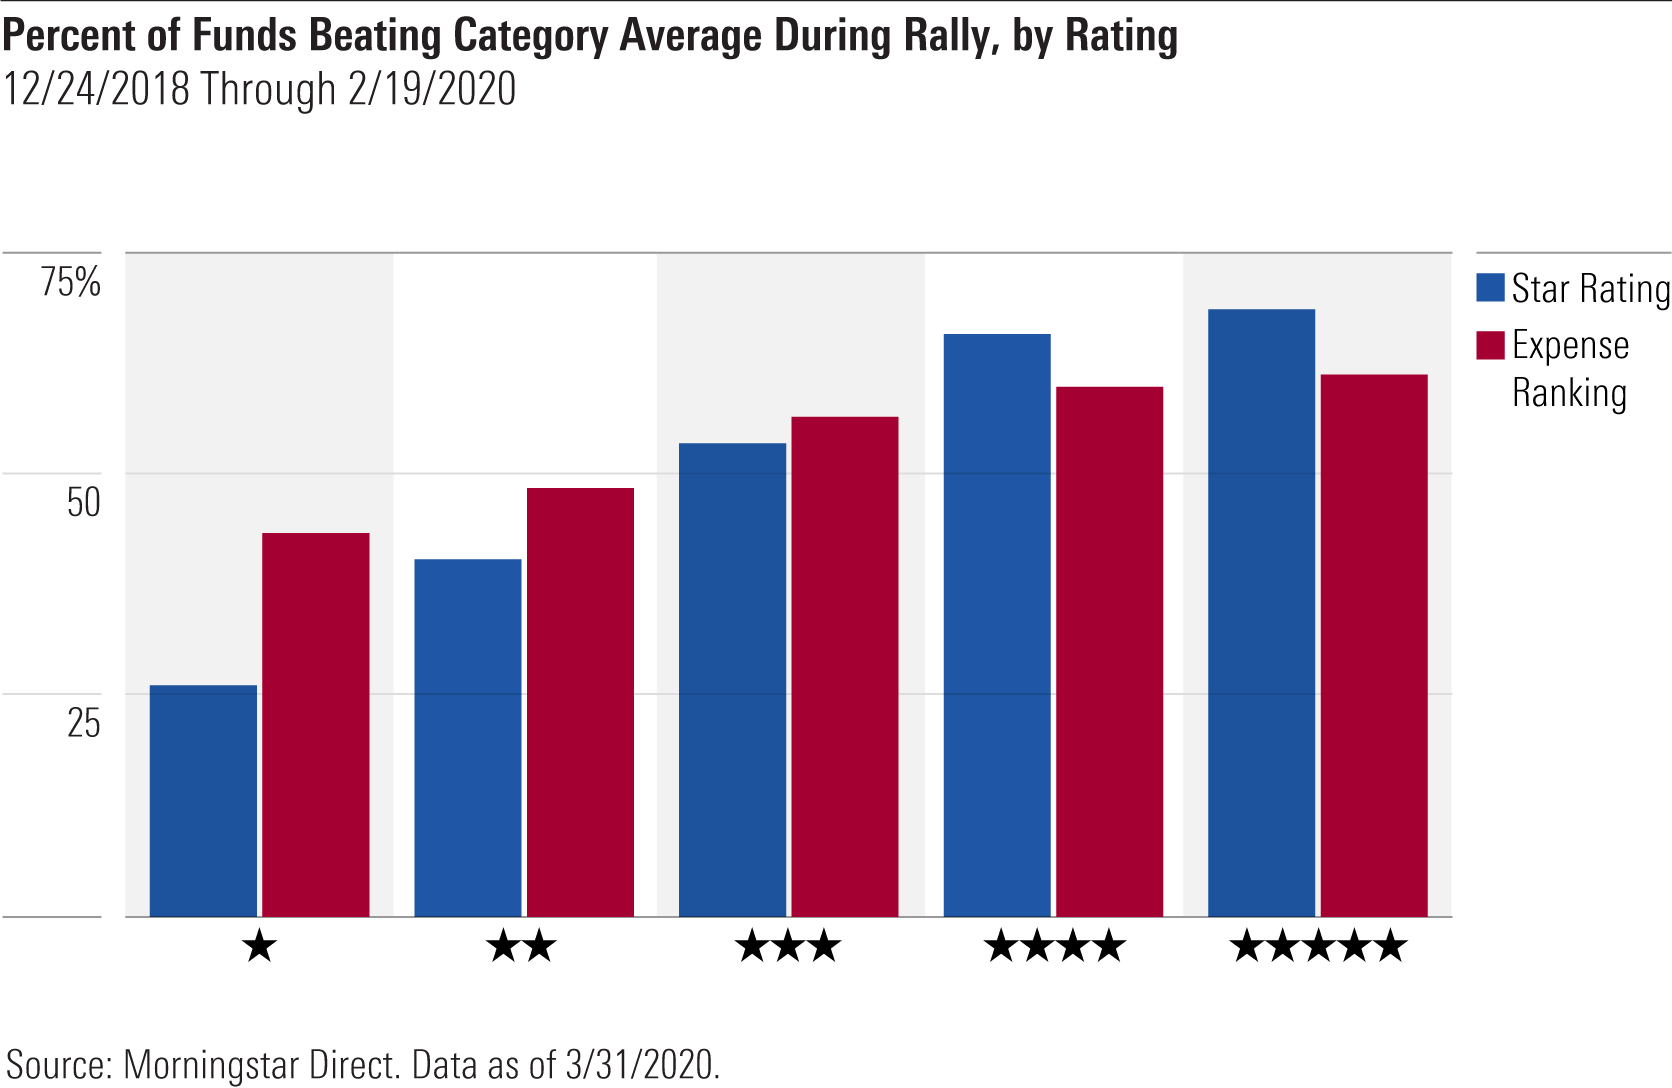
Higher-rated funds outperformed their average peer about twice as often as lower-rated funds during the rally, as shown below.
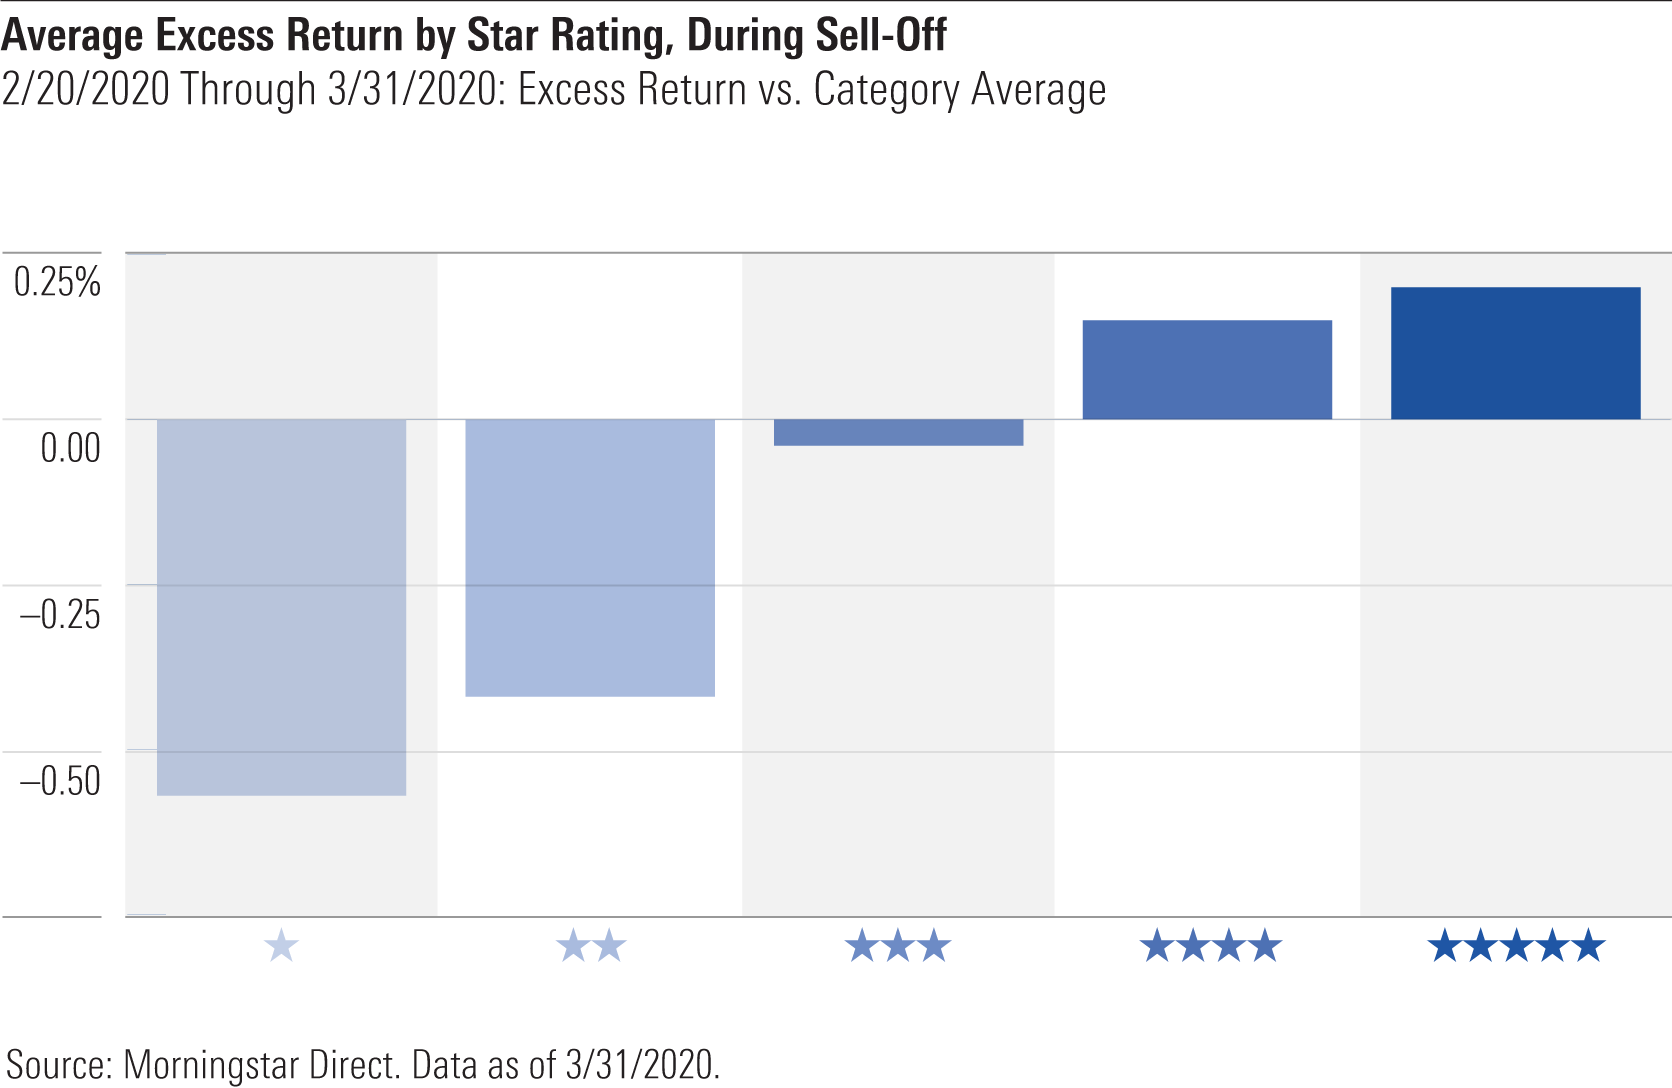
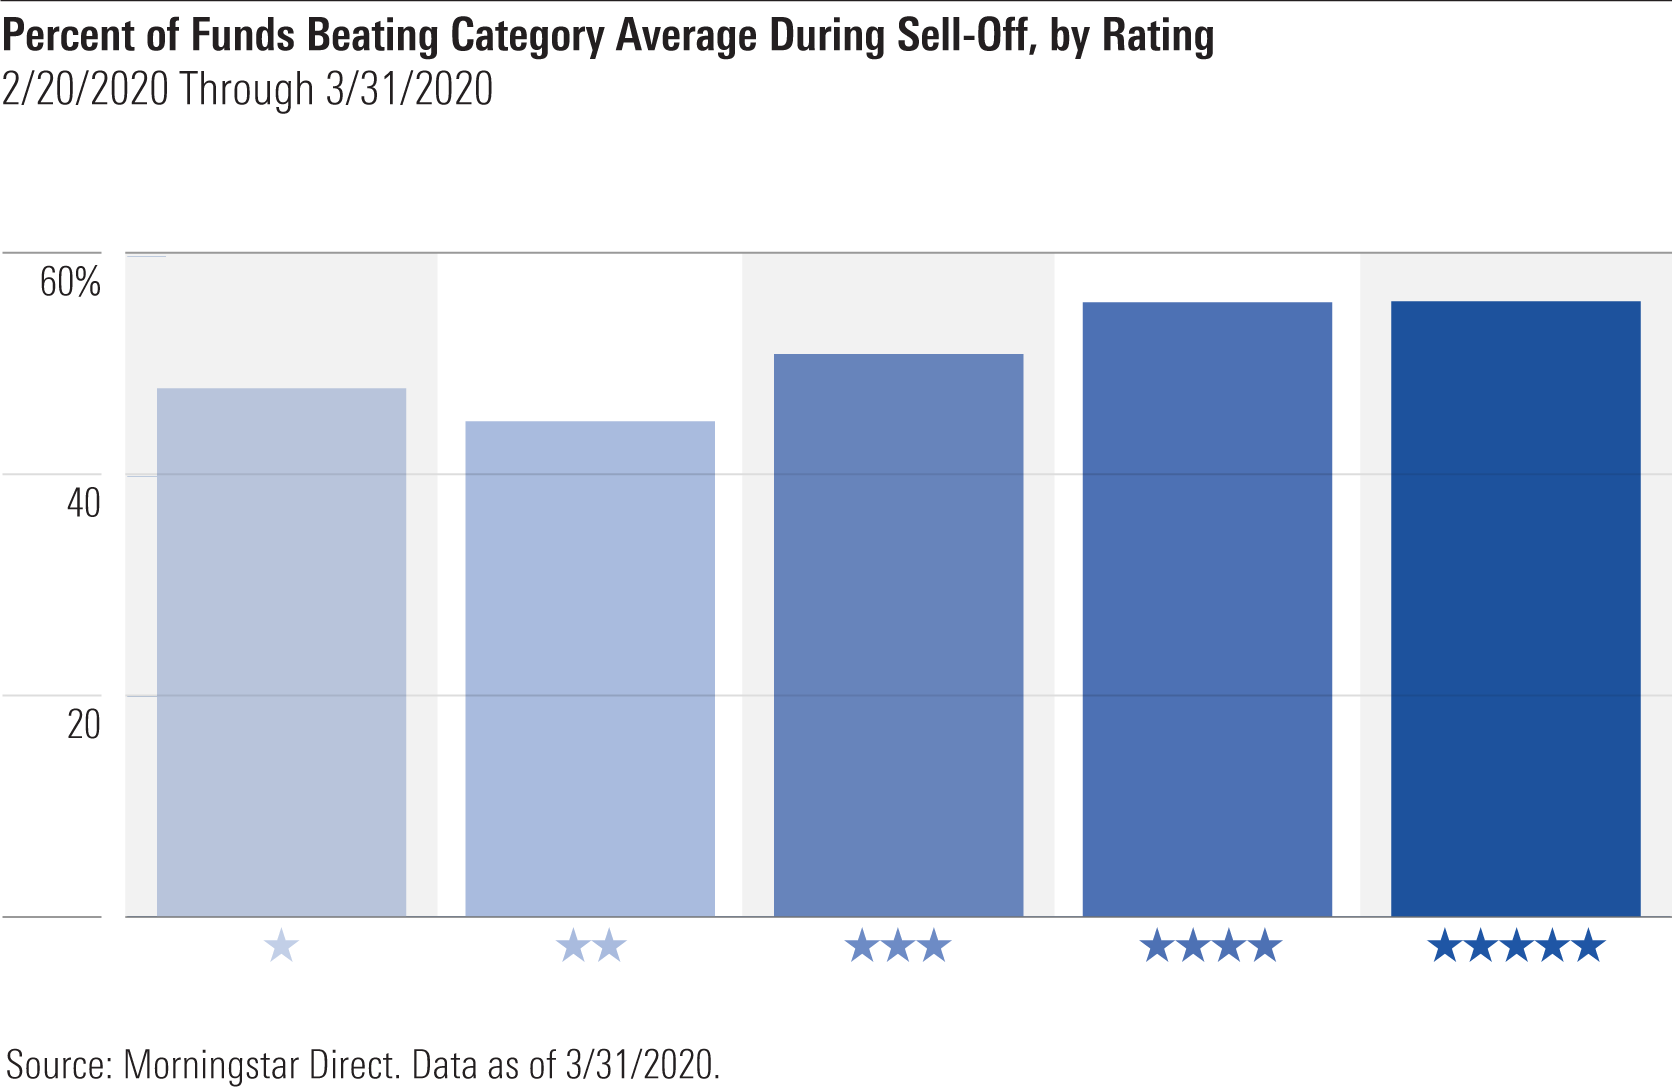
During the sell-off, the average 5-star fund beat its average peer by around 0.13%, while the average 1-star fund lagged by 0.57%.
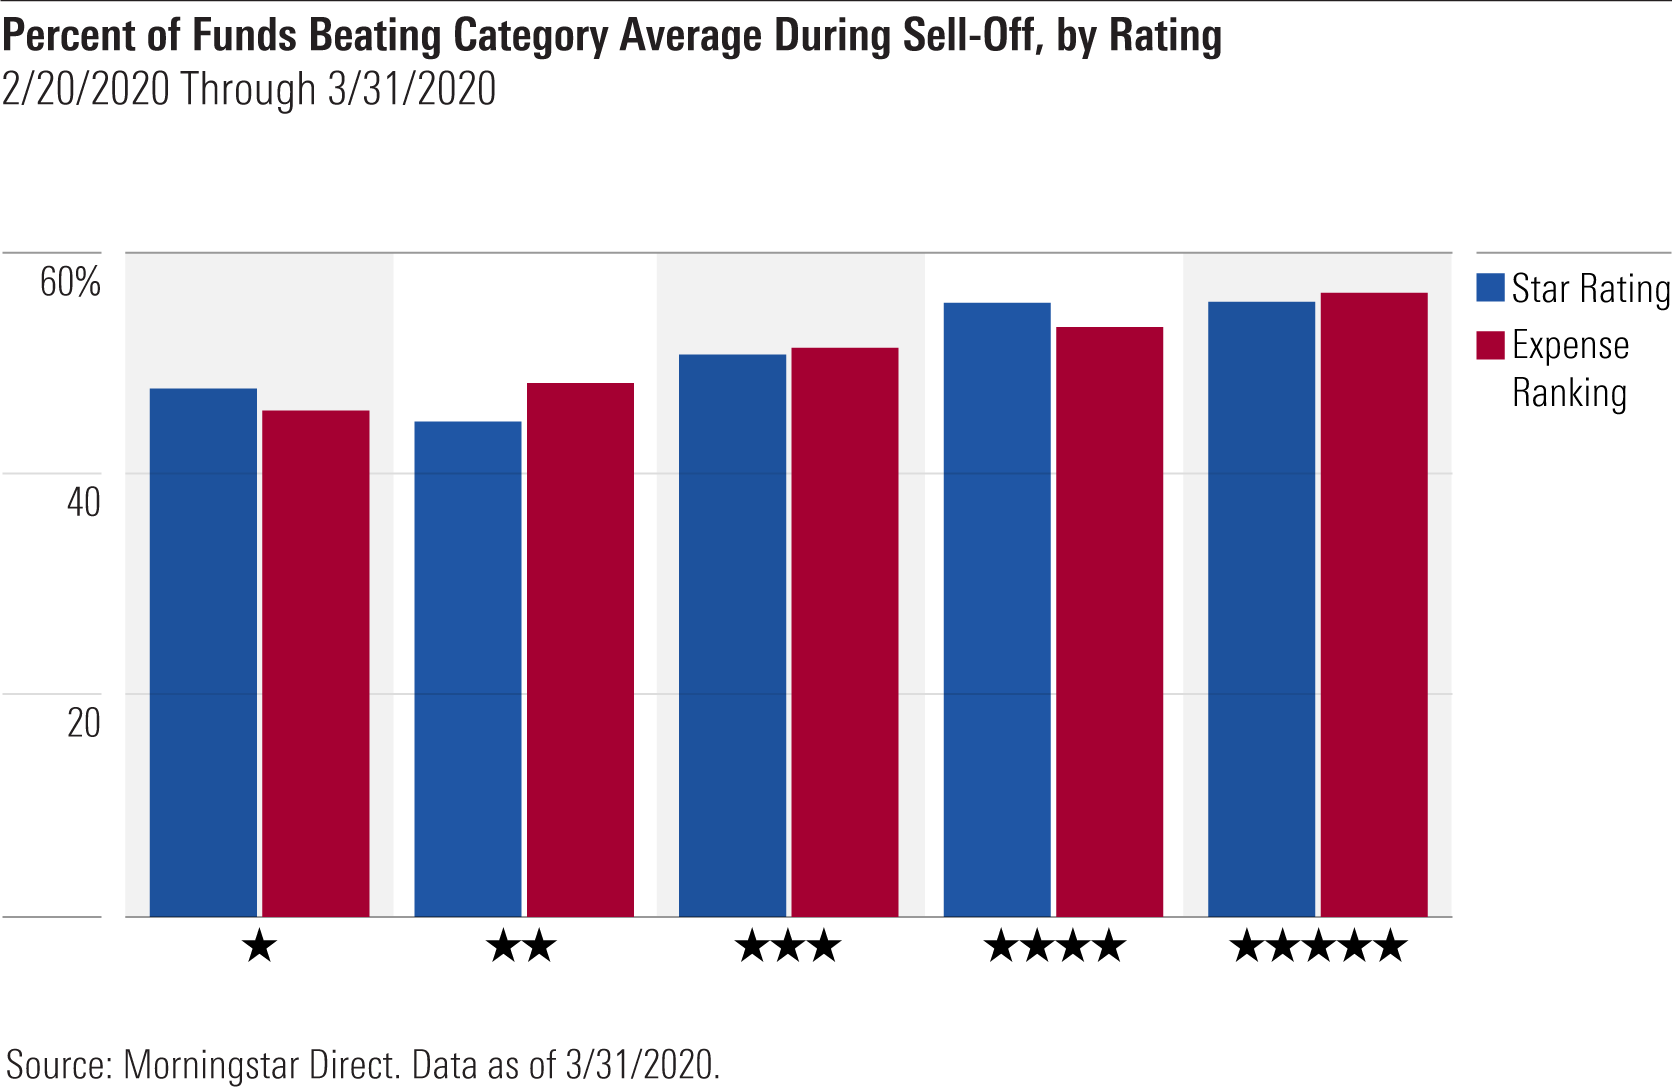
Around 55% of higher-rated funds outperformed their average peer during the sell-off, versus 46% of lower-rated funds, as shown below.
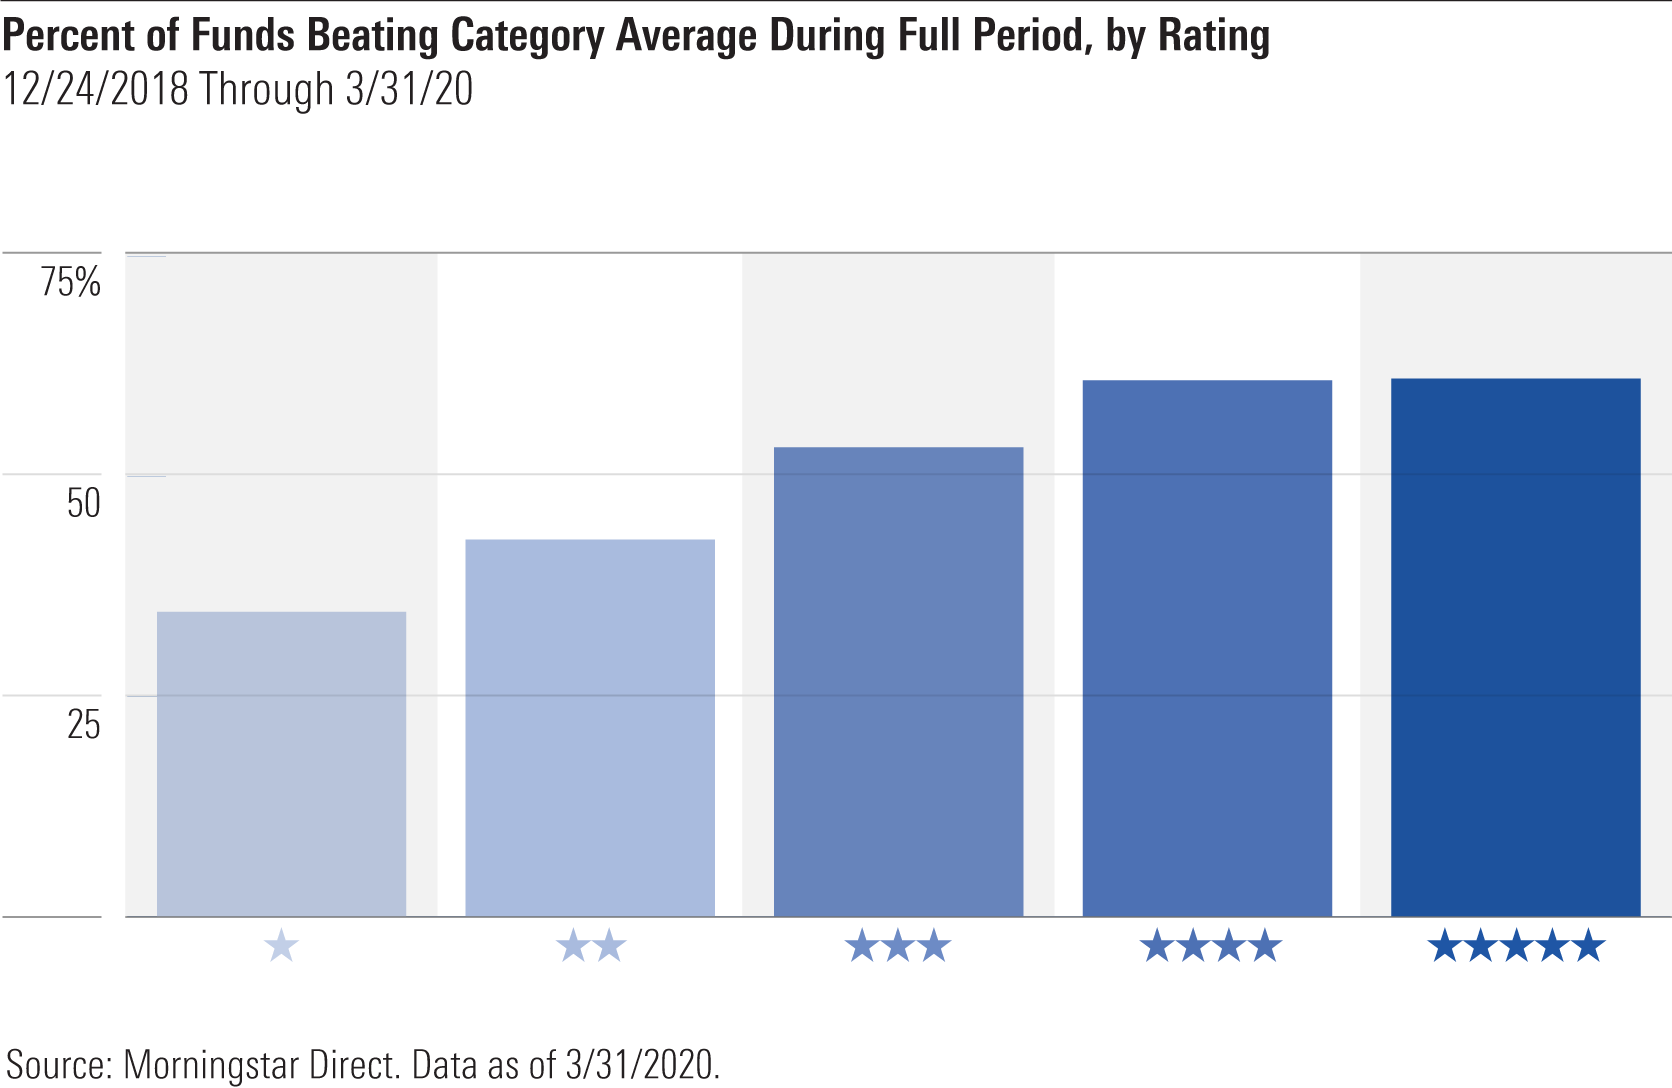
Over the full period, the average 5-star fund beat the category average by nearly 1.25% per year; the average 1-star fund lagged by around 2% per year.
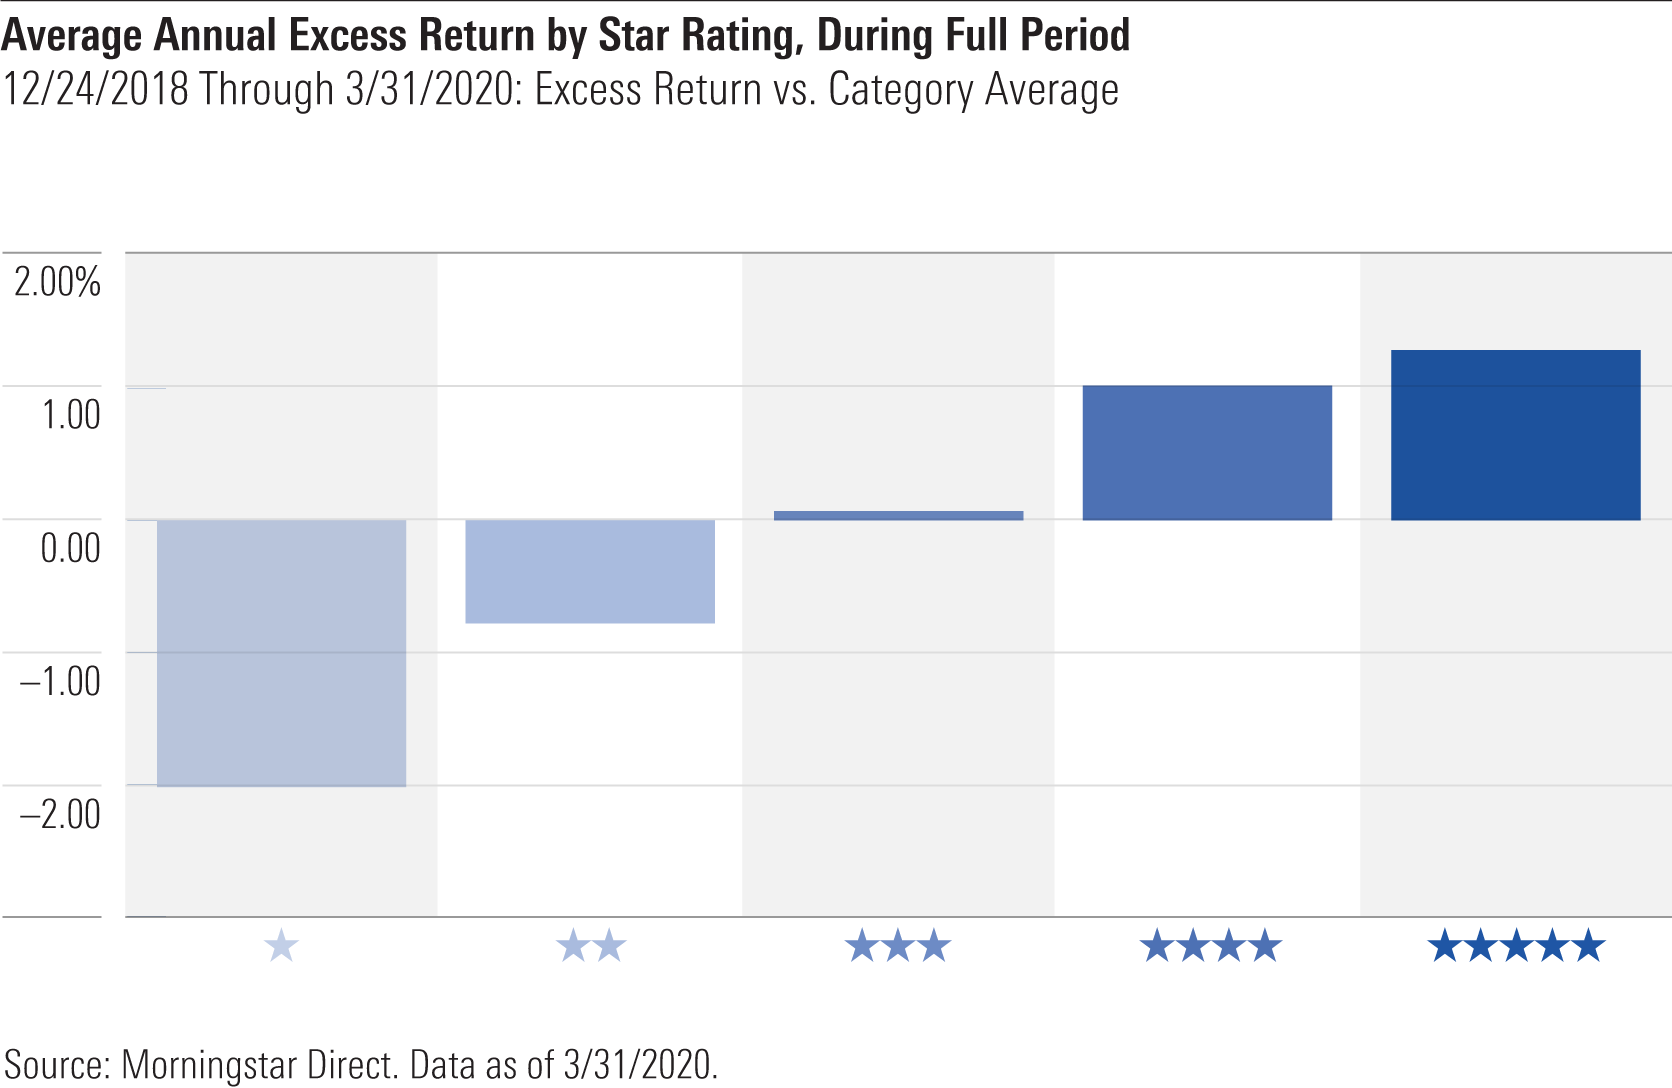
Higher-rated funds outperformed their average peer about 1.5 times as often as lower-rated funds during the full period spanning the rally and sell-off, as shown below.
(Note: For further details on how the star rating performed by asset class, see the "Appendix" at the end of this article.)
Last, we did a before/after comparison of funds' star ratings using their starting rating (their ratings as of Nov. 30, 2018, the month-end immediately preceding the beginning of the rally) and ending rating (the most recently available ratings, as of March 31, 2020), as shown below.
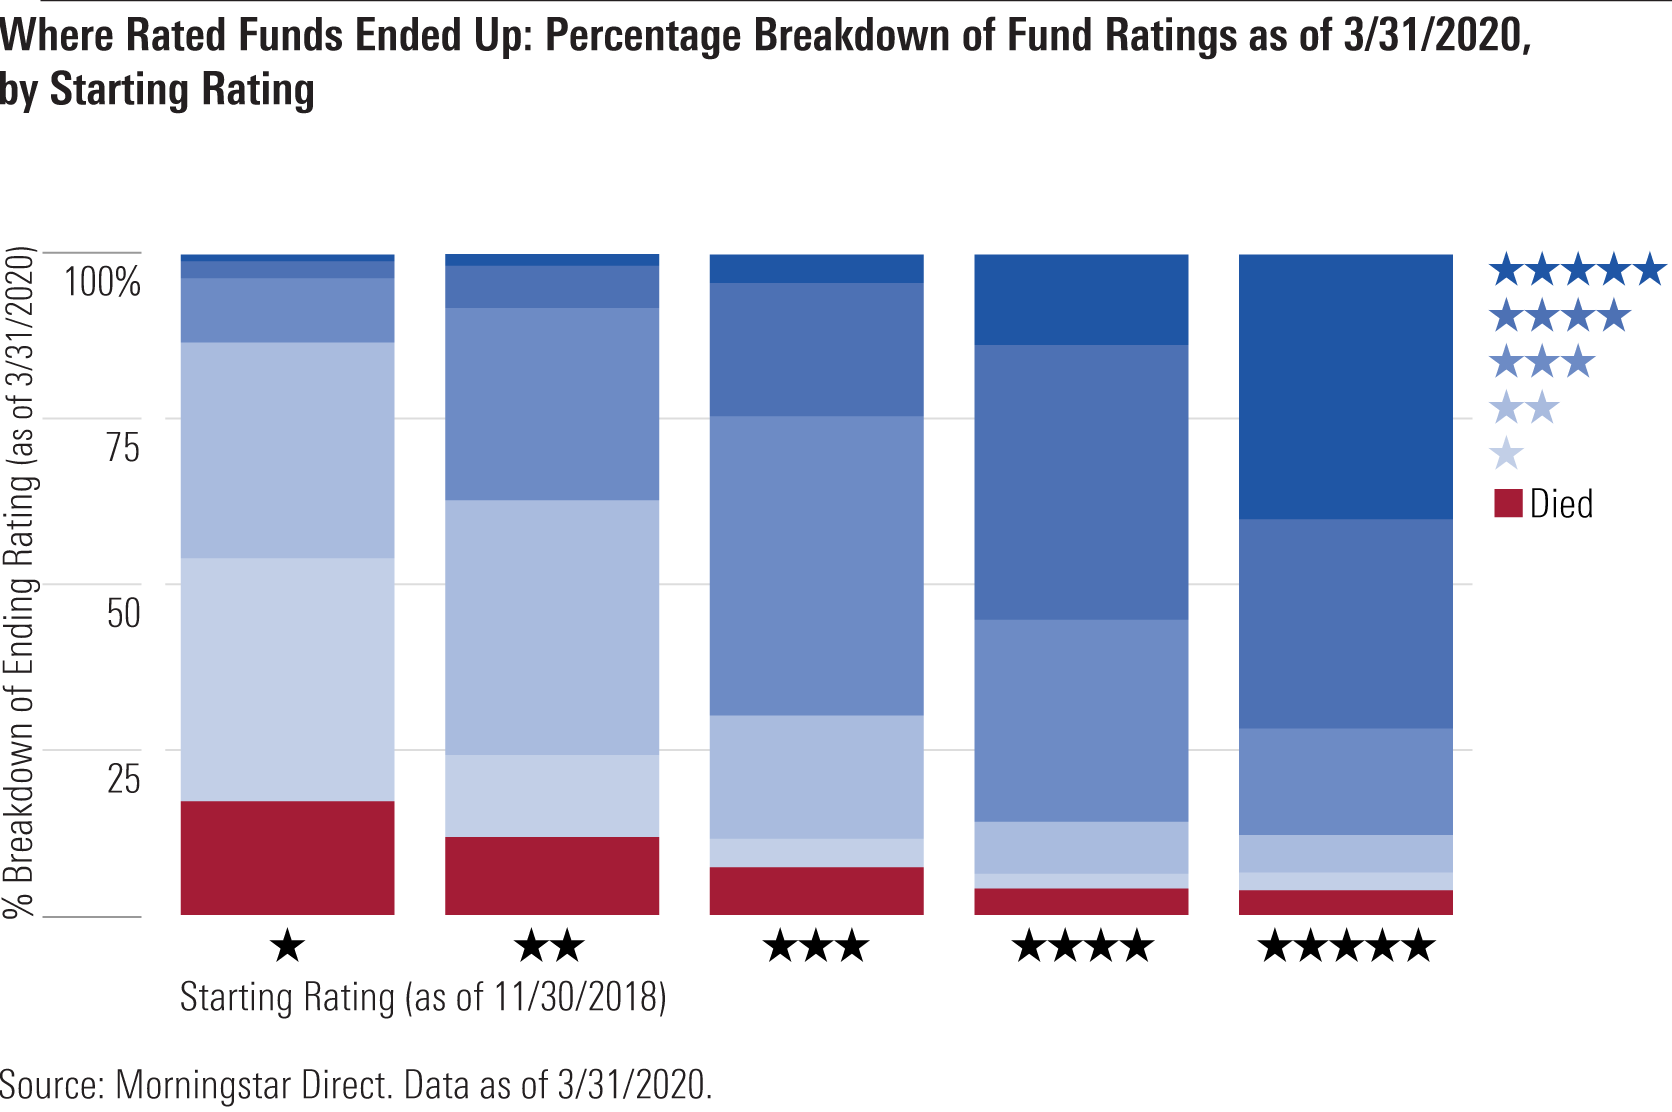
(Compares funds' "overall" star rating as of Nov. 30, 2018, and March 31, 2020; includes all unique funds with ratings as of Nov. 30, 2018, including funds that were subsequently merged or liquidated; for multi-share-class funds with two or more unique ratings across the share class range, we included one representative share class for each rating.)
We find that funds rated 4- or 5-stars as of Nov. 30, 2018 were nearly 9 times as likely to remain 4- or 5-star funds by March 31, 2020, than funds rated 1- or 2-stars. Conversely, funds rated 1- or 2-stars as of Nov. 30, 2018, were more than 5 times likelier to remain 1- or 2-star funds by March 31, 2020--or to be merged or liquidated away before then--than funds rated 4- or 5-stars.
Star Ratings and Fees We also examined the extent to which fee differences contributed to the star rating's success in sorting funds during the rally, sell-off, and full period. While it's true the star rating doesn't turn on funds' fees, it enters the equation insofar as the rating compares funds based on their risk-adjusted returns after subtracting expenses.
To examine this relationship, we ranked all star-rated funds versus their category peers based on their annual report expense ratios at the time. (For the rally period, it was the 2018 annual report expense ratio; for the sell-off, the 2019 expense ratio; for the full period, the 2018 expense ratio.) We then assigned those funds "Expense Rankings" based on their expense ratios using the same scheme we use for the star rating, as shown below.
We tallied the number of funds in each Expense Ranking group that had beaten their average peers during the rally, sell-off, and full periods, and compared those success rates against the success rates we'd previously calculated based on star ratings.
Here's how success rates compared between the two methods--star rating and fees (which we refer to as Expense Ranking in the charts that follow)--during the rally period. In summary, cheaper funds were more likely to beat their average peers than expensive funds.
We find a similar pattern during the sell-off period, as shown below, with cheaper funds more likely to surpass their category average than pricey funds, though to a smaller degree than during the rally.
Not surprisingly, we find that cheaper funds succeed more often than expensive funds over the full period as well.
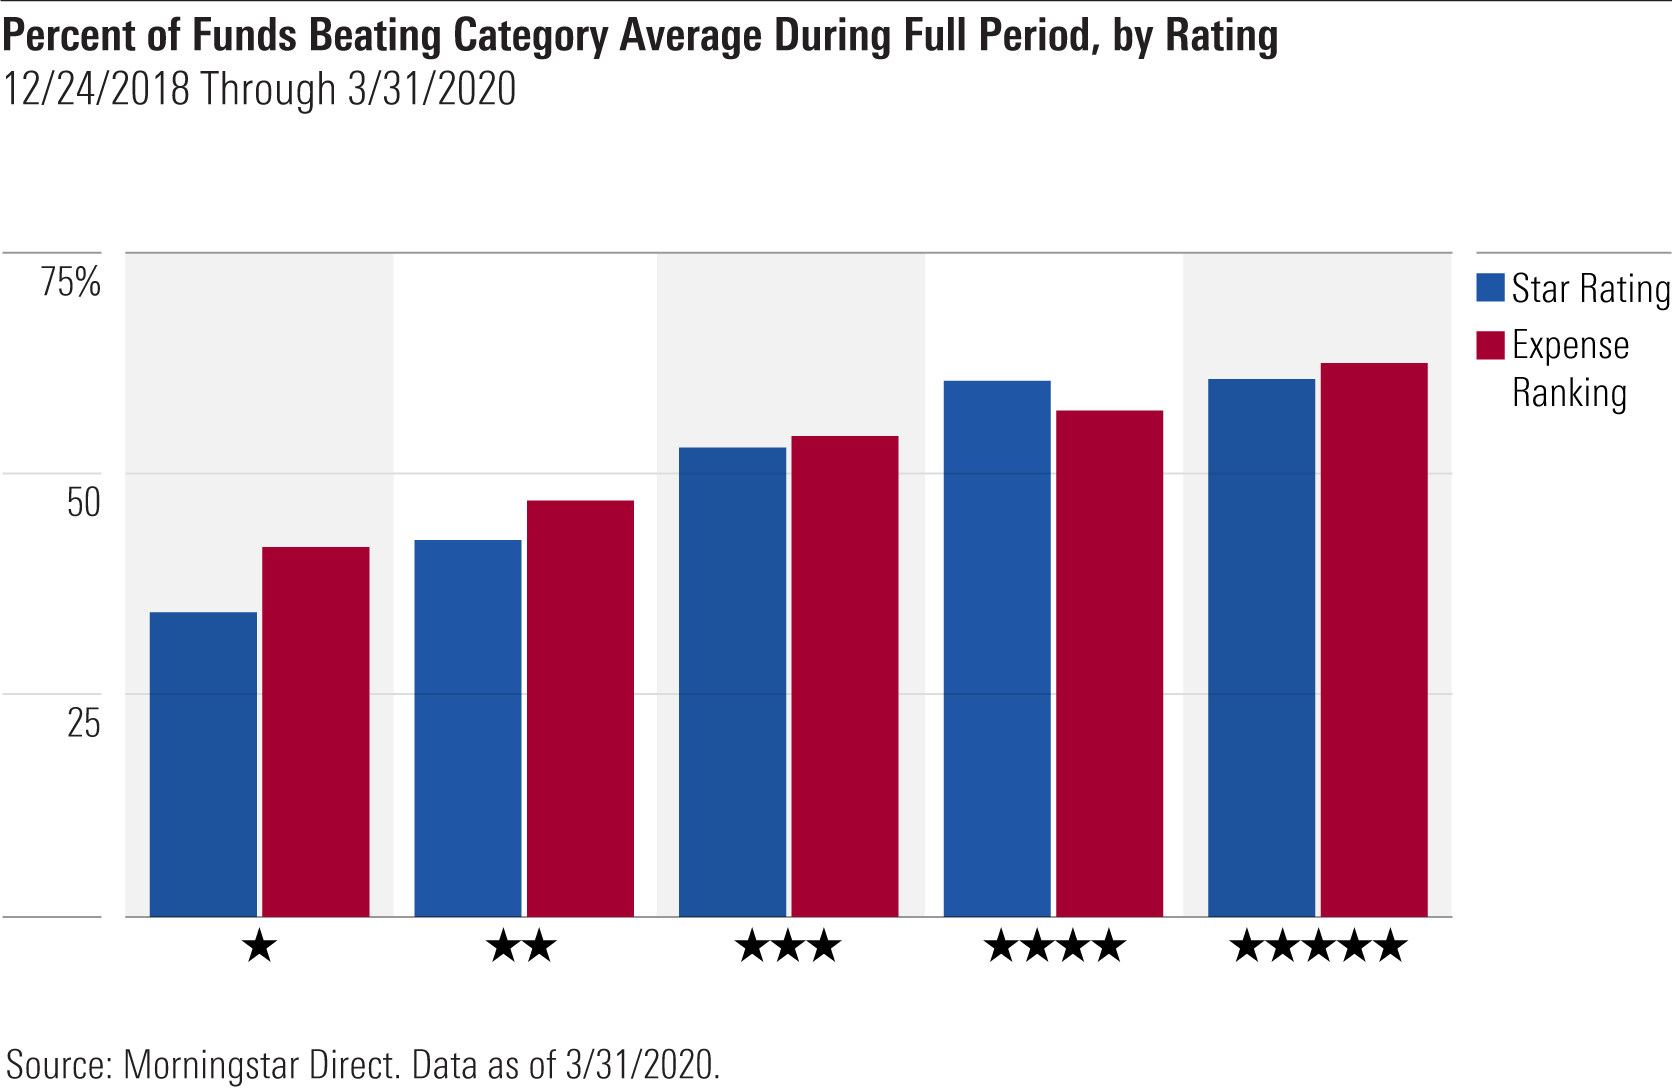
The differences weren't huge, but it does appear the star rating did a slightly better job of sorting. For example, the highest-rated 32.5% of funds under the star rating beat their average peers around 61% of the time versus 59% under the expense-ranking method over the full period. On the other hand, the lowest-rated 32.5% of funds under the star rating beat the category average only around 41% of the time compared with 45% of the time under the expense-ranking approach.
Why might there be a relationship between star ratings and fees in explaining funds' likelihood of succeeding? Funds with higher star ratings tend to be cheaper, and those with lower star ratings more expensive. To illustrate, here are the average Expense Rankings of star-rated funds (using their star ratings and Expense Rankings as of November 2018).
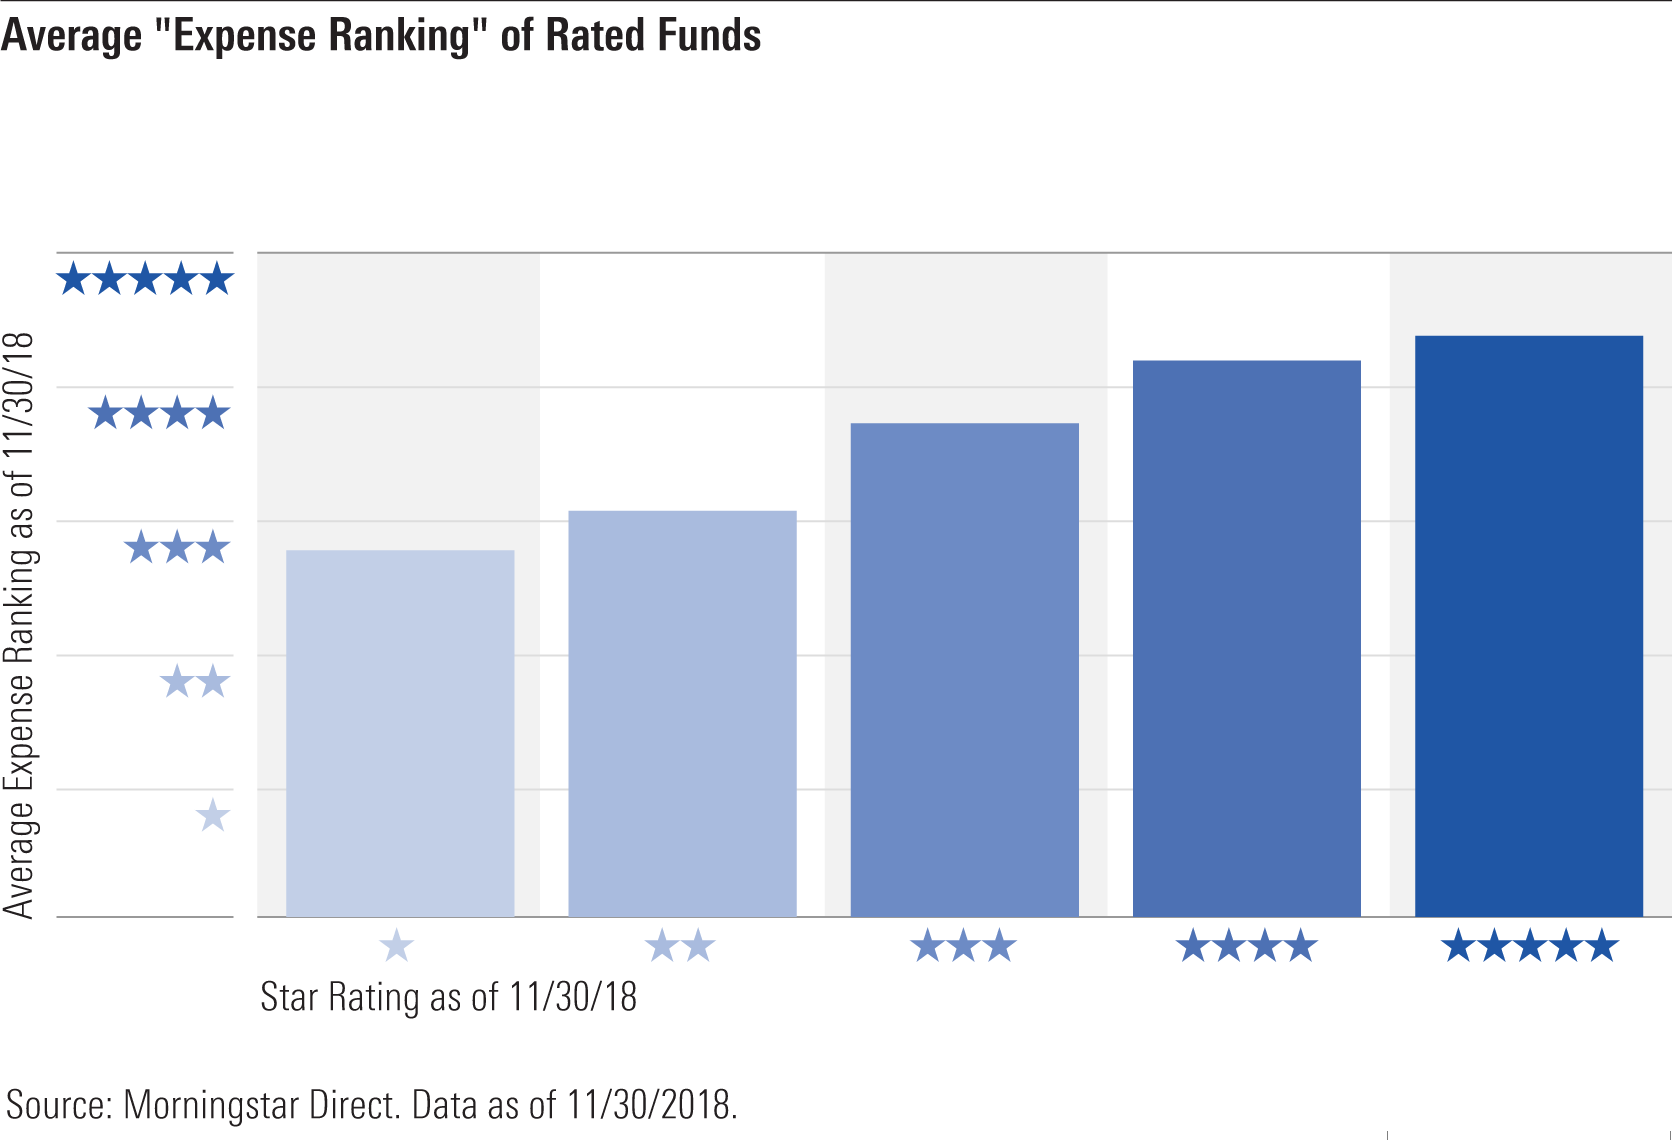
In summary, it appears the star rating points investors toward cheaper funds and away from pricier funds, and that cost difference contributed to the star rating's success in sorting funds over the periods we examined.
Longer-Term Trends We also examined how the star ratings performed over the trailing one-, three-, five-, and 10-year periods ended Jan. 31, 2020, as shown below.
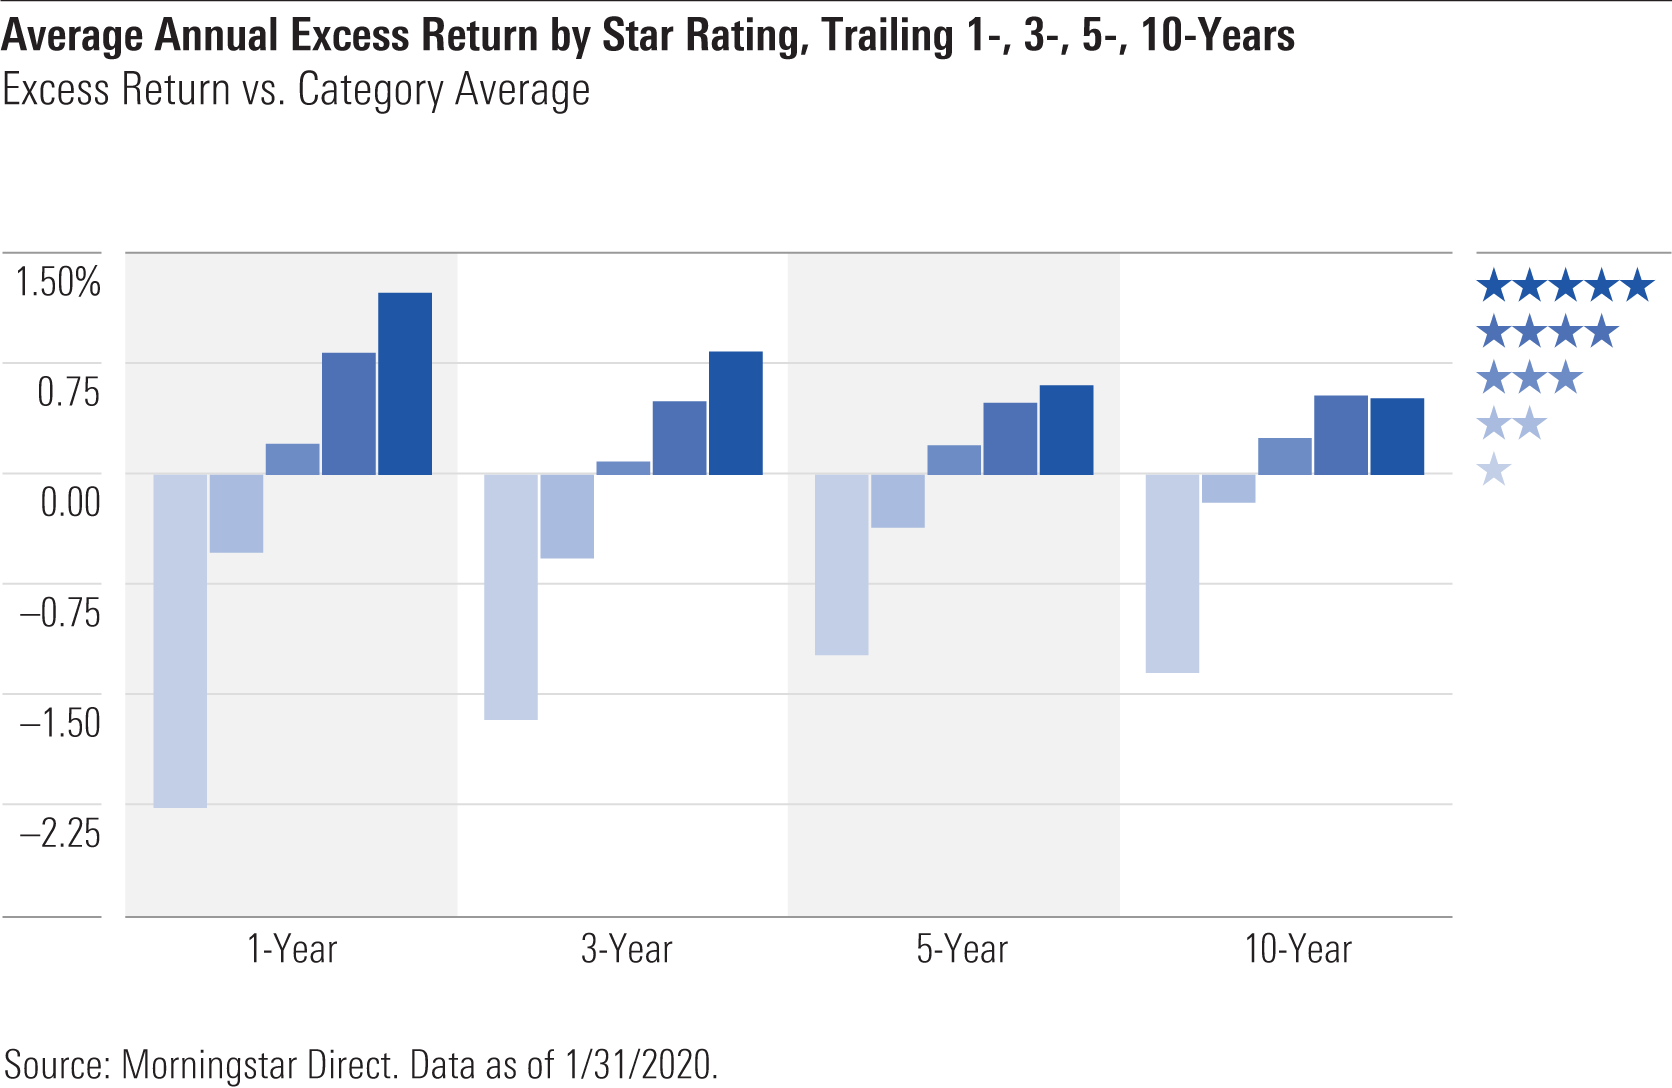
In summary, higher-rated funds outperformed their average category peers over each trailing period, while lower-rated funds underperformed the category average.
To be sure, given that the star rating ranks funds based on past risk-adjusted returns, then it argues for measuring the ratings' performance based on future risk-adjusted performance. To that end, we compiled the trailing 10-year annual returns and standard deviation for each ratings cohort.

The picture is largely the same, with higher-rated funds producing a better risk/reward trade-off than lower-rated funds over the decade ended Jan. 31, 2020.
All told, these findings suggest the star rating has been effective in sorting funds based on their future performance.
Conclusion Funds with higher star ratings have tended to outperform their average peers, while lower-rated funds have underperformed. This performance is consistent with what we'd expect of a starting point for research like the star rating. These findings suggest the star rating has been effective in tilting the odds in investors' favor, pointing them toward funds that are likelier to outperform in the future and steering them away from those likelier to lag.
Notes To analyze the star rating's performance during the sell-off, rally, and full period spanning both, we compiled the daily return data of all share classes of all rated funds that began and finished the full period. We used funds' category classification as of the month-end immediately preceding the sell-off and rally (Jan. 31, 2020, and Nov. 31, 2018, respectively) to determine which category average to compare their returns against. We assigned funds to a rating "bucket" (that is, 1-star, 2-star, 3-star, 4-star, 5-star) as of the first day of each period based on whatever the rating had been as of the month-end immediately preceding the sell-off and rally (Jan. 31, 2020, and Nov. 31, 2018). In cases where a fund had multiple share classes that had different ratings as of the start date, we assigned those share classes to the appropriate rating bucket and then averaged the excess returns of those share classes. This avoids overcounting multiple share classes when we average funds' excess returns in each ratings bucket.
To analyze the star rating's longer-term performance, we assigned each rated fund to a rating bucket (1-star, 2-star, 3-star, 4-star, 5-star) based on its rating each month. We did this for all rated funds for all months from February 2010 through January 2020. We equal-weighted the funds in each ratings bucket for a given month. Then we calculated each fund's excess return versus the peer group it was assigned to that month and averaged those excess returns to arrive at an average excess return for that bucket in that month. We repeated this for each bucket and all months, then compounded the average monthly excess returns of each bucket to form annual return series. Because each monthly snapshot contains all funds that existed as of that month-end, including those funds that have since been merged or liquidated away, it mitigates survivorship bias.
Appendix Drilling down to asset classes, we find the star rating was generally effective in pointing investors toward higher-performing funds and away from underperformers during the rally, as shown in the table below.
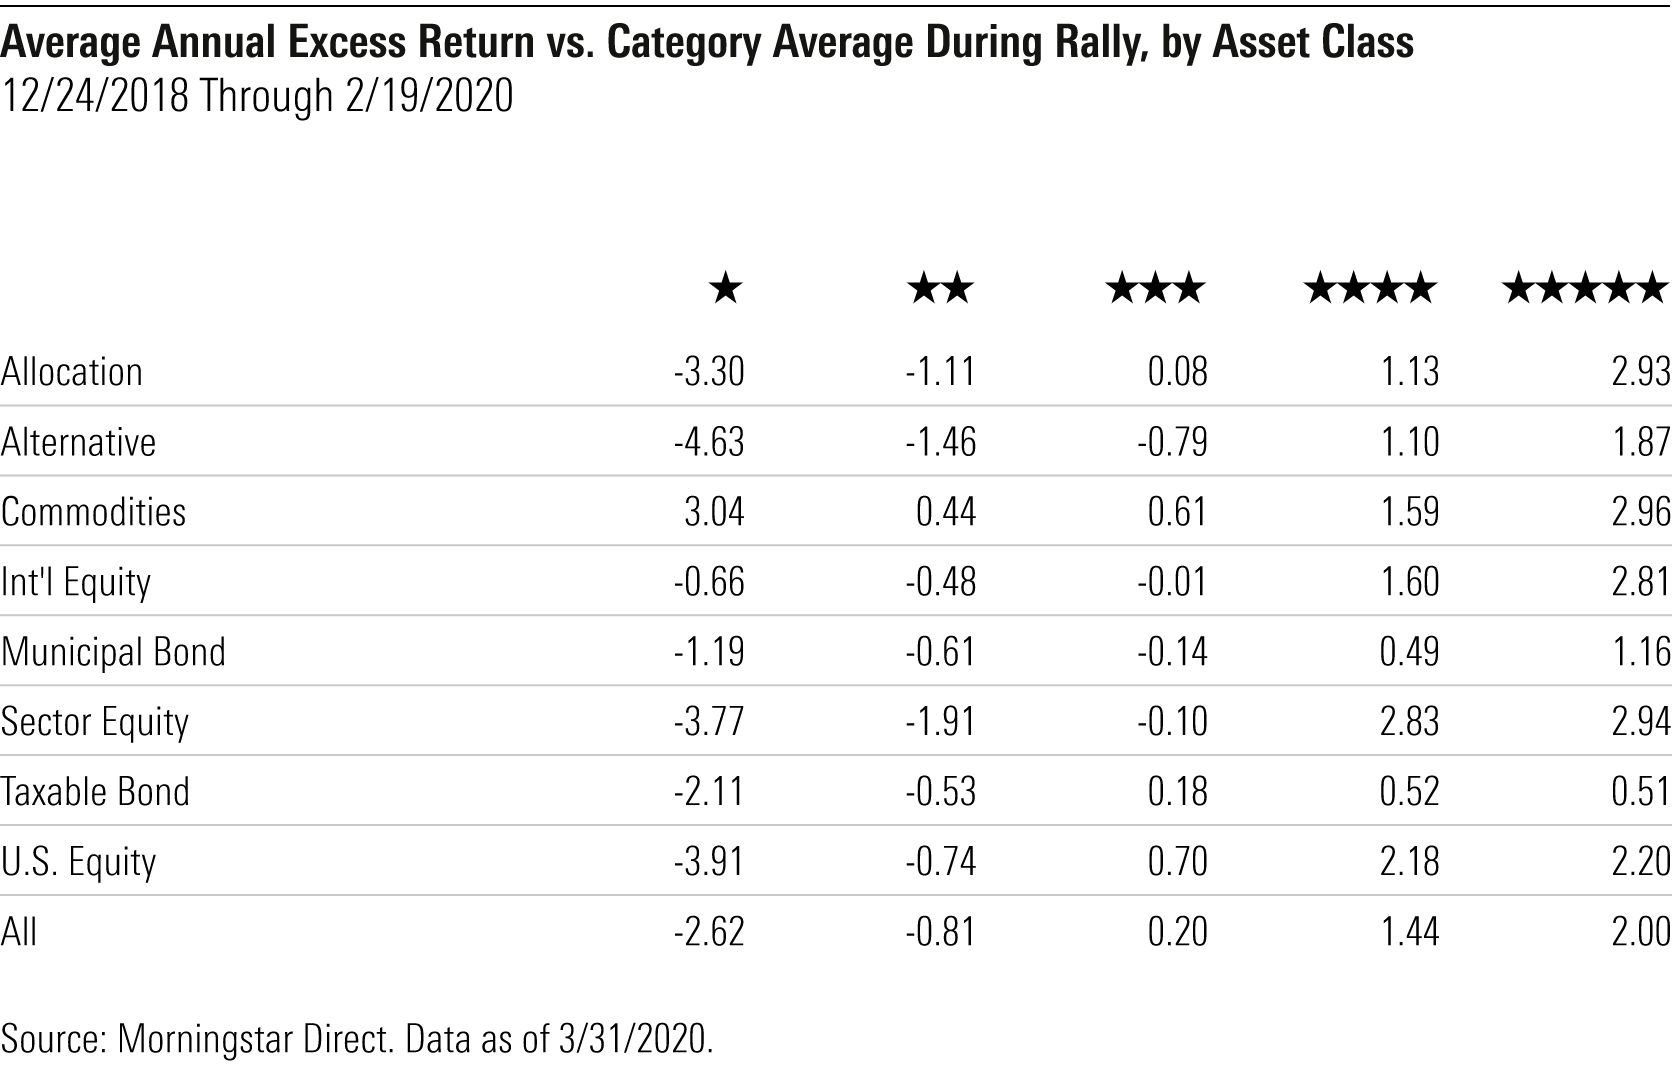
(Average annual excess returns versus category average; Dec. 24, 2018-Feb. 19, 2020)
The star rating's performance was a bit more mixed when we looked at the sell-off. As shown below, the rating tended to sort equity funds well, with higher-rated funds outperforming, and lower-rated funds underperforming, on average. But it was spottier when it came to fixed-income and allocation funds, reflecting the reversal of fortune some formerly strong performers experienced.
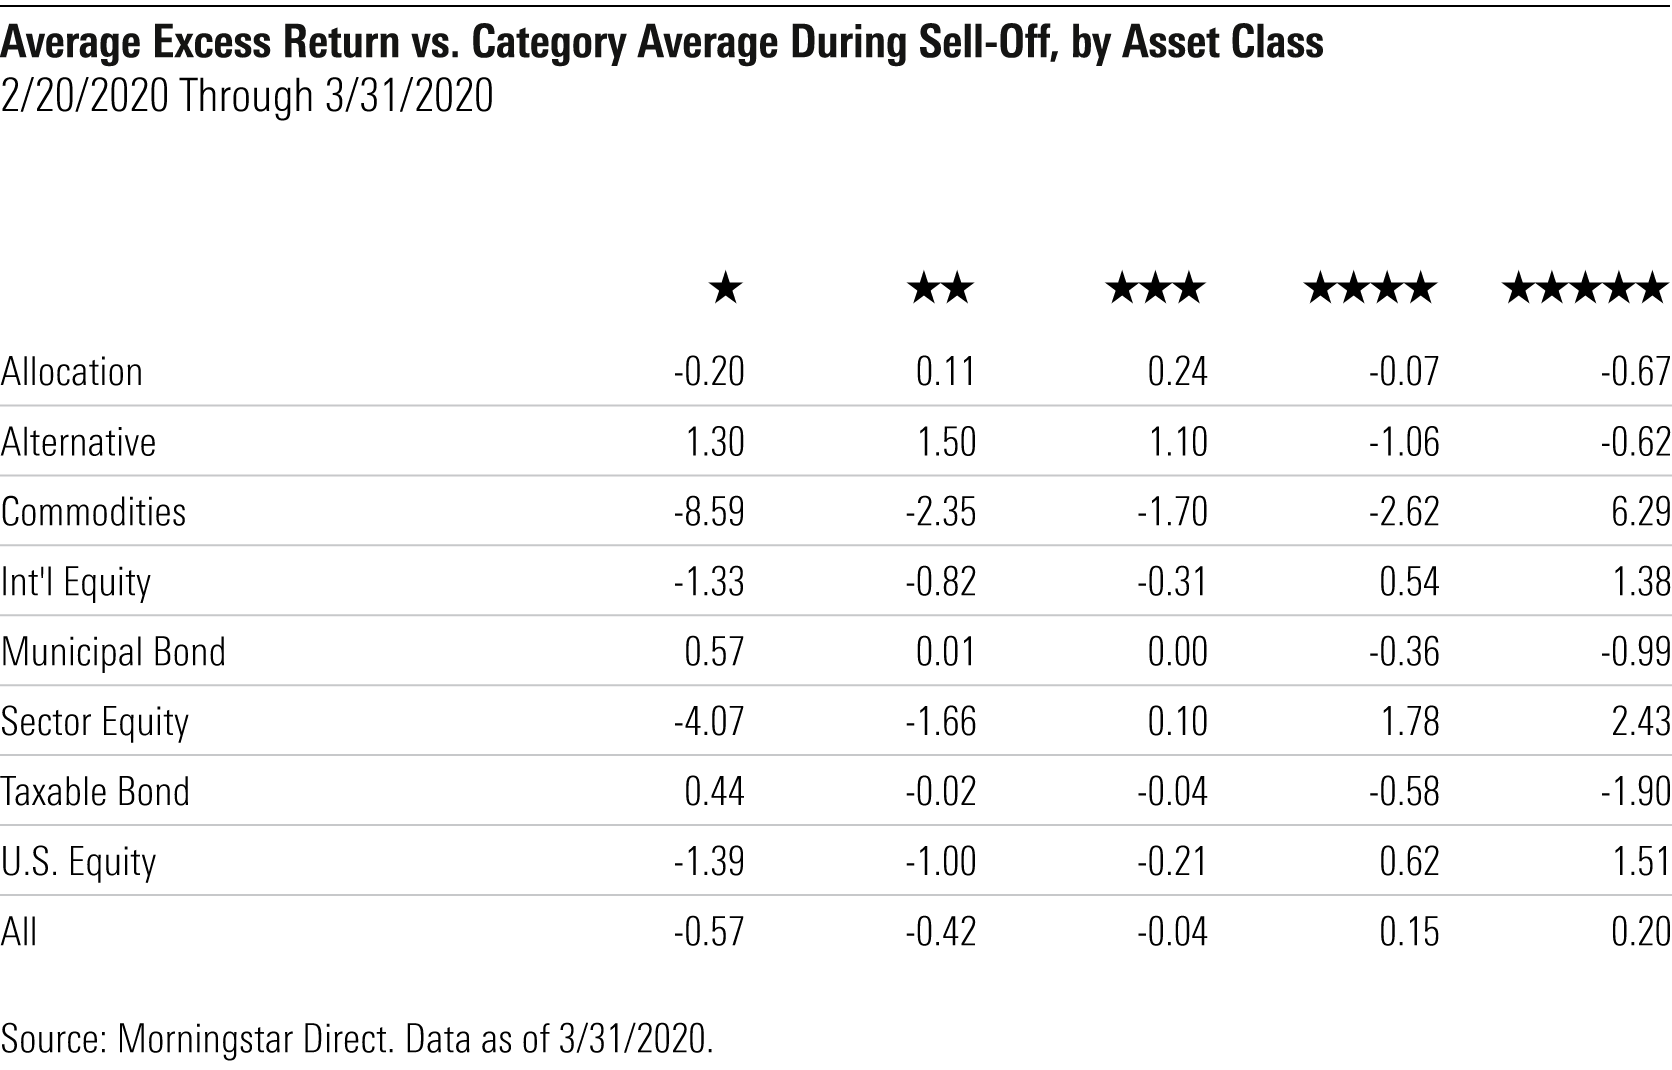
(Average annual excess returns vs. category average; Feb. 20, 2020 – March 31, 2020)
Over the full period, we find that higher-rated funds outperformed their category averages and lower-rated funds underperformed across virtually all asset classes, as shown below.
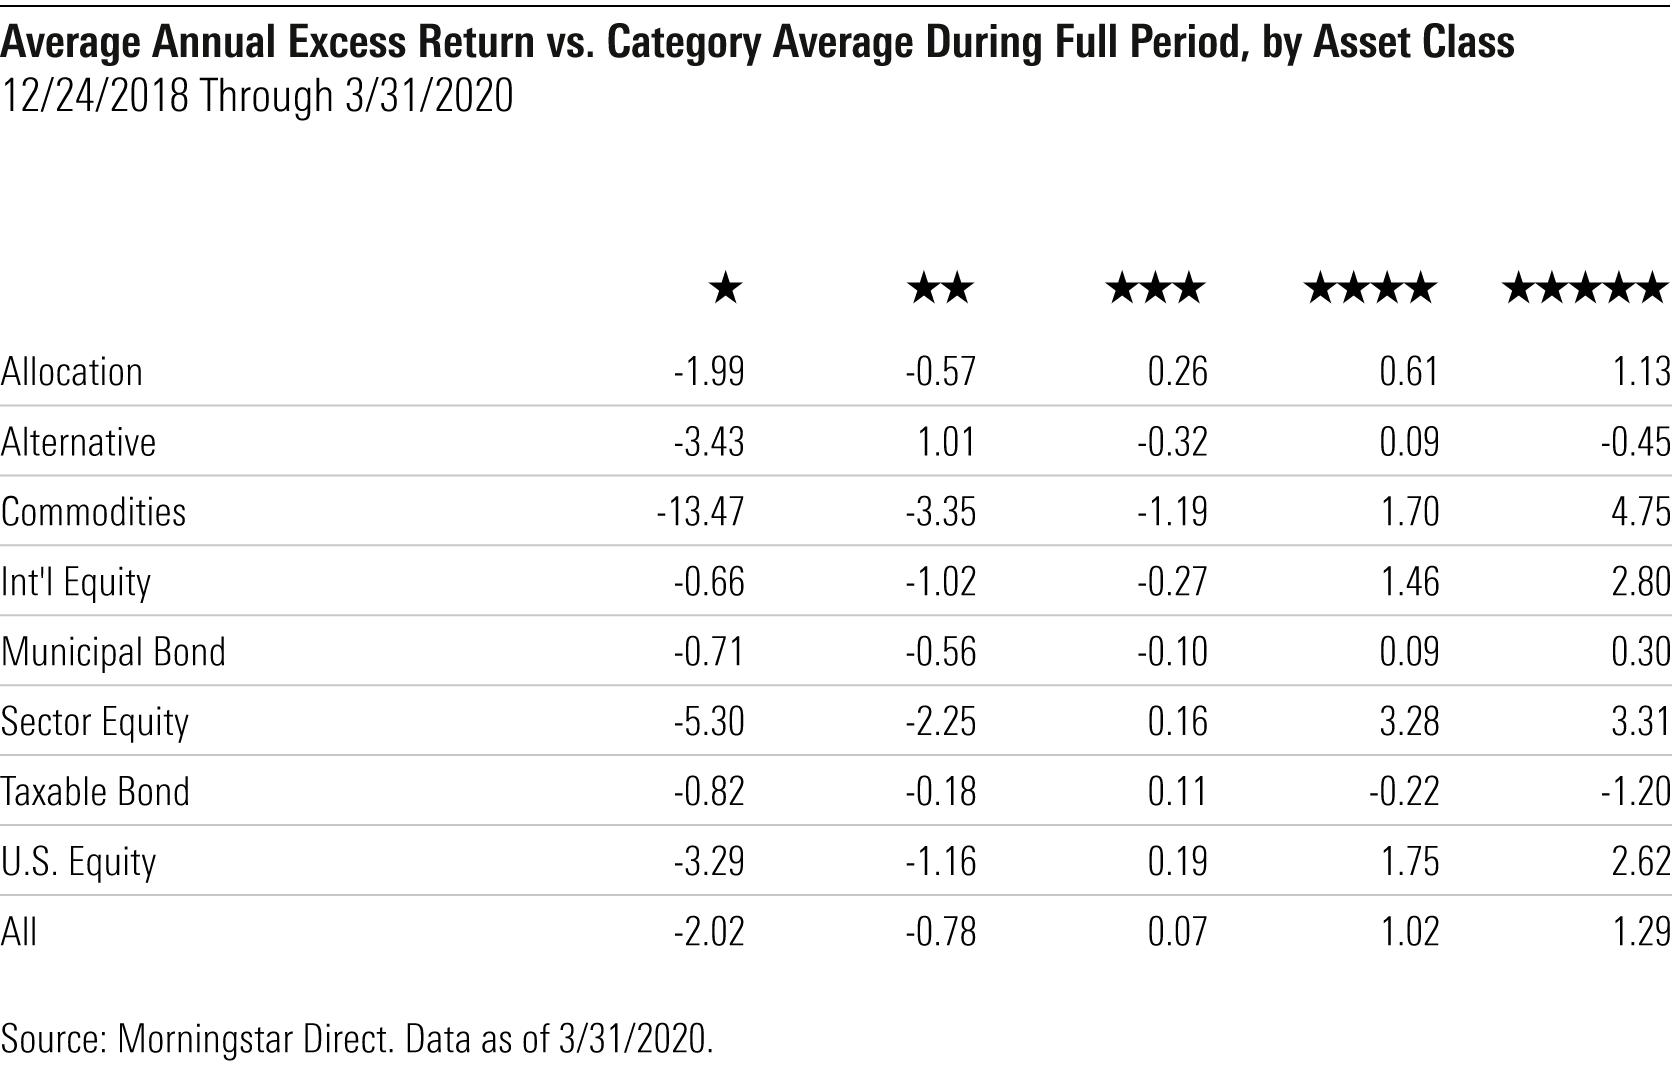
(Average annual excess returns versus category average; Dec. 24, 2018-March 31, 2020)
/cloudfront-us-east-1.images.arcpublishing.com/morningstar/ZKOY2ZAHLJVJJMCLXHIVFME56M.jpg)
/cloudfront-us-east-1.images.arcpublishing.com/morningstar/IGTBIPRO7NEEVJCDNBPNUYEKEY.png)
/cloudfront-us-east-1.images.arcpublishing.com/morningstar/HDPMMDGUA5CUHI254MRUHYEFWU.png)
:quality(80)/s3.amazonaws.com/arc-authors/morningstar/550ce300-3ec1-4055-a24a-ba3a0b7abbdf.png)