
The Highest-Quality U.S. Companies Have Weathered the Storm Best
Checking in on stocks using Morningstar indexes.
/s3.amazonaws.com/arc-authors/morningstar/033528a9-55cc-40aa-90a9-8d2d98697cf5.jpg)
Editor’s note: Read the latest on how the coronavirus is rattling the markets and what investors can do to navigate it.
Equities have been thoroughly pummeled during the coronavirus crisis that has shaken the markets for the past month. The Morningstar U.S. Market Index, which covers 97% of the stock market’s value, fell 32.7% from Feb. 20 through March 20, 2020. Ouch.
But some stocks have fared better than others. The shares of the highest-quality companies, as defined by Morningstar Equity Research, have lost less than the broad U.S. stock market and considerably less than low-quality stocks. This can be seen through the performance of the three Morningstar indexes composed of U.S. stocks at various levels of economic moat. Wide-moat stocks have the strongest competitive advantage and no moats, the least. Essentially, the moat designations can be seen as a forward-looking definition of quality.
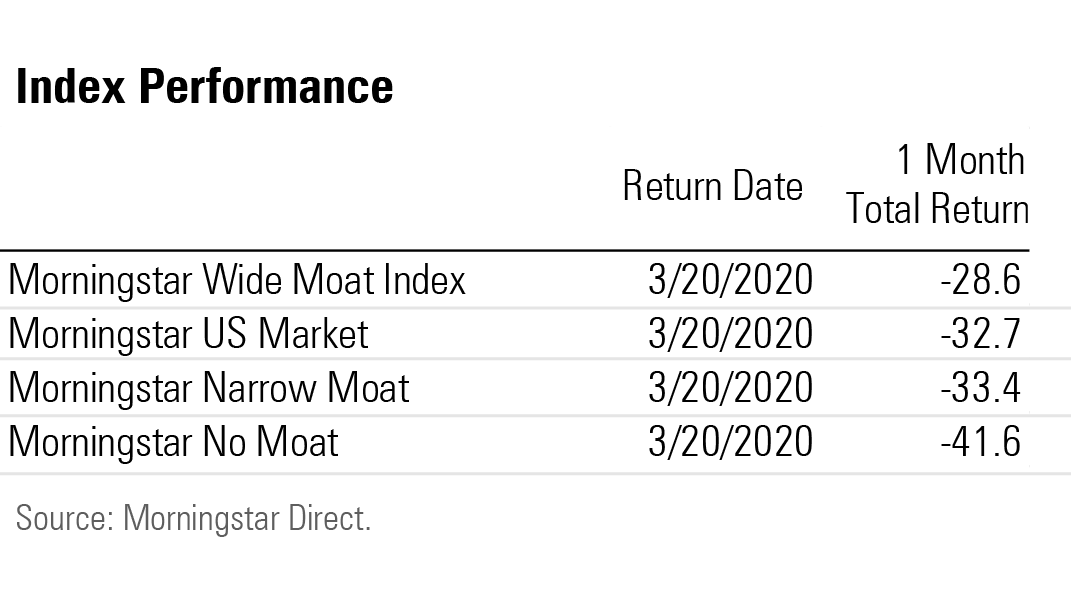
While a 28.6% decline for the 135-stock Morningstar Wide Moat Index is painful, it’s better than the broad market’s 32.7% loss. And it beats the 199-stock Morningstar No Moat Index’s performance by substantial margin. The 332-stock Morningstar Narrow Moat Index is roughly in line with the market and may improve in relative terms as time goes on.
Is This Really Just a Sector Story? Through the pandemic-driven market turmoil, different sectors of the market have produced vastly different returns as measured by Morningstar's U.S. Sector Indexes below. Plummeting oil prices have decimated energy stocks; falling interest rates have hit many financial-services businesses; and fears of an economic downturn have dented consumer cyclicals and industrials. On the positive side, consumer defensives have benefited from shoppers hoarding staples. Healthcare has held up relatively well for obvious reasons.
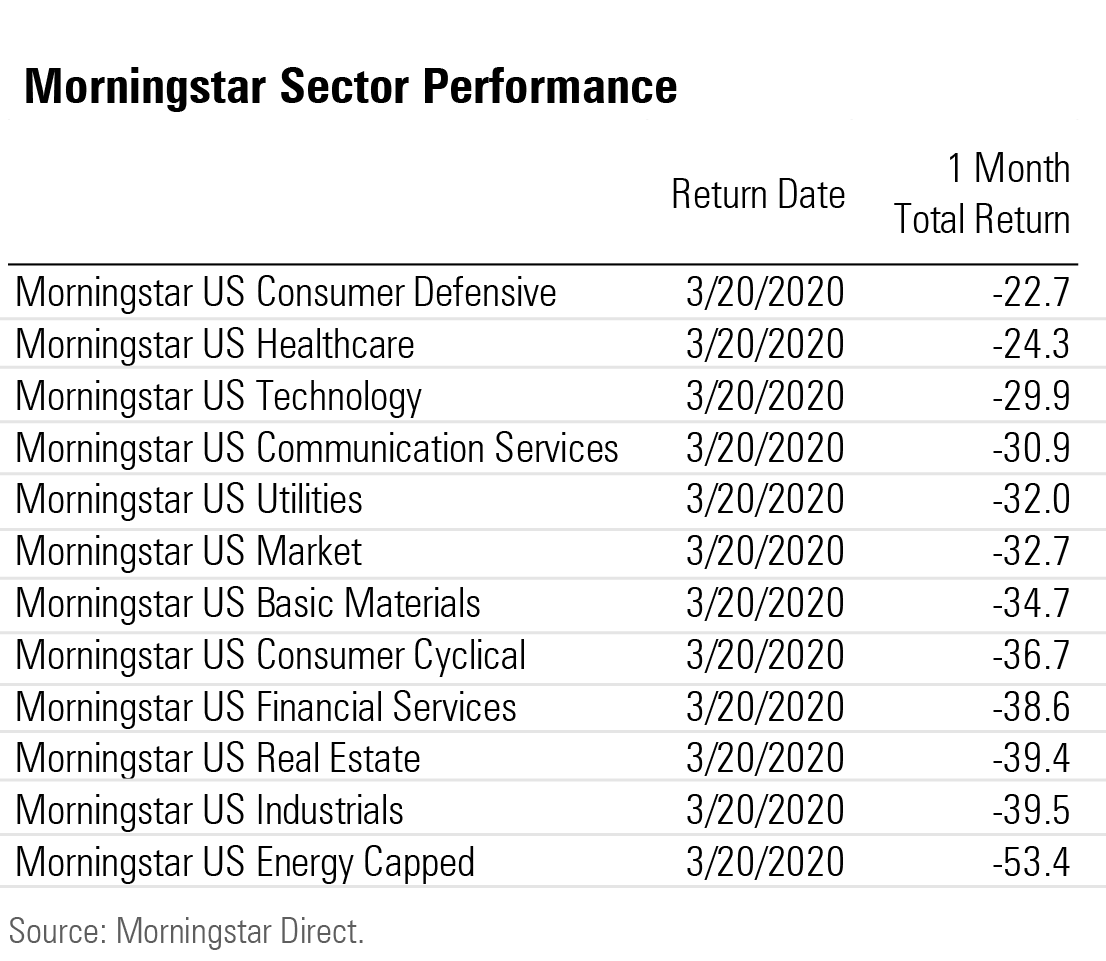
Moats, for their part, are not distributed evenly. At first glance, some of the indexes’ sector biases seem to explain their divergence. The Wide Moat Index has above-market exposure to consumer defensive and telecom, and is underweight energy, basic materials, and real estate, where competitive advantages are rarer. Conversely, the No Moat Index is overweight energy, materials, and real estate and has a significant underweight to healthcare.
It's a Stock Story But for all three indexes, performance relative to the market can be explained more by individual stock positions than sector exposures. Performance attribution shows the Wide Moat Index's returns buoyed by strong relative performers like Gilead Sciences GILD (9.7%), Clorox CLX (7.6%), Domino's Pizza DPZ (1.21%), and Campbell Soup CPB (negative 5.2%). It also benefited from above-market exposure to resilient stocks like Amazon.com AMZN (negative 14%), Johnson & Johnson JNJ (negative 19%), and Procter & Gamble PG (negative 18.3%).
The No Moat Index was hurt by its above-market exposure to the plummeting shares of Tesla TSLA (negative 54.4%), Occidental Petroleum OXY (negative 74.4%), PNC Financial Services PNC (negative 41.6%), Delta Airlines DAL (negative 63.5%), and GM GM (negative 47.4%).
The Narrow Moat Index was truly a mixed bag, with relative winners like Regeneron Pharmaceuticals REGN (9.4%) and General Mills GIS (0.2%), Verizon VZ (negative 11%), and Netflix NFLX (negative 13.8%) offset by heavy exposure to companies like Exxon XOM (negative 45.7%) and Chevron CVX (negative 46.4%). Mostly, though, the Narrow Moat Index missed out by not holding some of the mega-cap stalwarts that helped the Wide Moat Index weather the storm.
Mirroring a Long-term Performance Pattern The divergence between stocks of different quality bands over the past month is following a historical pattern where the highest-quality stocks preserved their capital better than the market during a downturn.
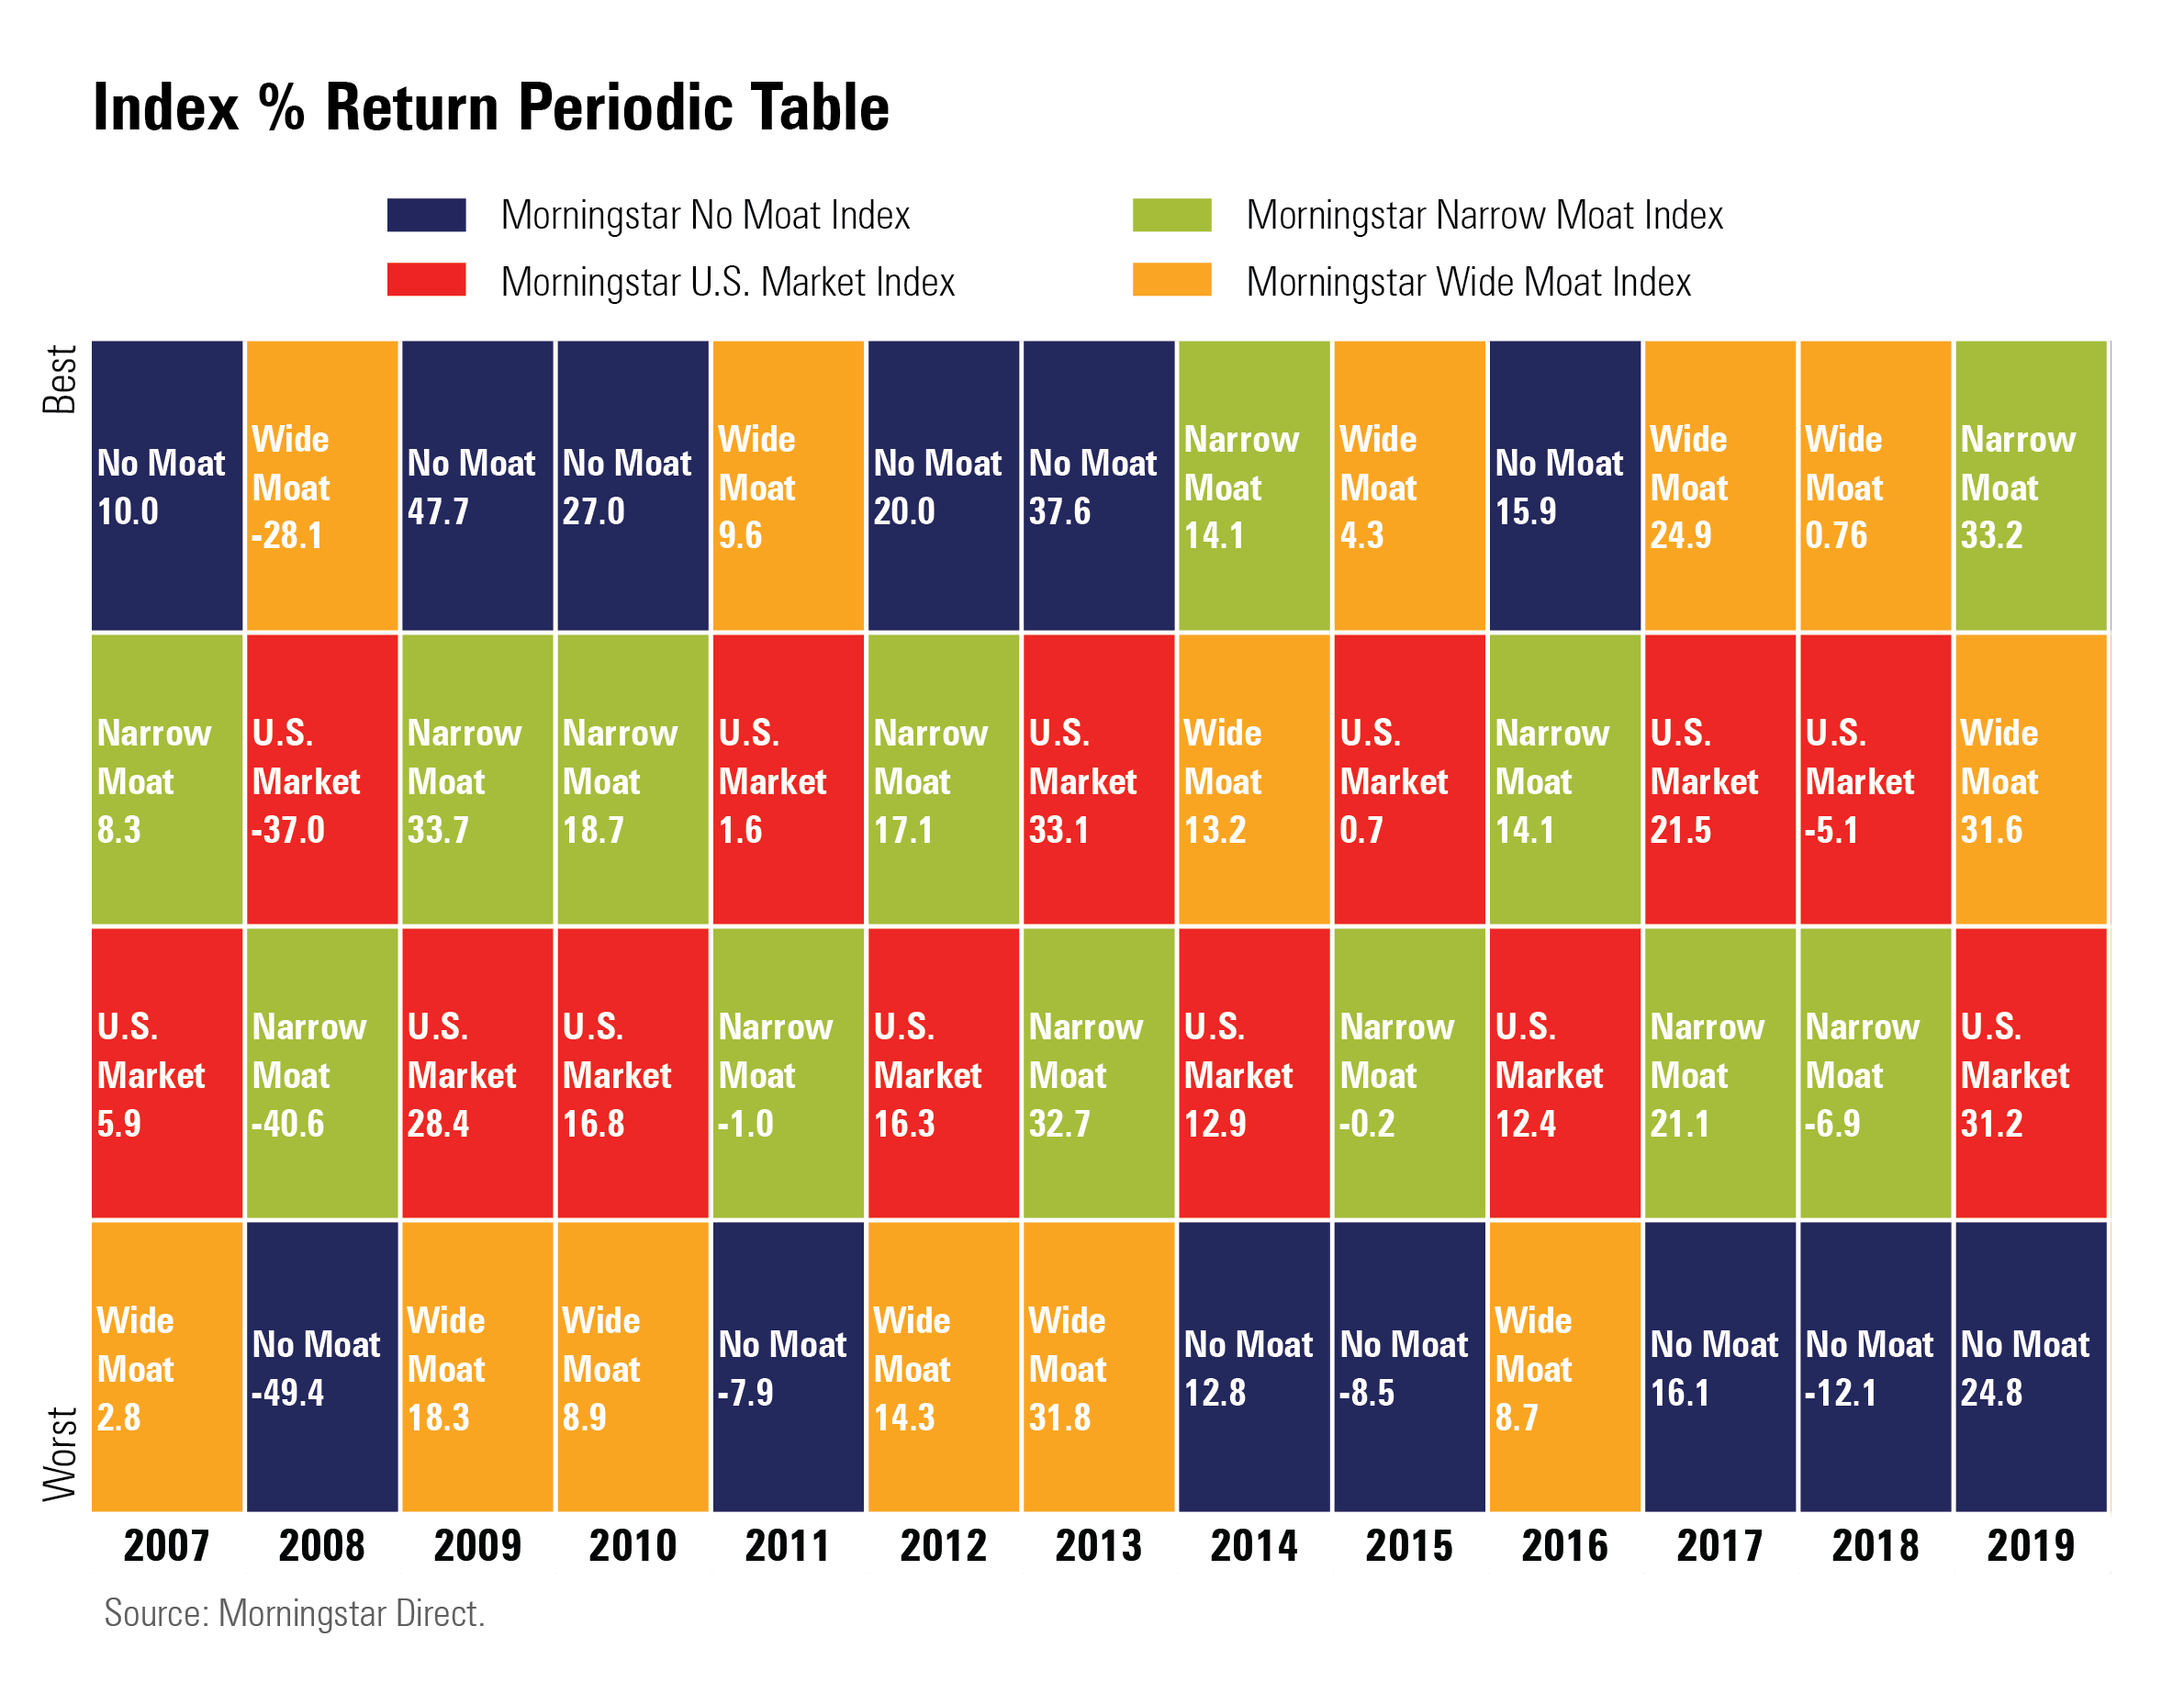
In difficult years for the U.S equity market, the Wide Moat Index has proved the most resilient. The trend was most pronounced in 2008, when wide-moat stocks lost 28.2%—painful in absolute terms, but a far cry from the near-50% loss sustained by the No Moat Index. In the sovereign debt crisis of 2011, and the difficult years of 2015 and the 2018, wide-moat stocks held up best.
On the flip side, in big up years for the market, the rising tide lifted No Moat stocks highest. This was the case in 2007, 2009-10, 2012-13, and 2016.
Of course, there are exceptions. In the bull markets of 2017 and 2019, no moat stocks underperformed the markets while wide moats outperformed.
If there is a silver lining to the coronavirus bear market for long-term investors, it’s that it has left many wide-moat stocks trading at attractive valuations.
Disclosure: Morningstar, Inc. licenses indexes to financial institutions as the tracking indexes for investable products, such as exchange-traded funds, sponsored by the financial institution. The license fee for such use is paid by the sponsoring financial institution based mainly on the total assets of the investable product. Please click here for a list of investable products that track or have tracked a Morningstar index. Neither Morningstar, Inc. nor its investment management division markets, sells, or makes any representations regarding the advisability of investing in any investable product that tracks a Morningstar index.
Morningstar, Inc. licenses indexes to financial institutions as the tracking indexes for investable products, such as exchange-traded funds, sponsored by the financial institution. The license fee for such use is paid by the sponsoring financial institution based mainly on the total assets of the investable product. A list of investable products that track or have tracked a Morningstar index is available on the resources tab at indexes.morningstar.com. Morningstar, Inc. does not market, sell, or make any representations regarding the advisability of investing in any investable product that tracks a Morningstar index.
/cloudfront-us-east-1.images.arcpublishing.com/morningstar/ROHC7ZXJXZU7LIKGTTYJTD667I.png)
/cloudfront-us-east-1.images.arcpublishing.com/morningstar/TP6GAISC4JE65KVOI3YEE34HGU.jpg)
/cloudfront-us-east-1.images.arcpublishing.com/morningstar/RFJBWBYYTARXBNOTU6VL4VSE4Q.png)
:quality(80)/s3.amazonaws.com/arc-authors/morningstar/033528a9-55cc-40aa-90a9-8d2d98697cf5.jpg)