
March U.S. Fund Flows--An Exodus From Bonds, but Only a Moderate Reaction So Far in Stocks
How did coronavirus affect recent flows?
/s3.amazonaws.com/arc-authors/morningstar/e3601478-840b-4f9a-ab6f-261f14c3ddd5.jpg)
Editor’s note: Read the latest on how the coronavirus is rattling the markets and what investors can do to navigate it.
This article originally appeared in Morningstar Direct Cloud and Morningstar Office Cloud.
Individual investors reputedly buy high and sell low. How have they behaved during the coronavirus sell-off?
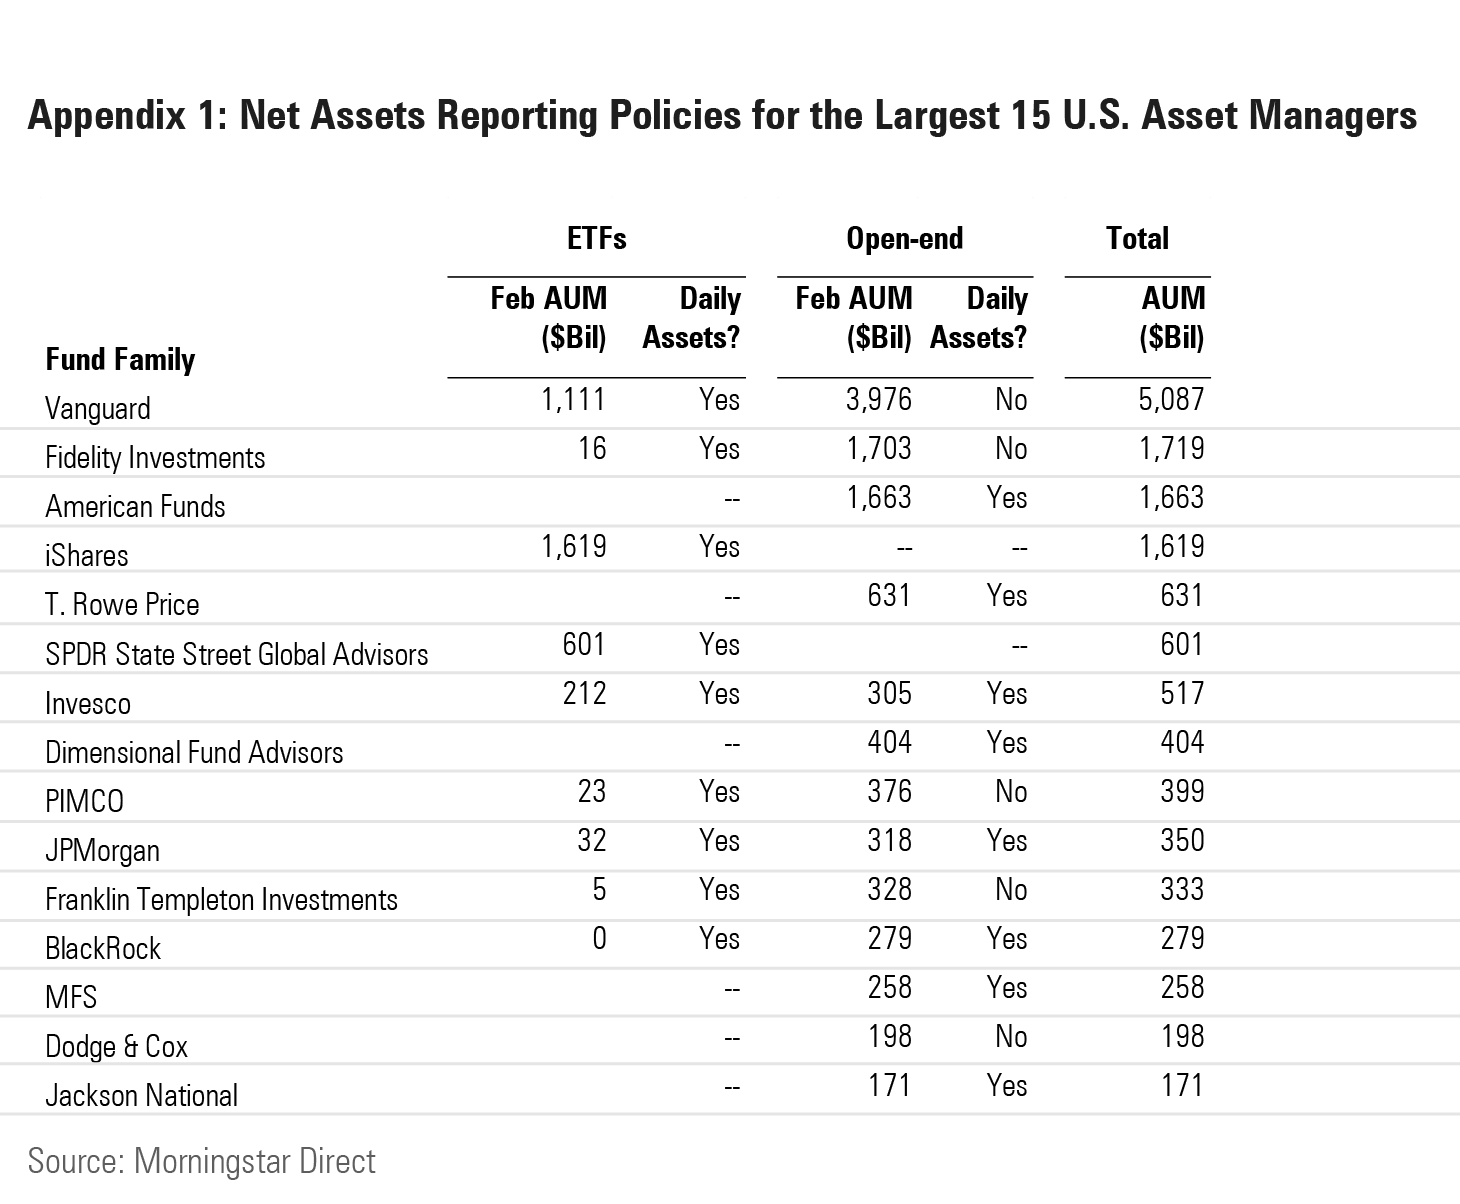
To help answer this question, we looked at month-to-date flows through Friday, March 13, for the subset of U.S. funds and exchange-traded funds that report net assets on a daily basis. Flows on Friday indicate investor decisions made through Thursday, as most providers settle on T+1 basis.
For ETFs, about 97% of the universe is covered, and 99.9% of assets under management; daily mutual fund coverage is about 55% of monthly AUM. It is worth noting that while Vanguard and Fidelity ETFs are included in the figures that follow, $4 trillion of Vanguard and $1.6 trillion of Fidelity open-end funds are not. (Vanguard and Fidelity combined account for 37% of long-term open-end fund assets.) Appendix 1 at the end of this article indicates the representativeness of the top 15 fund groups in this data set.
So, while the data that follows almost certainly indicates the direction of travel, the full extent of investor moves won’t be known until early April. (Click images for better viewing)
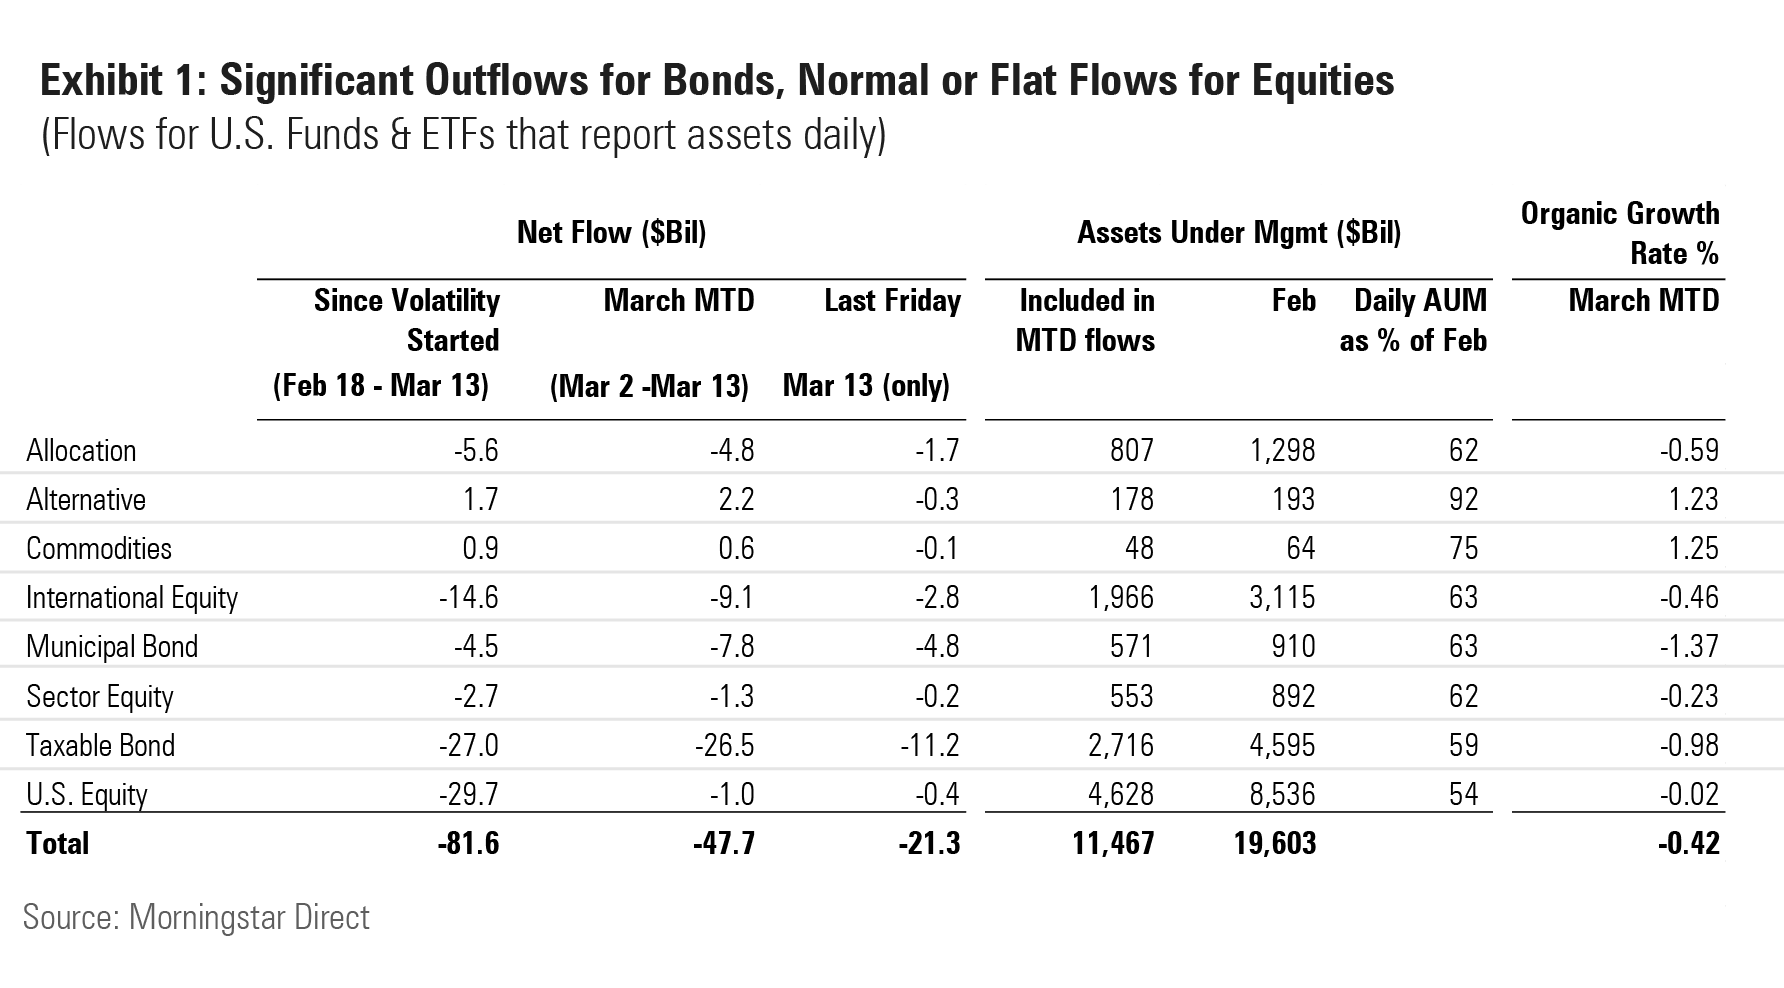
(Organic growth rate, is flows divided by beginning assets. This figure puts the level of flows into context against the size of the category being measured. Prorated to the end of March, funds are on track to have one of their worst months of outflows ever, both on a percentage and absolute basis.)
While equity investors worldwide have shed equity fund holdings (subscription required), that hasn't been the case so far for U.S. equity investors.
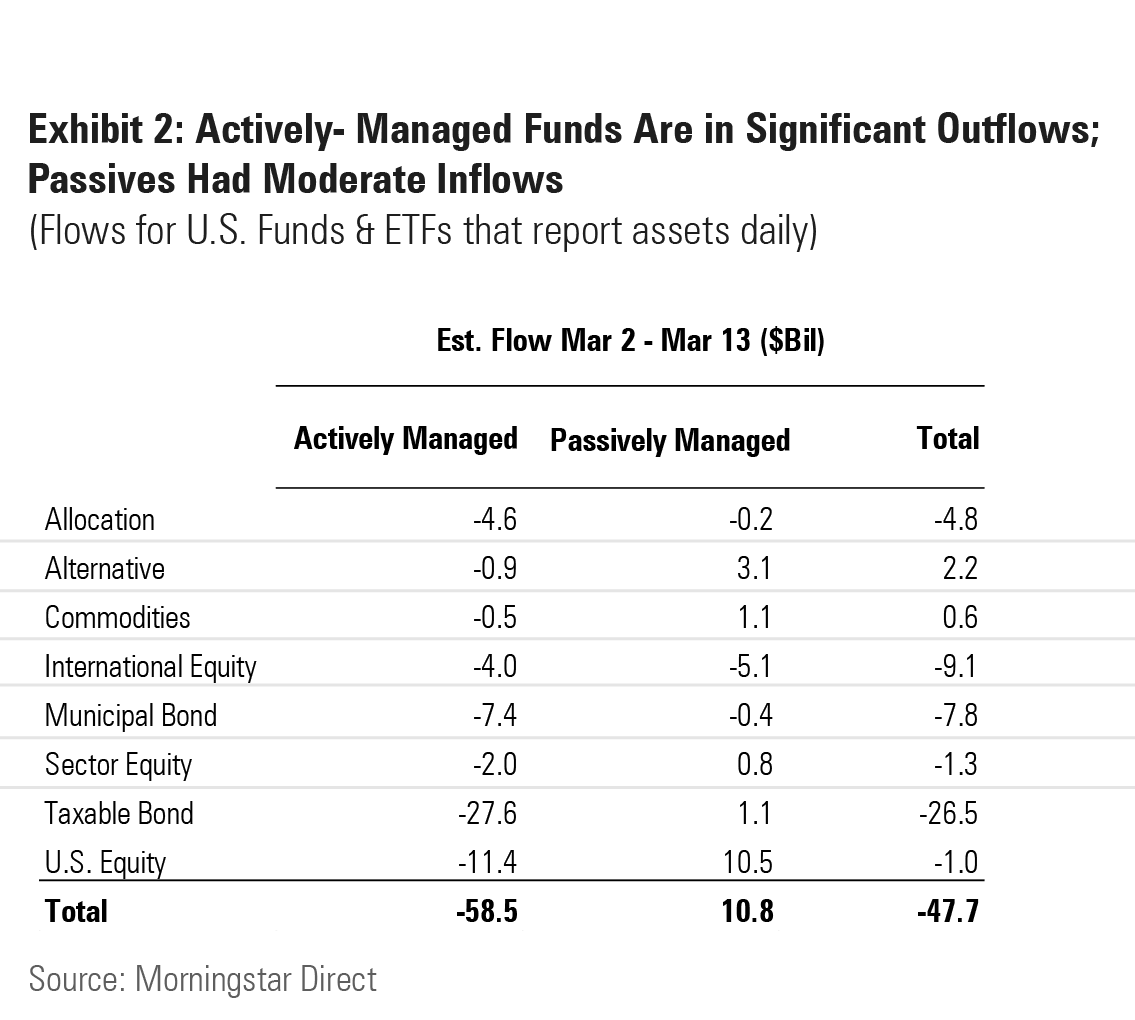
Outflows hit when volatility picked up in February, but category funds made up almost all of the lost ground in March. In fact, net flows for U.S. ETFs and funds for March are close to zero. But that’s only because passively managed U.S. equity vehicles are in net inflows, while actively managed ones are headed for significant outflows. At the current rate, though, U.S. equity outflows will not even rank in the worst 100 months since January 2007.
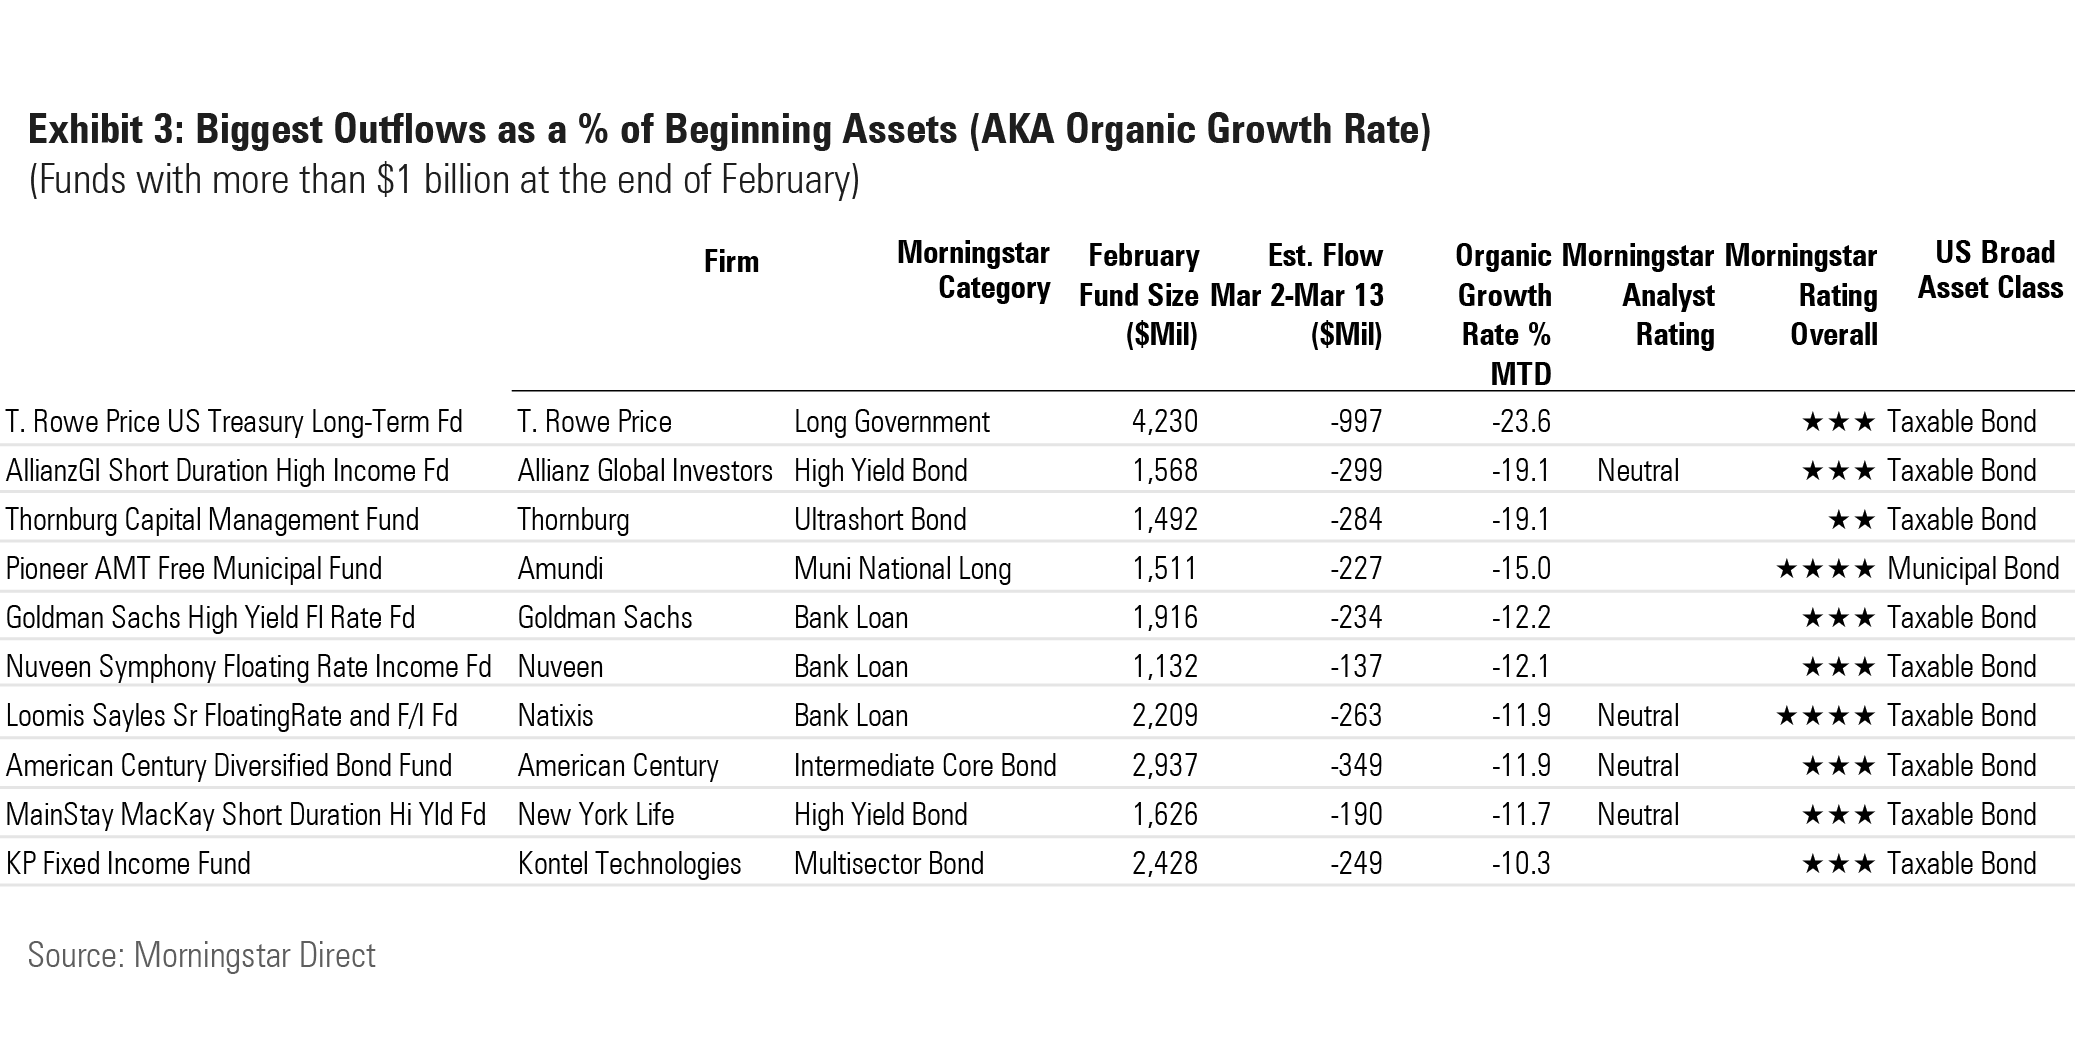
The Hurt Is On: Taxable Bonds & Municipal Bonds While collapsing interest rates boosted the value of outstanding long-term bonds, some investors seemed to have taken it as a sign that the party was finally over. All of the funds with the poorest organic growth rates come from the taxable and municipal broad category groups.
According to Morningstar's global director of fixed-income ratings, Miriam Sjoblom:
"Nervous investors are selling the funds that have gotten hit hardest. Neutral-rated Nuveen High Yield Municipal Bond NHMRX had enjoyed steady inflows and impressive performance since the end of the global financial crisis until the beginning of this month. It reached $25 billion in assets at the end of February and was more than twice as large as the second-largest fund in the muni high-yield Morningstar Category.
"Investors have been attracted to its high yield, but it’s one of the riskiest funds in the category. It’s down the most of any high-yield muni fund since March 2 (-8.8%), which exactly fits its historical profile. Many current investors were not in the fund to experience its huge loss in 2008, so its recent performance has awakened them, to say the least, to the fund’s risk."
Flows into ultrashort bond and short-government funds are unsurprising as, they are perceived as safe.
While the magnitude of flows for bond funds is significant, it’s unlikely that they’ll reach the record rates of October 2008 (the peak of the global financial crisis) and December 2018 (Treasuries bearishness that didn’t manifest itself) for taxable bonds and June 2013 (euro crisis) and December 2010 (Meredith Whitney call) for munis.
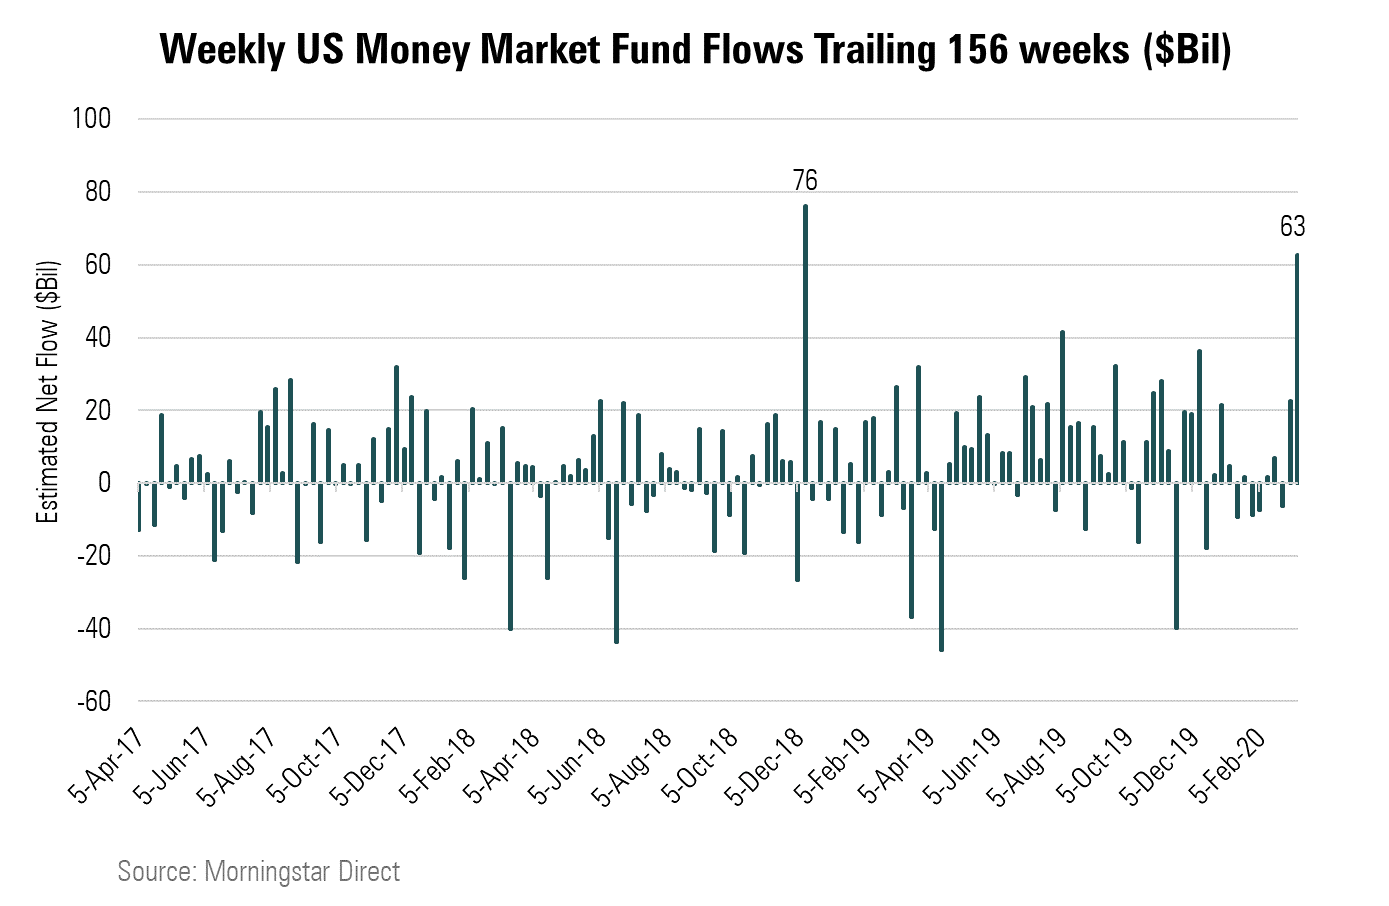
Money Market Funds In the week ended last Wednesday, U.S. money market funds had their second-highest inflows in three years, which isn't surprising, as platform stock sales are swept into money markets.
But Wait, There's More Target-date fund and model portfolio rebalancing may have contributed significantly to inflows into U.S. equity and international funds and outflows from core intermediate-term bond funds. This is a known unknown, however. Many target-date series maintain flexible policies with regard to rebalancing, so there is no systematic method for determining target-date funds' contributions from this activity.
/d10o6nnig0wrdw.cloudfront.net/04-25-2024/t_d30270f760794625a1e74b94c0d352af_name_file_960x540_1600_v4_.jpg)
/cloudfront-us-east-1.images.arcpublishing.com/morningstar/DOXM5RLEKJHX5B6OIEWSUMX6X4.png)
/cloudfront-us-east-1.images.arcpublishing.com/morningstar/ZKOY2ZAHLJVJJMCLXHIVFME56M.jpg)
:quality(80)/s3.amazonaws.com/arc-authors/morningstar/e3601478-840b-4f9a-ab6f-261f14c3ddd5.jpg)