
What's Driving U.S. Stock Fund Returns?
Style, size, and momentum were the primary factors behind these funds' returns for the past three calendar years.

For U.S. stock fund investors, the market of the past few years has been a "rising tide lifting all boats," with positive returns across most strategies. But some boats have risen much higher than others.
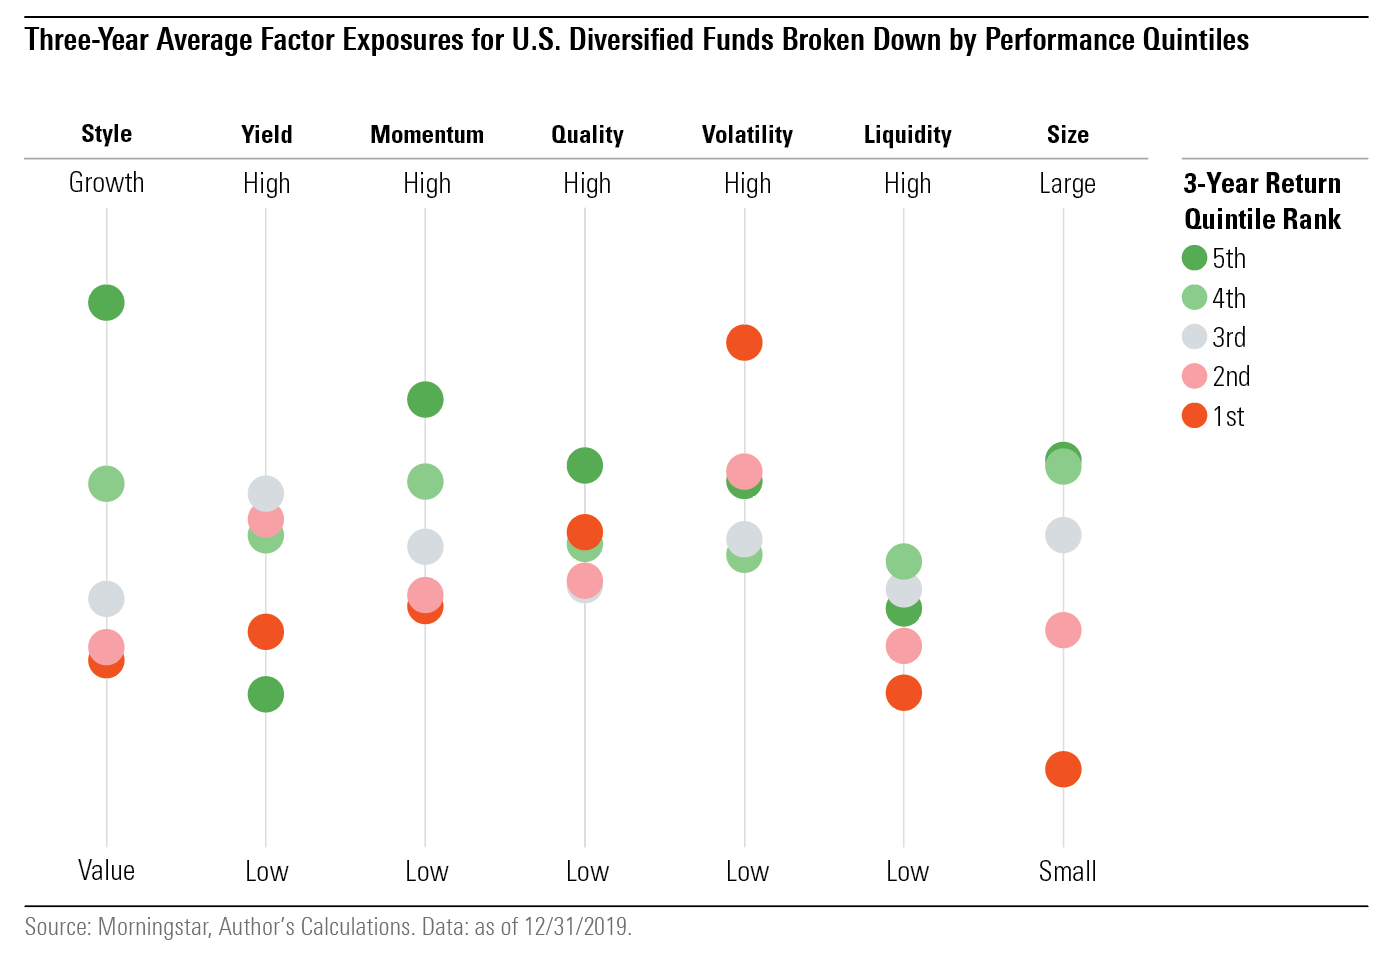
Investors can pull back the lens and see the characteristics that top- and bottom-performing funds have in common using the Morningstar Factor Profile, which measures a portfolio using seven metrics: size, style, yield, momentum, quality, volatility, and liquidity.
With this bird's-eye view, we see that three factors were the strongest drivers of returns over the three-year period ended in 2019: style, size, and momentum.
The other factors did not have as clear a performance relationship, although there were periods when they did, such as the sharp stock market sell-off in the fourth quarter of 2018, when funds not as exposed to volatility outperformed by a significant margin. Here, we will dig deeper into four of the seven factors.
Style One of the most dramatic trends within the equity fund universe over the past several years has been the significant outperformance of growth funds when compared with funds in the value buckets. Over the three-year period from 2017 to 2019, the large-growth Morningstar Category returned 18.1%, on average; large-value returned 9.8%.
This is also reflected when analyzing funds using factor profiles. Funds with holdings that displayed stronger growth characteristics significantly outperformed those with a value tilt. A fund's exposure is measured as the difference between its growth and value score, considering a company's earnings, book value, revenue, cash flow, and dividends.
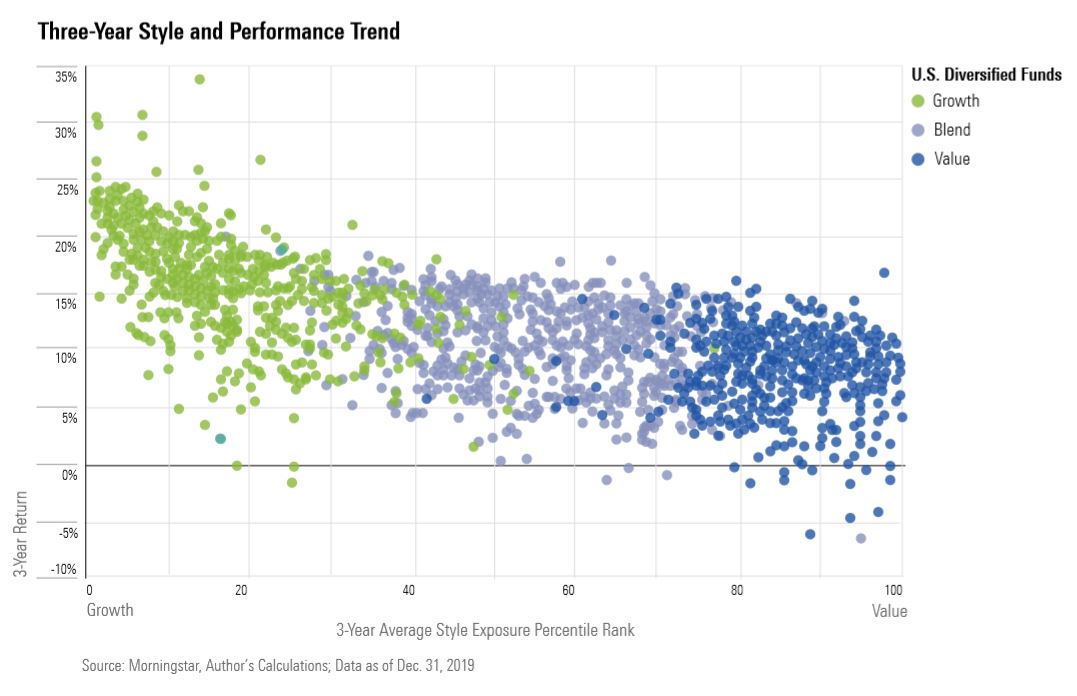
This trend also played out within growth stock categories, as the "growthiest" funds outperformed those with even a slight tilt toward blend or value.
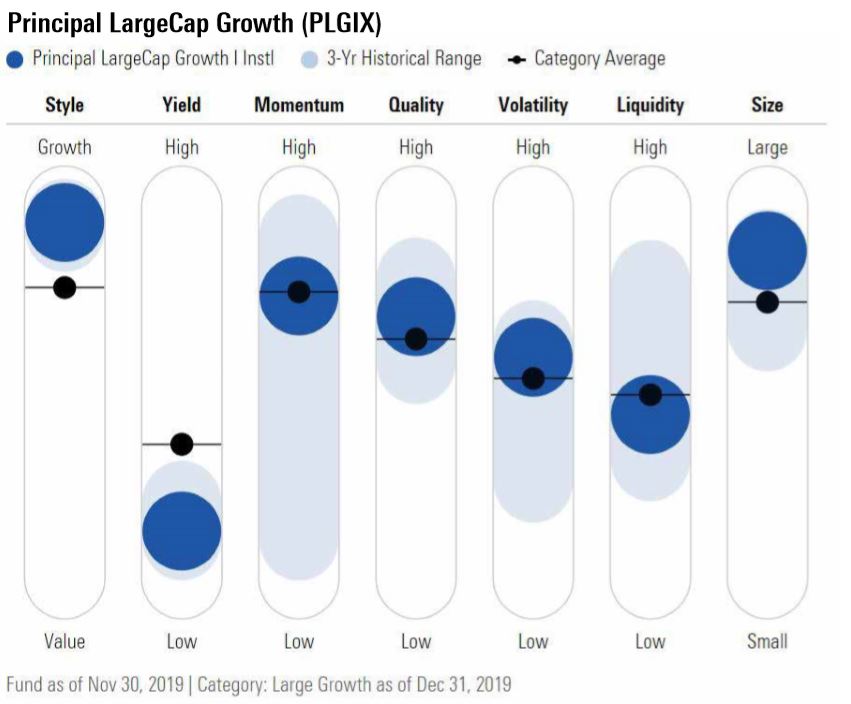
We can look at Principal LargeCap Growth PLGIX as an example. This fund, which has a Morningstar Analyst Rating of Silver, was a top performer in the large-growth category--ranking seventh--for the three-year period. It also had a more growth-oriented portfolio than 98% of all global equity funds.
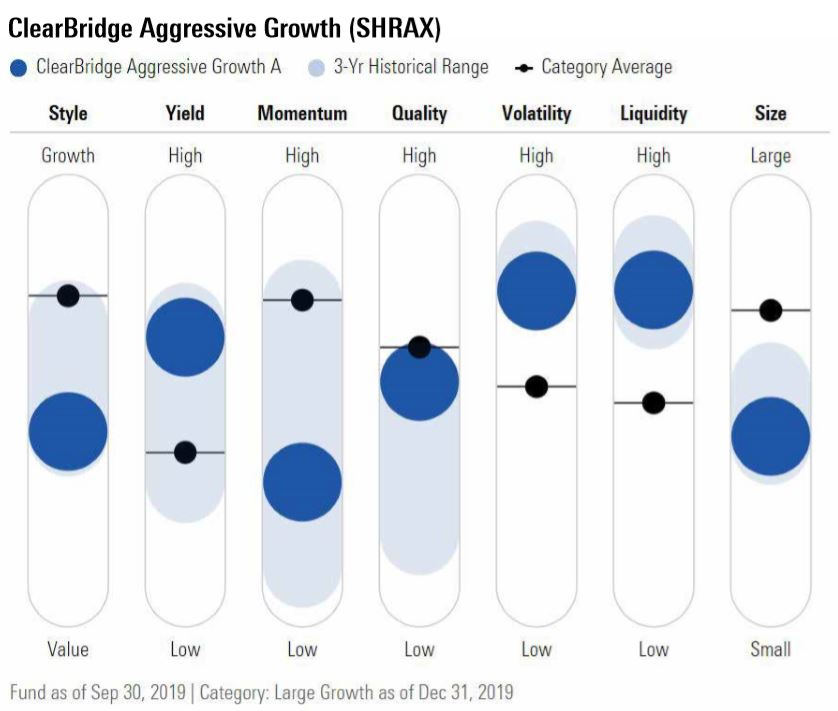
At the other end of the spectrum, ClearBridge Aggressive Growth SHRAX, also Silver rated, was the large-growth category's worst performer in the three-year period. The fund had less of a growth orientation than the category average for the entire period, and it ended 2019 the least growth exposure than it has ever had. It was also more exposed to growth stocks than only 43% of global equity funds, a middle-range ranking.
Size The size factor was consistent for the past three years: Portfolios with larger stocks did better than portfolios with smaller stocks. The large-blend category, on average, returned 13.3% for the three-year period, compared with small-blend's 6.6% return. And across the Morningstar Style Box, funds that had had relatively larger market-capitalization portfolios fared better than their peers: Mega-cap funds outperformed in the large-cap categories, as did small/mid-cap funds in the small-cap categories.
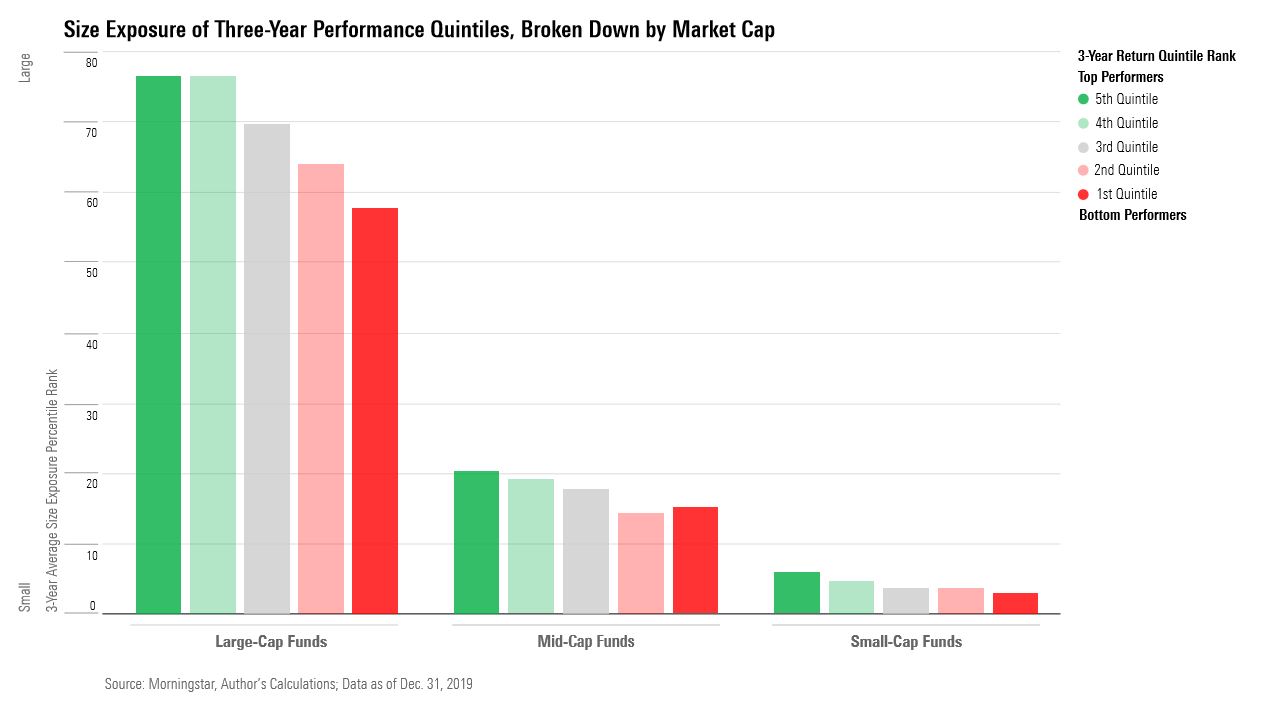
On the small-cap side, Silver-rated Baron Small Cap BSCFX, which invested in the largest small-cap stocks, was a top performer out of the small-cap categories. It returned 16.6% for three-year period, while the small-growth category average returned 13.5%.
Momentum Momentum is based on the premise that funds invested in stocks that have recently outperformed will continue to do so, and those that have underperformed will stay behind.
From 2017 to 2019, on average, funds with a higher momentum exposure outperformed counterparts that had less.
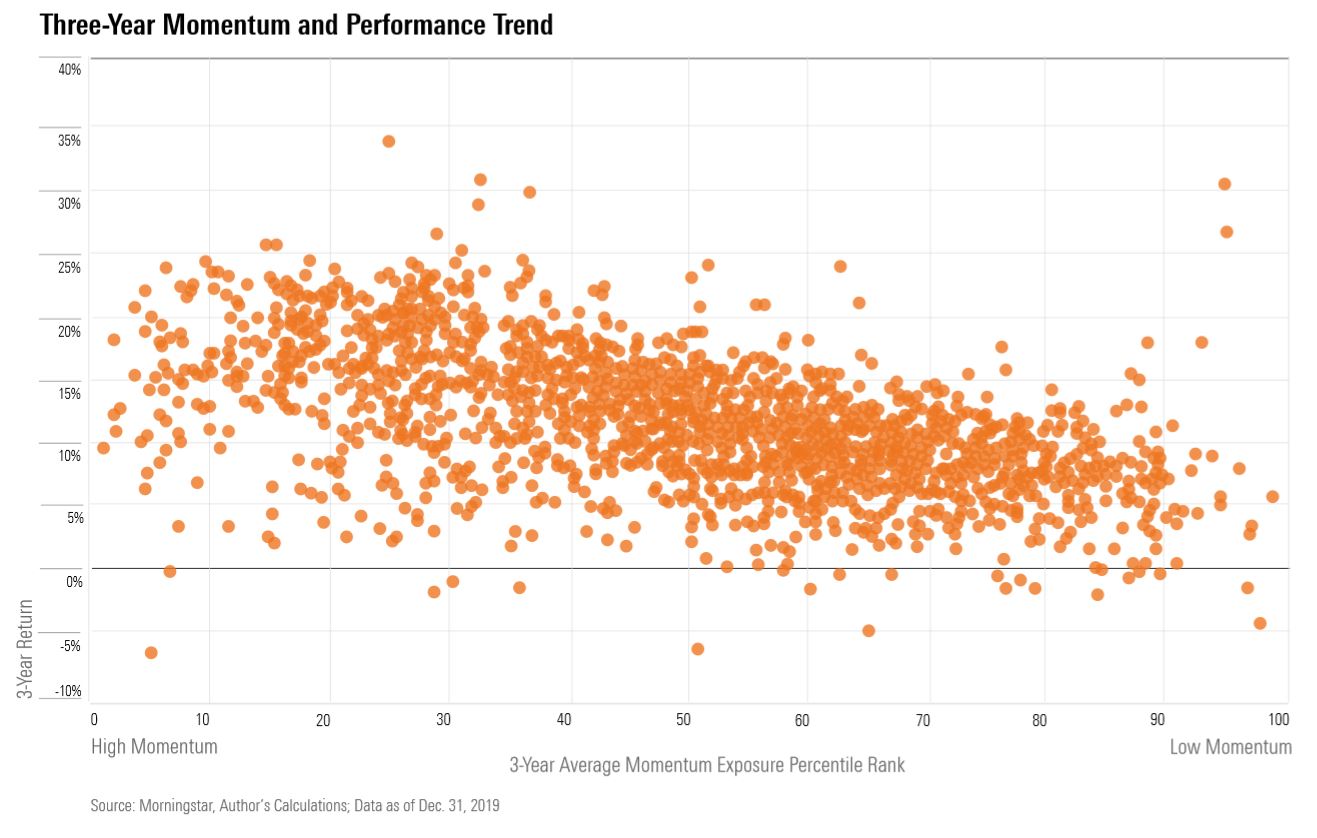
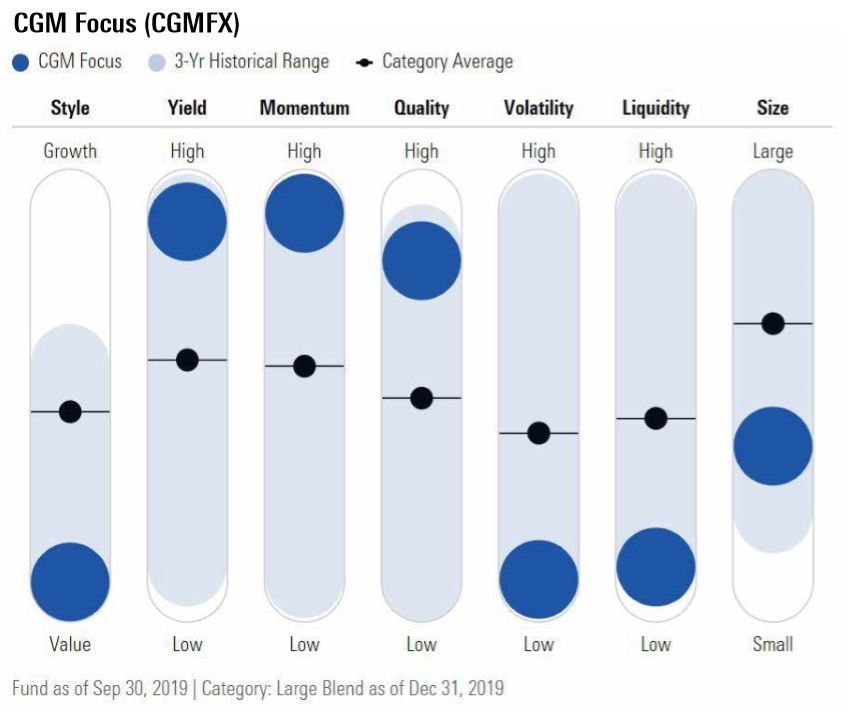
There were funds that bucked the trend, however, such as CGM Focus CGMFX in the large-blend category. The fund was more exposed to momentum than 94% of global equity funds yet lost 6.5% over the three-year period. But this outcome does mesh with the style and size factors; CGM Focus is a deep-value fund with a smaller market cap, both working against its performance.
In the large-growth category, the top-performing quintile had an average momentum exposure in the 26th percentile (high) of funds compared with the bottom-performing quintile of funds in the 39th percentile.
Volatility Over the 2017-19 period, the factor data did not show a trend connecting volatility and performance. However, when we focused on a downmarket period such as the fourth quarter of 2018, there was a relationship.
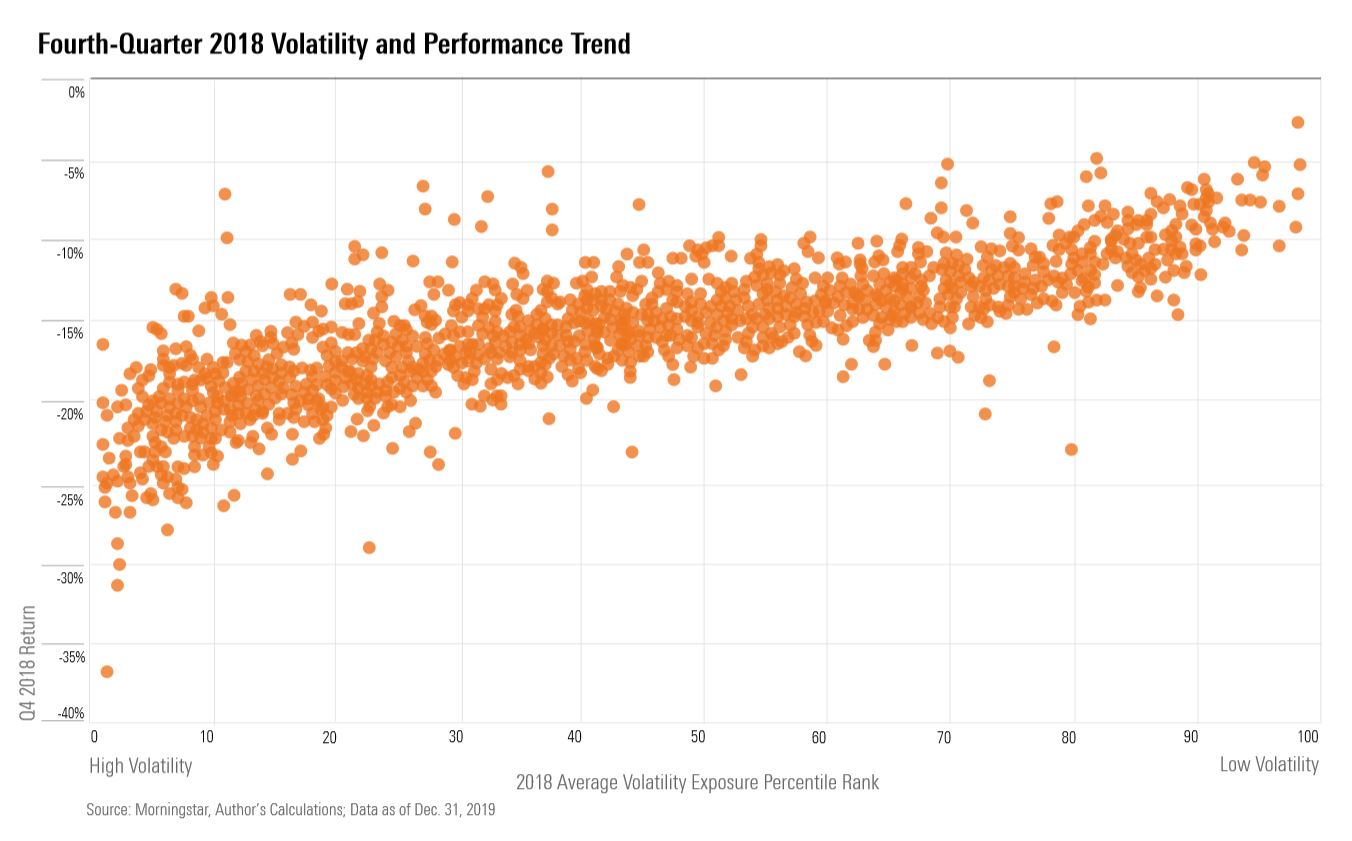
This is clear when we look at two funds in the large-blend category over the three-year period. Silver-rated DFA US Core Equity 1 DFEOX, in the third decile of the most volatile funds globally, and First Trust Horizon Managed Volatility Domestic ETF HUSV, the category's second-least-volatile fund, ended the three-year period on similar footing, with respective 13.2% and 13.1% returns.
However, during the 2018's fourth quarter, DFA US Core Equity 1 got hit with a 15.9% loss, landing in the bottom decile for category performance, while First Trust Horizon Managed Volatility Domestic ETF suffered only a 7.2% loss, beating 99% of the category that quarter.
/cloudfront-us-east-1.images.arcpublishing.com/morningstar/ZKOY2ZAHLJVJJMCLXHIVFME56M.jpg)
/cloudfront-us-east-1.images.arcpublishing.com/morningstar/IGTBIPRO7NEEVJCDNBPNUYEKEY.png)
/cloudfront-us-east-1.images.arcpublishing.com/morningstar/HDPMMDGUA5CUHI254MRUHYEFWU.png)