
How'd Active Funds Do in 2019? So-So
Active funds tasted success a bit more often in 2019. But most still lagged the indexes.
/s3.amazonaws.com/arc-authors/morningstar/550ce300-3ec1-4055-a24a-ba3a0b7abbdf.png)
Markets treated investors kindly last year. An indexed portfolio split 60%/40% between U.S. large-cap stocks and domestic investment-grade bonds notched a 22% total return in 2019. Active-fund investors got in on the action, too, with the average active U.S. large-cap equity fund gaining more than 25% and the average intermediate-term core bond fund around 8%. Not too shabby.
But the question for active-fund investors is how those funds fared versus their benchmark indexes in 2019. To that end, this piece examines active equity- and bond-fund success rates, finding:
- Around 40% of active funds beat their indexes last year, a slight improvement from 2018.
- Active U.S. stock funds continued to slump, with only 29% of such funds surpassing their benchmarks after fees.
- 53% of active foreign stock funds outperformed their bogies last year, the highest of the four asset classes we examined.
- Success rates were a bit higher when measured based on risk-adjusted performance, but not dramatically so--42% of active funds notched higher Sharpe ratios than their indexes did.
- On average, successful active funds beat their benchmarks by around 3% in 2019, while unsuccessful funds lagged their indexes by about 3.60% last year.
- Of the active funds that succeeded in 2019, around 12% had also beaten their benchmarks in 2018 and another 16% had three-peated, outperforming in 2017, 2018, and 2019.
Study We compiled the calendar-year total returns and Sharpe ratios of all actively managed stock and bond funds for the period of Jan. 1, 2005, to Dec. 31, 2019. We calculated the returns and Sharpe ratios in two ways--before and after fees. We then compared each fund's pre- and postfee returns and Sharpe ratios against a benchmark index based on its category classification at the relevant times. We calculated success rates as the percentage of funds that began a calendar year, survived to the end of that period, and outperformed the index, divided by the total number of funds that began the calendar year. The study includes funds that were merged or liquidated away (we consider funds that die in a calendar year to be failures). We used one representative share class per fund, the oldest share class.
Findings Around 40% of active funds generated higher net returns than their benchmark indexes in 2019, 53% before fees. This does represent an improvement from a dismal 2018 campaign when fewer than one third of active funds beat their bogies net of fees.
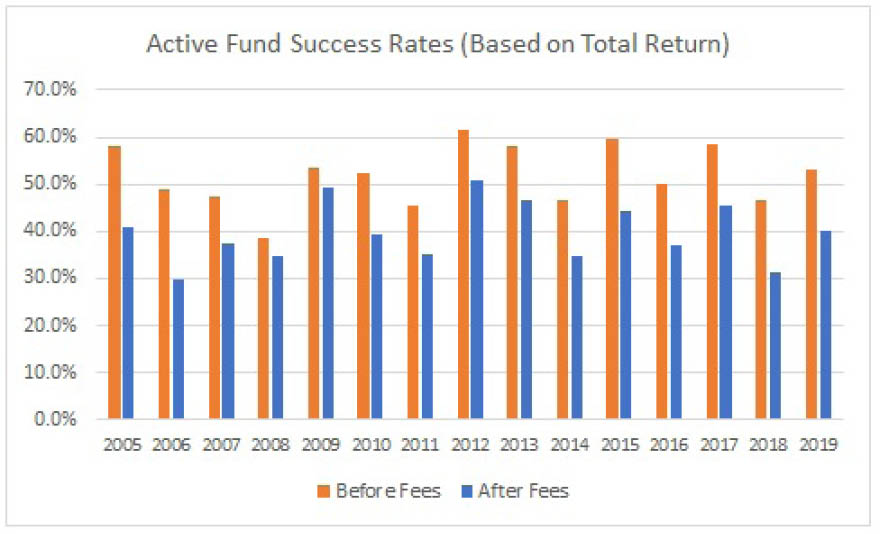
- source: Morningstar Analysts
Does the picture brighten any once we adjust for risk (that is, when we measure using Sharpe ratio)? A little bit, with about 42% of funds producing higher Sharpe ratios than their benchmarks after fees last year (55% before fees). Those success rates are higher than average for the 15-calendar-year span we examined.
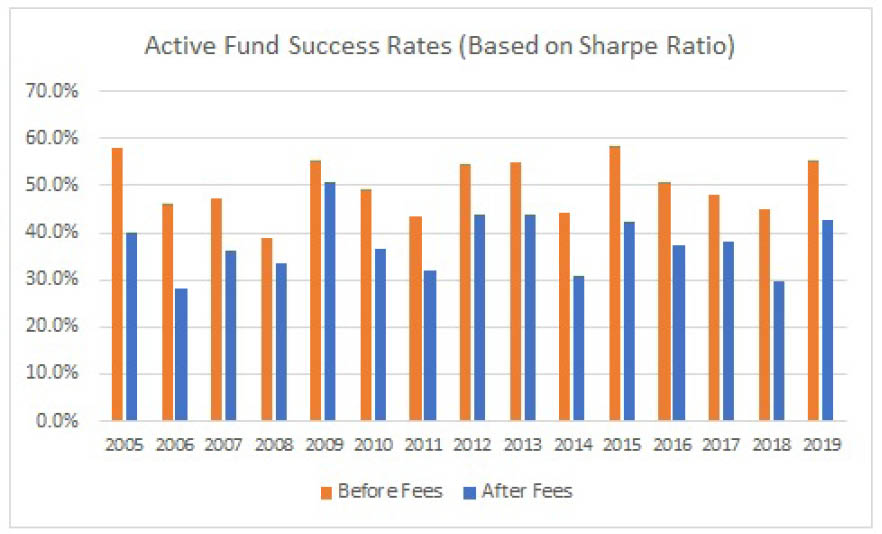
- source: Morningstar Analysts
Unfortunately, when we drill-down further, we find that active U.S. stock funds remained mired in a slump. Only 29% of such funds beat their indexes after fees (39% prefee), down from 37% in 2018 and well below the 37% 15-year average success rate. Although active foreign-equity funds’ absolute returns lagged U.S. stock funds’ in 2019, they succeeded far more often: 53% topped their benchmarks after expenses (62% before fees). Active bond funds’ success rates split the difference, with slightly more than 40% beating the market net of fees. (Active muni-bond funds had the highest success rate of all before fees, at 66%, but the second-lowest after fees, reflecting the toll expenses take.)
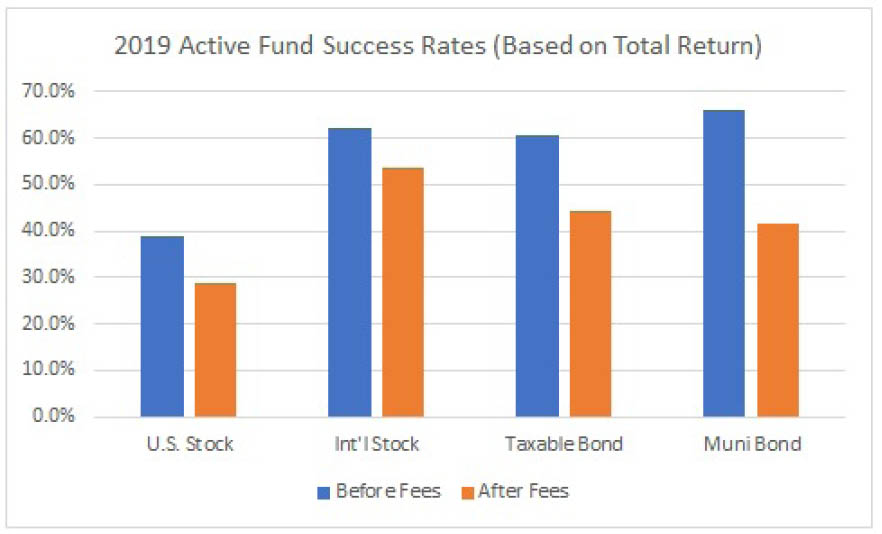
- source: Morningstar Analysts
The results improved slightly after we adjusted for risk, but not by much, as evidenced by the broadly similar Sharpe ratio success rates shown below.
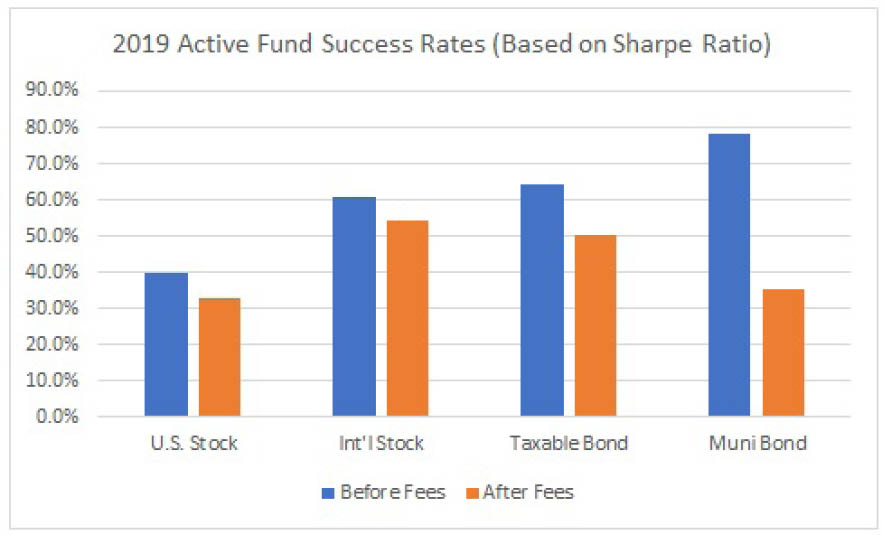
- source: Morningstar Analysts
We also examined the average excess net return of active stock and bond funds in 2019 and compared that with prior years. What we found was that, on average, funds that beat their benchmarks produced around 300 basis points of positive excess returns in 2019. Conversely, those that lagged their indexes trailed by around 3.60%, on average, last year. That marked a reversal from 2018, when the average reward of investing in successful active funds (2.98%) slightly exceeded the penalty of investing in laggards (negative 2.64%).
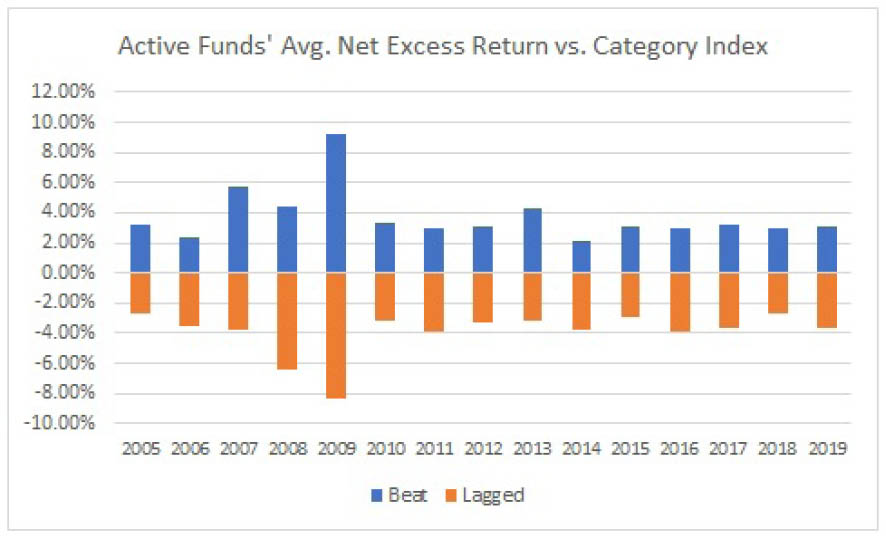
- source: Morningstar Analysts
Finally, we took a closer look at active funds that had succeeded in a given calendar year to see how many of those funds were "repeat" (that is, two successful calendar years in a row) or "threepeat" (that is, three consecutive successful years) winners. What we found was that 12% of the 1,999 active funds that beat their benchmark in 2019 had achieved that same feat in 2018, and only 16% had pulled off a hat trick by topping their index in 2017 and 2018. In other words, around 11% of all active funds were repeat or threepeat winners in 2019.
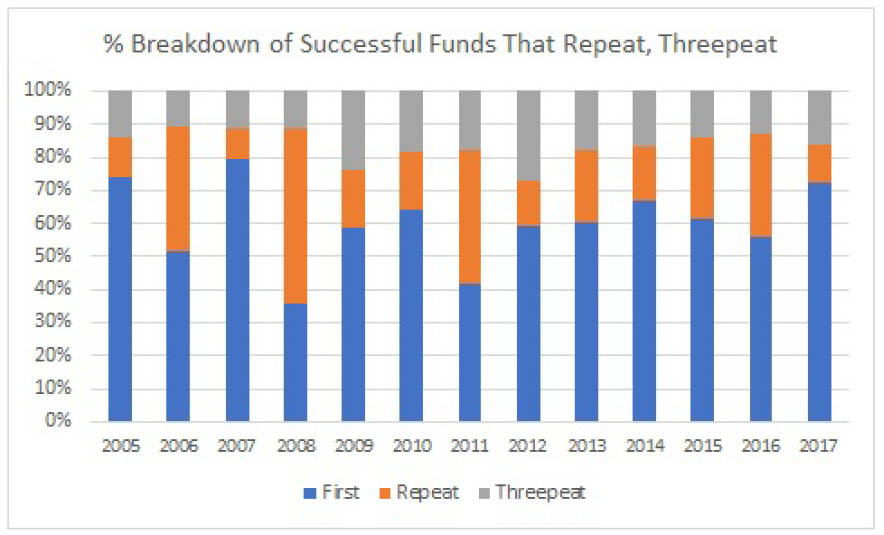
- source: Morningstar Analysts
Active funds generated strong absolute returns for investors, but the clear majority of those funds lagged their benchmarks. This was especially true of active U.S. stock funds, before and after adjusting for risk. Success rates were higher in other asset classes, but the average payoff of investing in successful funds didn’t exceed the average penalty associated with investing in unsuccessful funds. All told, 2019 marked a slight improvement over 2018 but didn’t much buck the long-term trend, which has seen active funds struggle to beat their indexes net of fees.
:quality(80)/cloudfront-us-east-1.images.arcpublishing.com/morningstar/OMVK3XQEVFDRHGPHSQPIBDENQE.jpg)
:quality(80)/cloudfront-us-east-1.images.arcpublishing.com/morningstar/WJS7WXEWB5GVXMAD4CEAM5FE4A.png)