
2019 Fund Flows in 9 Charts
A visual take on the ins and outs of last year's dollars.
/s3.amazonaws.com/arc-authors/morningstar/8b2e267c-9b75-4539-a610-dd2b6ed6064a.jpg)
This article originally appeared in Morningstar Direct Cloud and Morningstar Office Cloud.
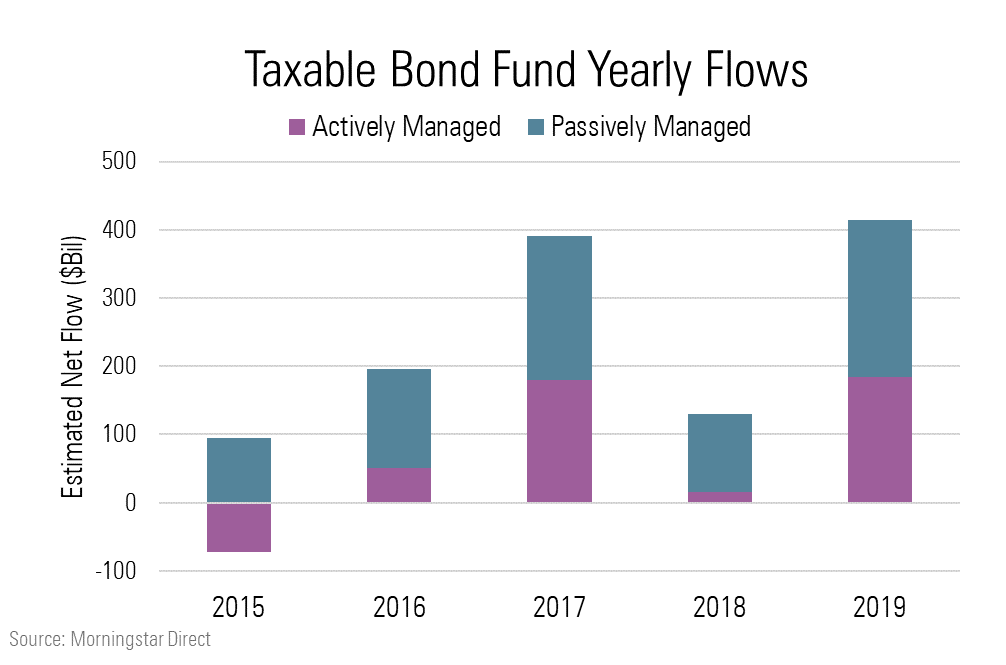
Even with a roughly 30% rise in the U.S. stock market, investors poured a record amount of new cash into taxable-bond funds in 2019, and U.S. stock funds saw net outflows.
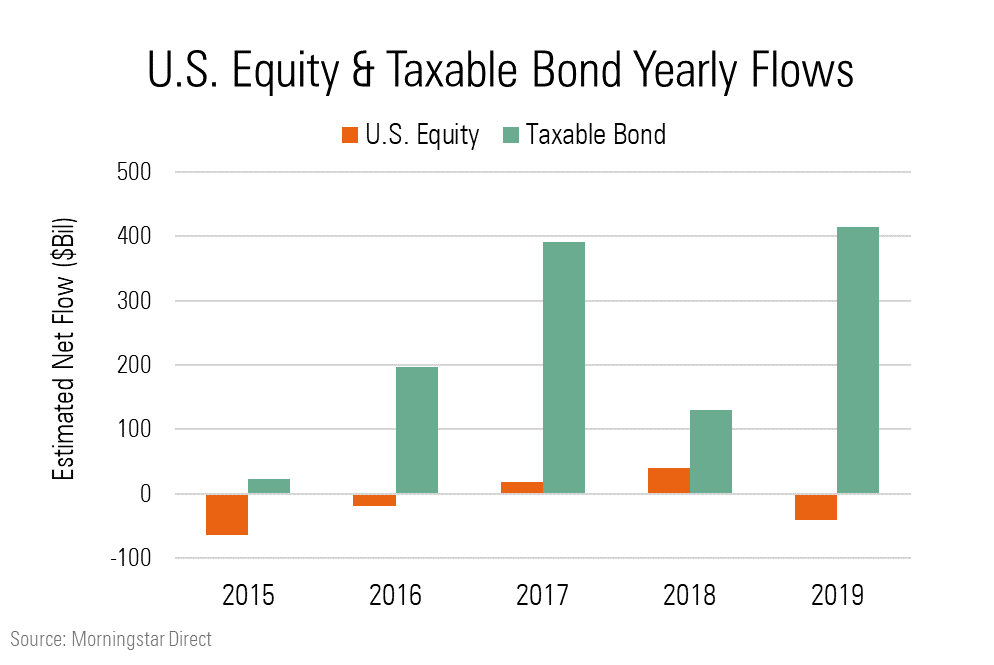
Taxable-bond funds had their best year ever with inflows of $413.9 billion in 2019, while U.S. equity funds lost $41.3 billion.
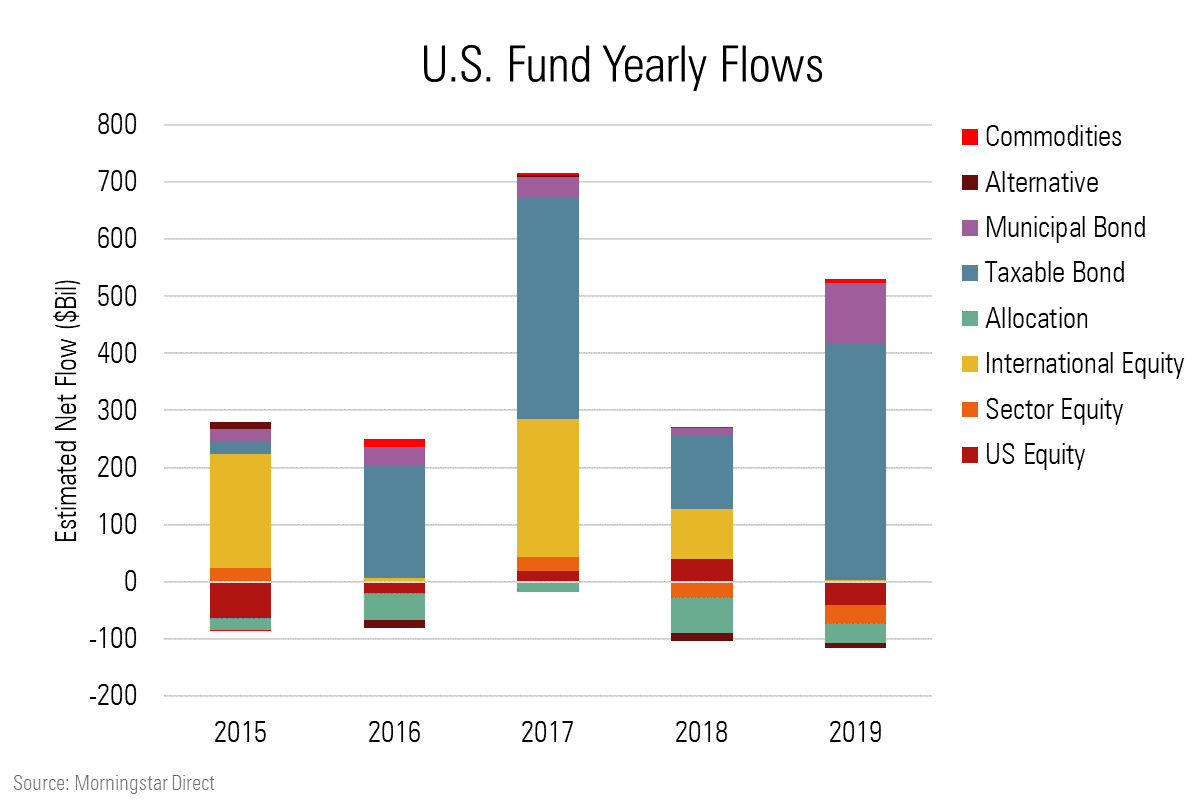
Among all long-term fund groups, the municipal and taxable-bond Morningstar Categories paced the inflows. Muni-bond funds saw record net inflows totaling $105.4 billion. International equity funds, which had large inflows in the past two years, took in only a net $3.8 billion.
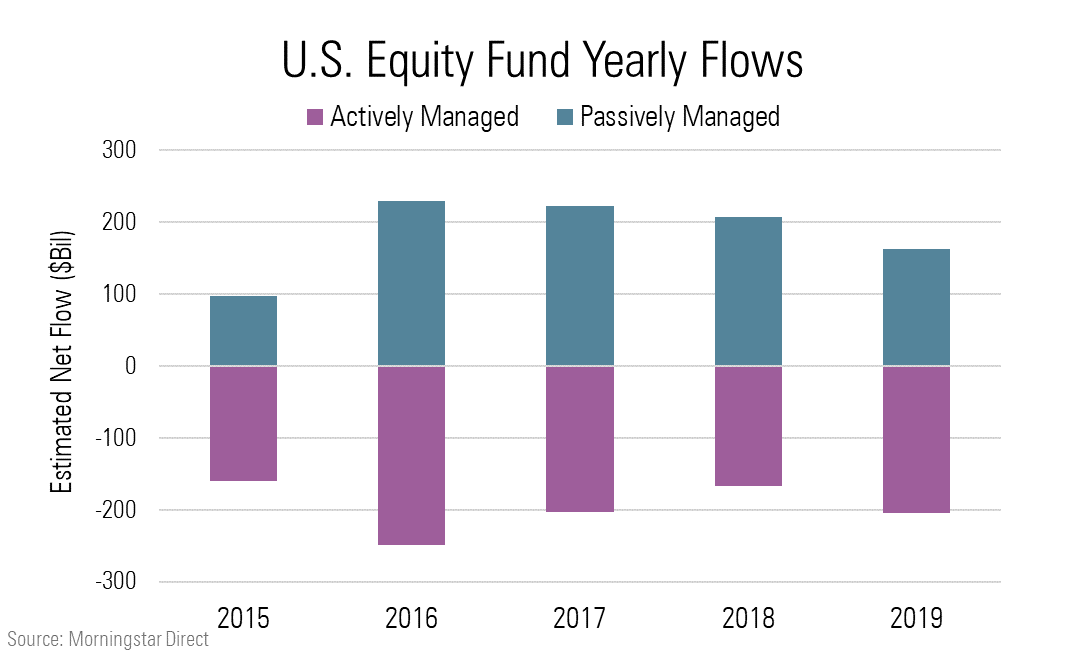
After posting inflows of $40.2 billion in 2018, U.S. equity funds saw net outflows of $41.3 billion in 2019. Most of the outflows came from investors heading out the door of actively managed U.S. stock funds, which saw $204.1 billion of net withdrawals, while passively managed funds had net inflows of $162.7 billion.
Among U.S. diversified stock funds, 2019 saw continued divergence between flows for the large-growth, large-blend, and large-value categories.
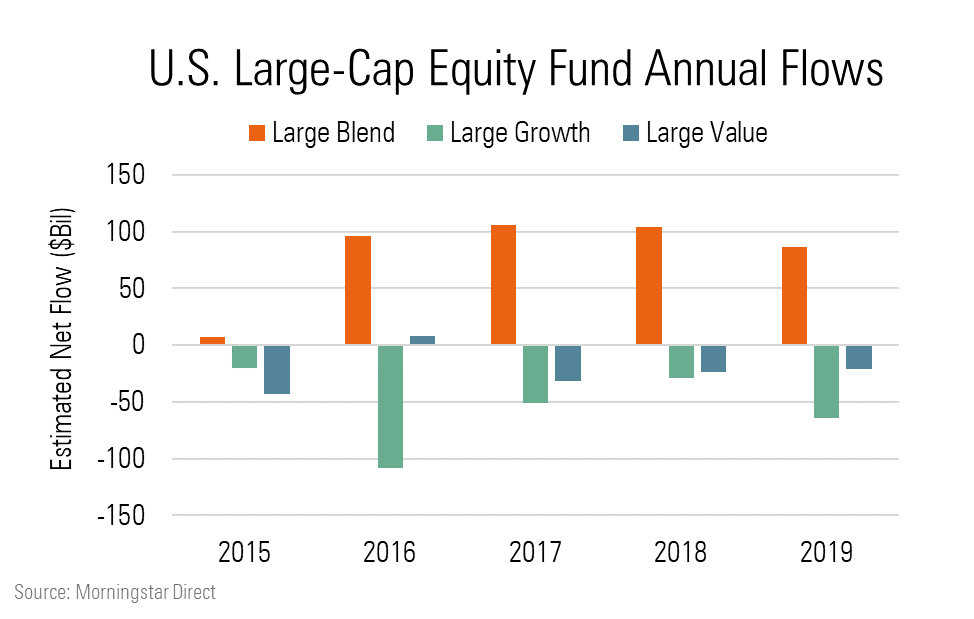
Large-blend funds had inflows of $86.3 billion, while large-growth and large-value funds lost $64.1 billion and $20.6 billion, respectively. This trend reflects the growing preference for core U.S. stock index strategies, such as Vanguard Total Stock Market Index VTSMX and SPDR S&P 500 ETF SPY, which land in the large-blend category. Those two funds alone account for $1.2 trillion in assets. Vanguard Total Stock Market Index collected $6 billion and SPDR S&P 500 ETF gained $18.6 billion in 2019.
Within bond funds, taxable-bond funds continued to see inflows, with intermediate core bond funds taking in a record $124.9 billion.
Among fund companies, the story in 2019 continued to be good news for index providers and bad news for fund companies with lineups dominated by active funds. Vanguard saw inflows of $183.3 billion, compared with $221.3 billion in 2018. Fidelity ranked third on the list; the company still saw $20.8 billion leave its active funds, but more than $91.3 billion went into its passive products.
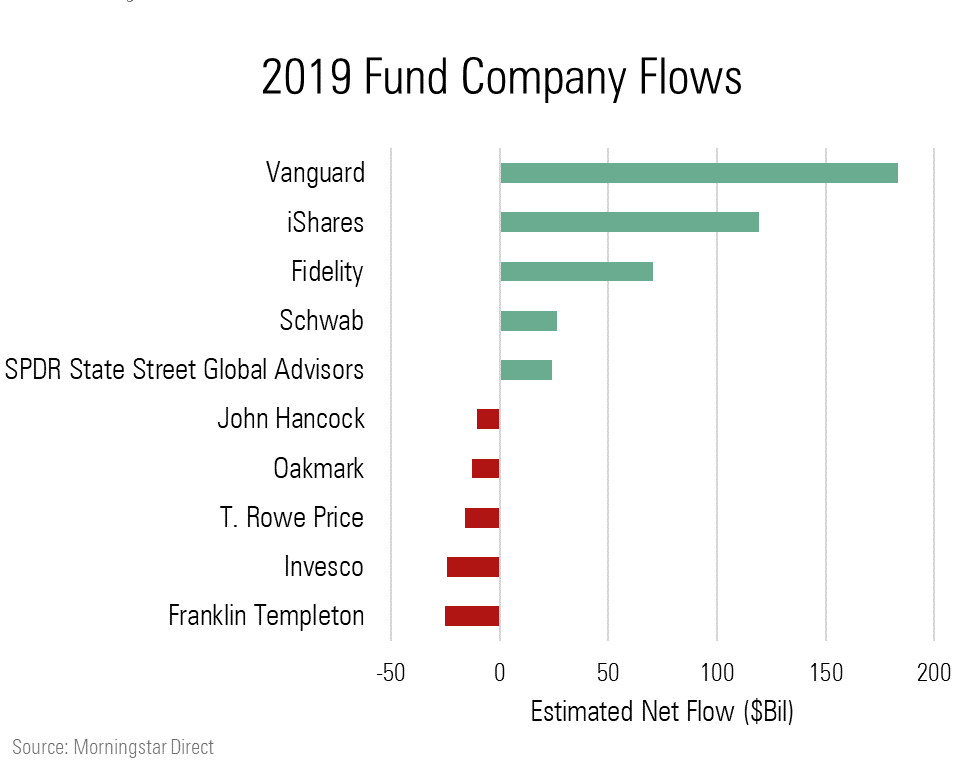
Franklin Templeton had outflows for the fifth year in a row, and T. Rowe Price for the fourth year in a row.
But as we have written elsewhere, the story isn’t one of active versus passive. It’s one of investors heading toward the cheapest funds.
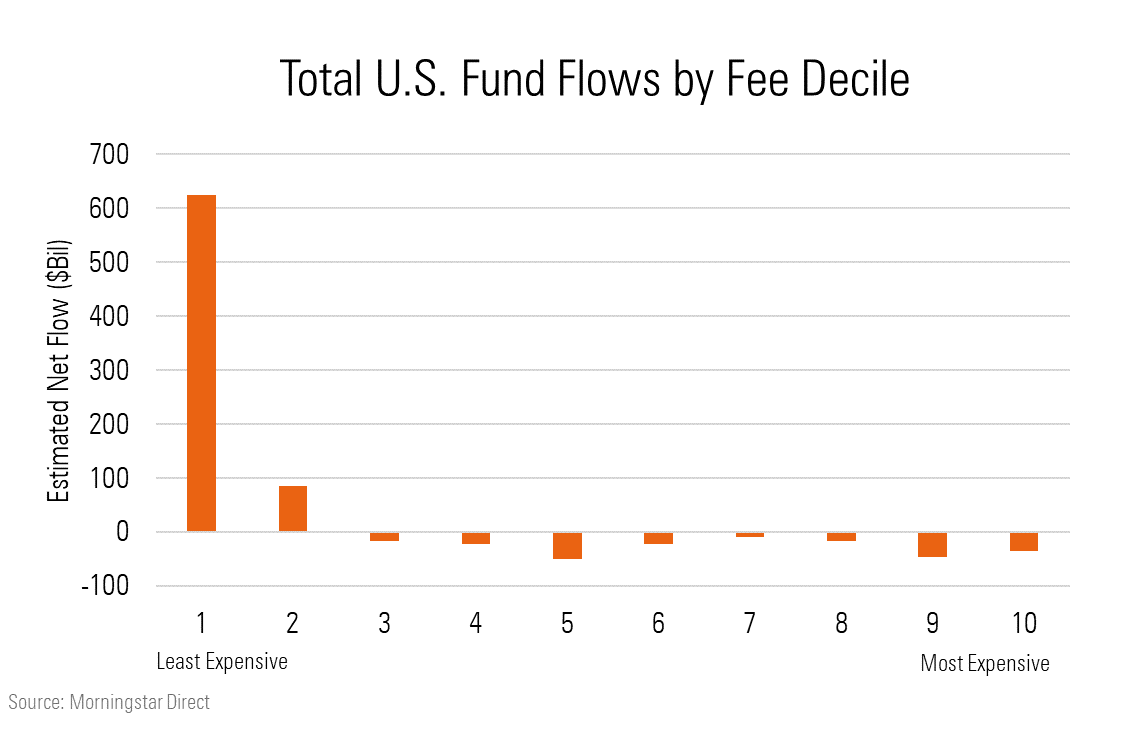
The cheapest decile of funds collected $624.9 billion in 2019, while the most expensive 10% saw outflows of $34.9 billion.
Meanwhile, money market funds had the largest inflows since the global financial crisis year of 2008.
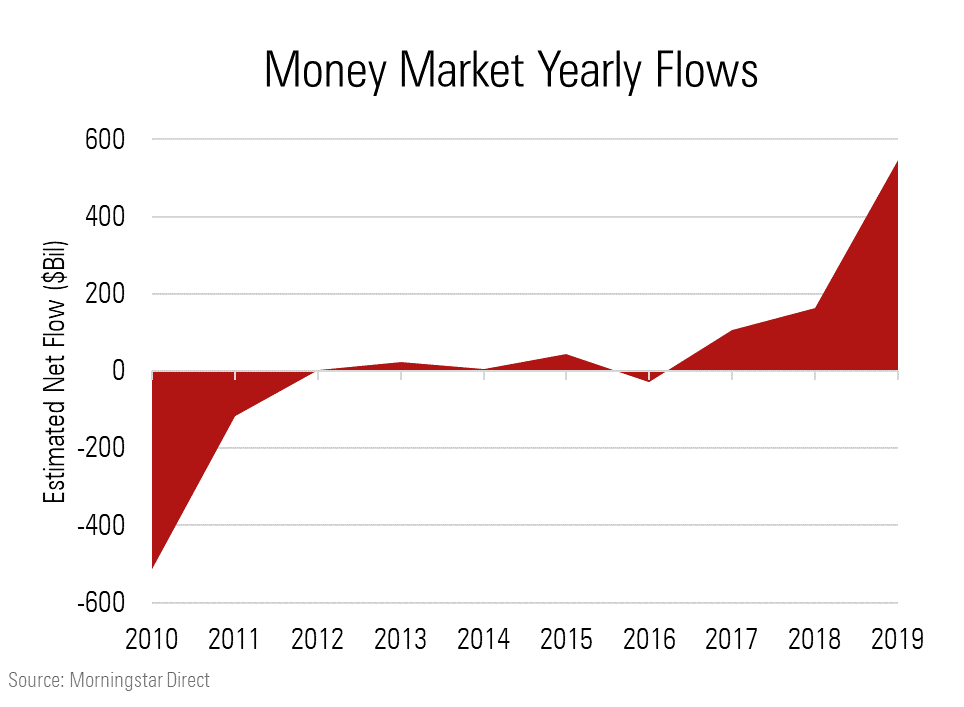
The group saw $547.4 billion of inflows, which topped the $414.6 billion that went into all long-term funds. While some market observers saw this flood of cash as “dry powder” that could drive stocks still higher, John Rekenthaler noted that money market funds’ share of total fund assets has actually been going down in recent years.
Among the other major trends in the U.S. fund industry has been the rising interest in sustainable investing. Every year since 2016 money has flowed into sustainable funds, but this year saw the largest jump on record.
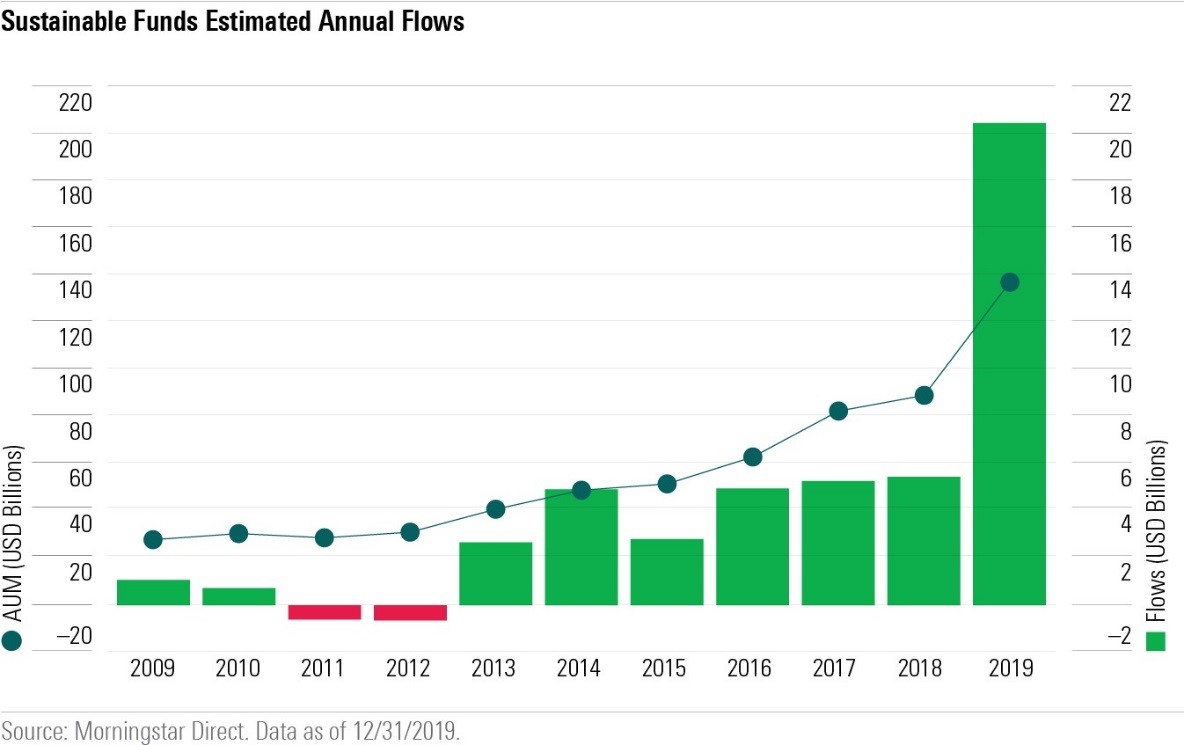
As Jon Hale, head of sustainability investing at Morningstar, noted, the estimated net flows into open-end and exchange-traded sustainable funds available to U.S. investors totaled a record $20.6 billion for the year. That's nearly 4 times the previous annual record for net flows set in 2018.
:quality(80)/cloudfront-us-east-1.images.arcpublishing.com/morningstar/OMVK3XQEVFDRHGPHSQPIBDENQE.jpg)
:quality(80)/cloudfront-us-east-1.images.arcpublishing.com/morningstar/WJS7WXEWB5GVXMAD4CEAM5FE4A.png)