
Performance Across the Decade in 7 Charts
How has the decade stacked up for stocks and bonds?
/s3.amazonaws.com/arc-authors/morningstar/8b2e267c-9b75-4539-a610-dd2b6ed6064a.jpg)
/s3.amazonaws.com/arc-authors/morningstar/ed529c14-e87a-417f-a91c-4cee045d88b4.jpg)
This article originally appeared in Morningstar Direct Cloud and Morningstar Office Cloud.
As the 2010s draw to a close, investors can look back on a decade where bull markets in both stocks and bonds repeatedly defied predictions that the good times would come to an end. The result: Those investors who stayed in the markets enjoyed solid long-term returns across their portfolios.
Here’s a look at some of the major trends in the stock and bond markets from the past decade, starting with average annual returns for two major U.S indexes.
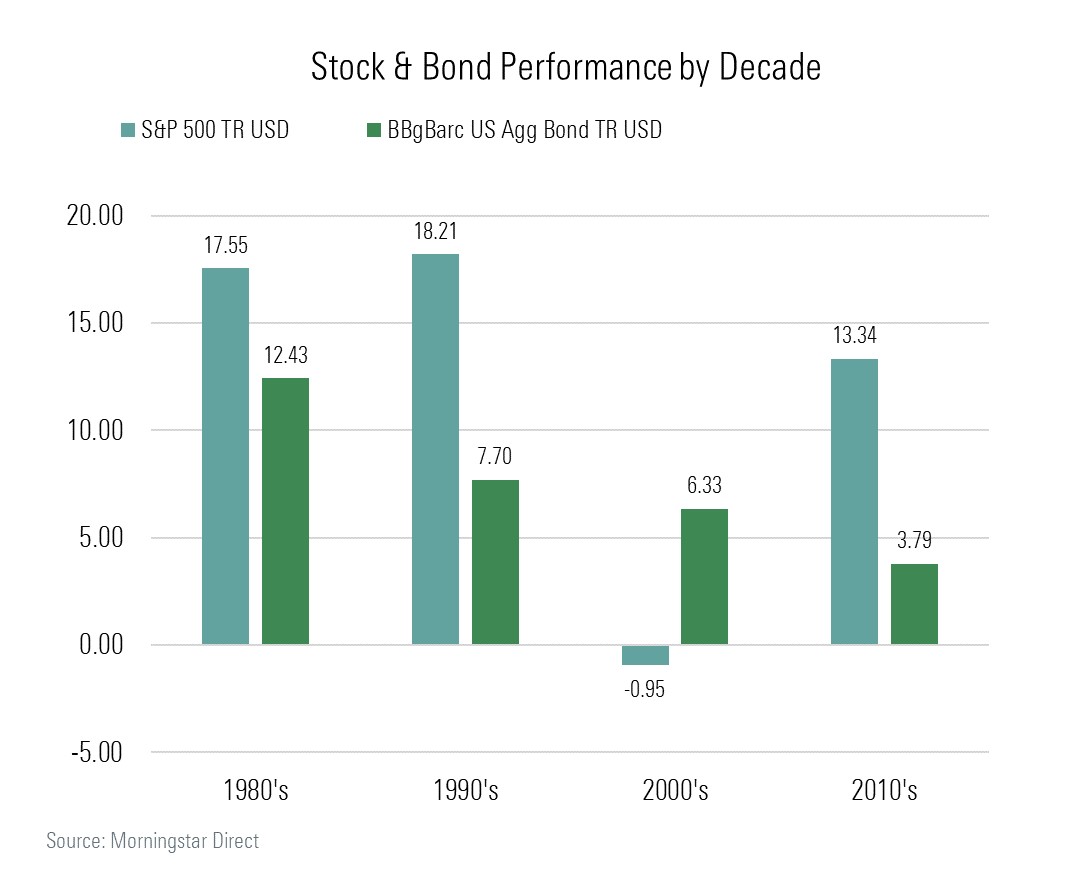
It may be hard for many investors to remember now, but the 2000s were one of the worst decades in stock market history thanks to two bear markets, including, of course, the 2008 global financial crisis. By comparison, the 2010s were a banner decade, although average annual returns for the S&P 500 were less than the 1980s and 1990s. The S&P returned 13.3% for the last decade, led by 2013’s 39.4% annual return.
While bond returns were positive for the decade, they’ve declined every decade for the past four. Quite simply, bond returns have been capped by the low absolute level of yields as the slow recovery from the financial crisis was accompanied by record-low official interest rates that lasted for much of the decade.
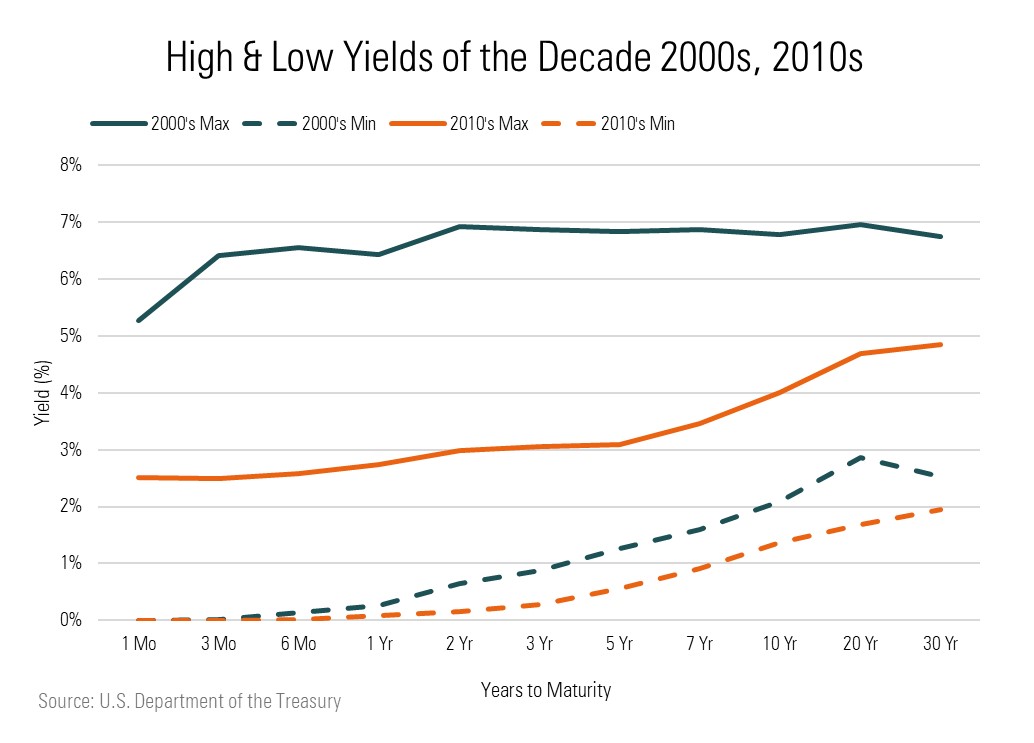
Not only were interest rates low, but over the course of the decade, there was little in the way of ups and downs. A comparison of highs and lows for U.S. Treasury bond yields over the past two decades tells the story.
During the 2000s, the lowest yield hit by the U.S. Treasury 10-year note was 2.08% in December 2008. Meanwhile, the 10-year yield hit a low of 1.37% in July 2016 and managed a decade-long high of 4.01% only in April 2010.
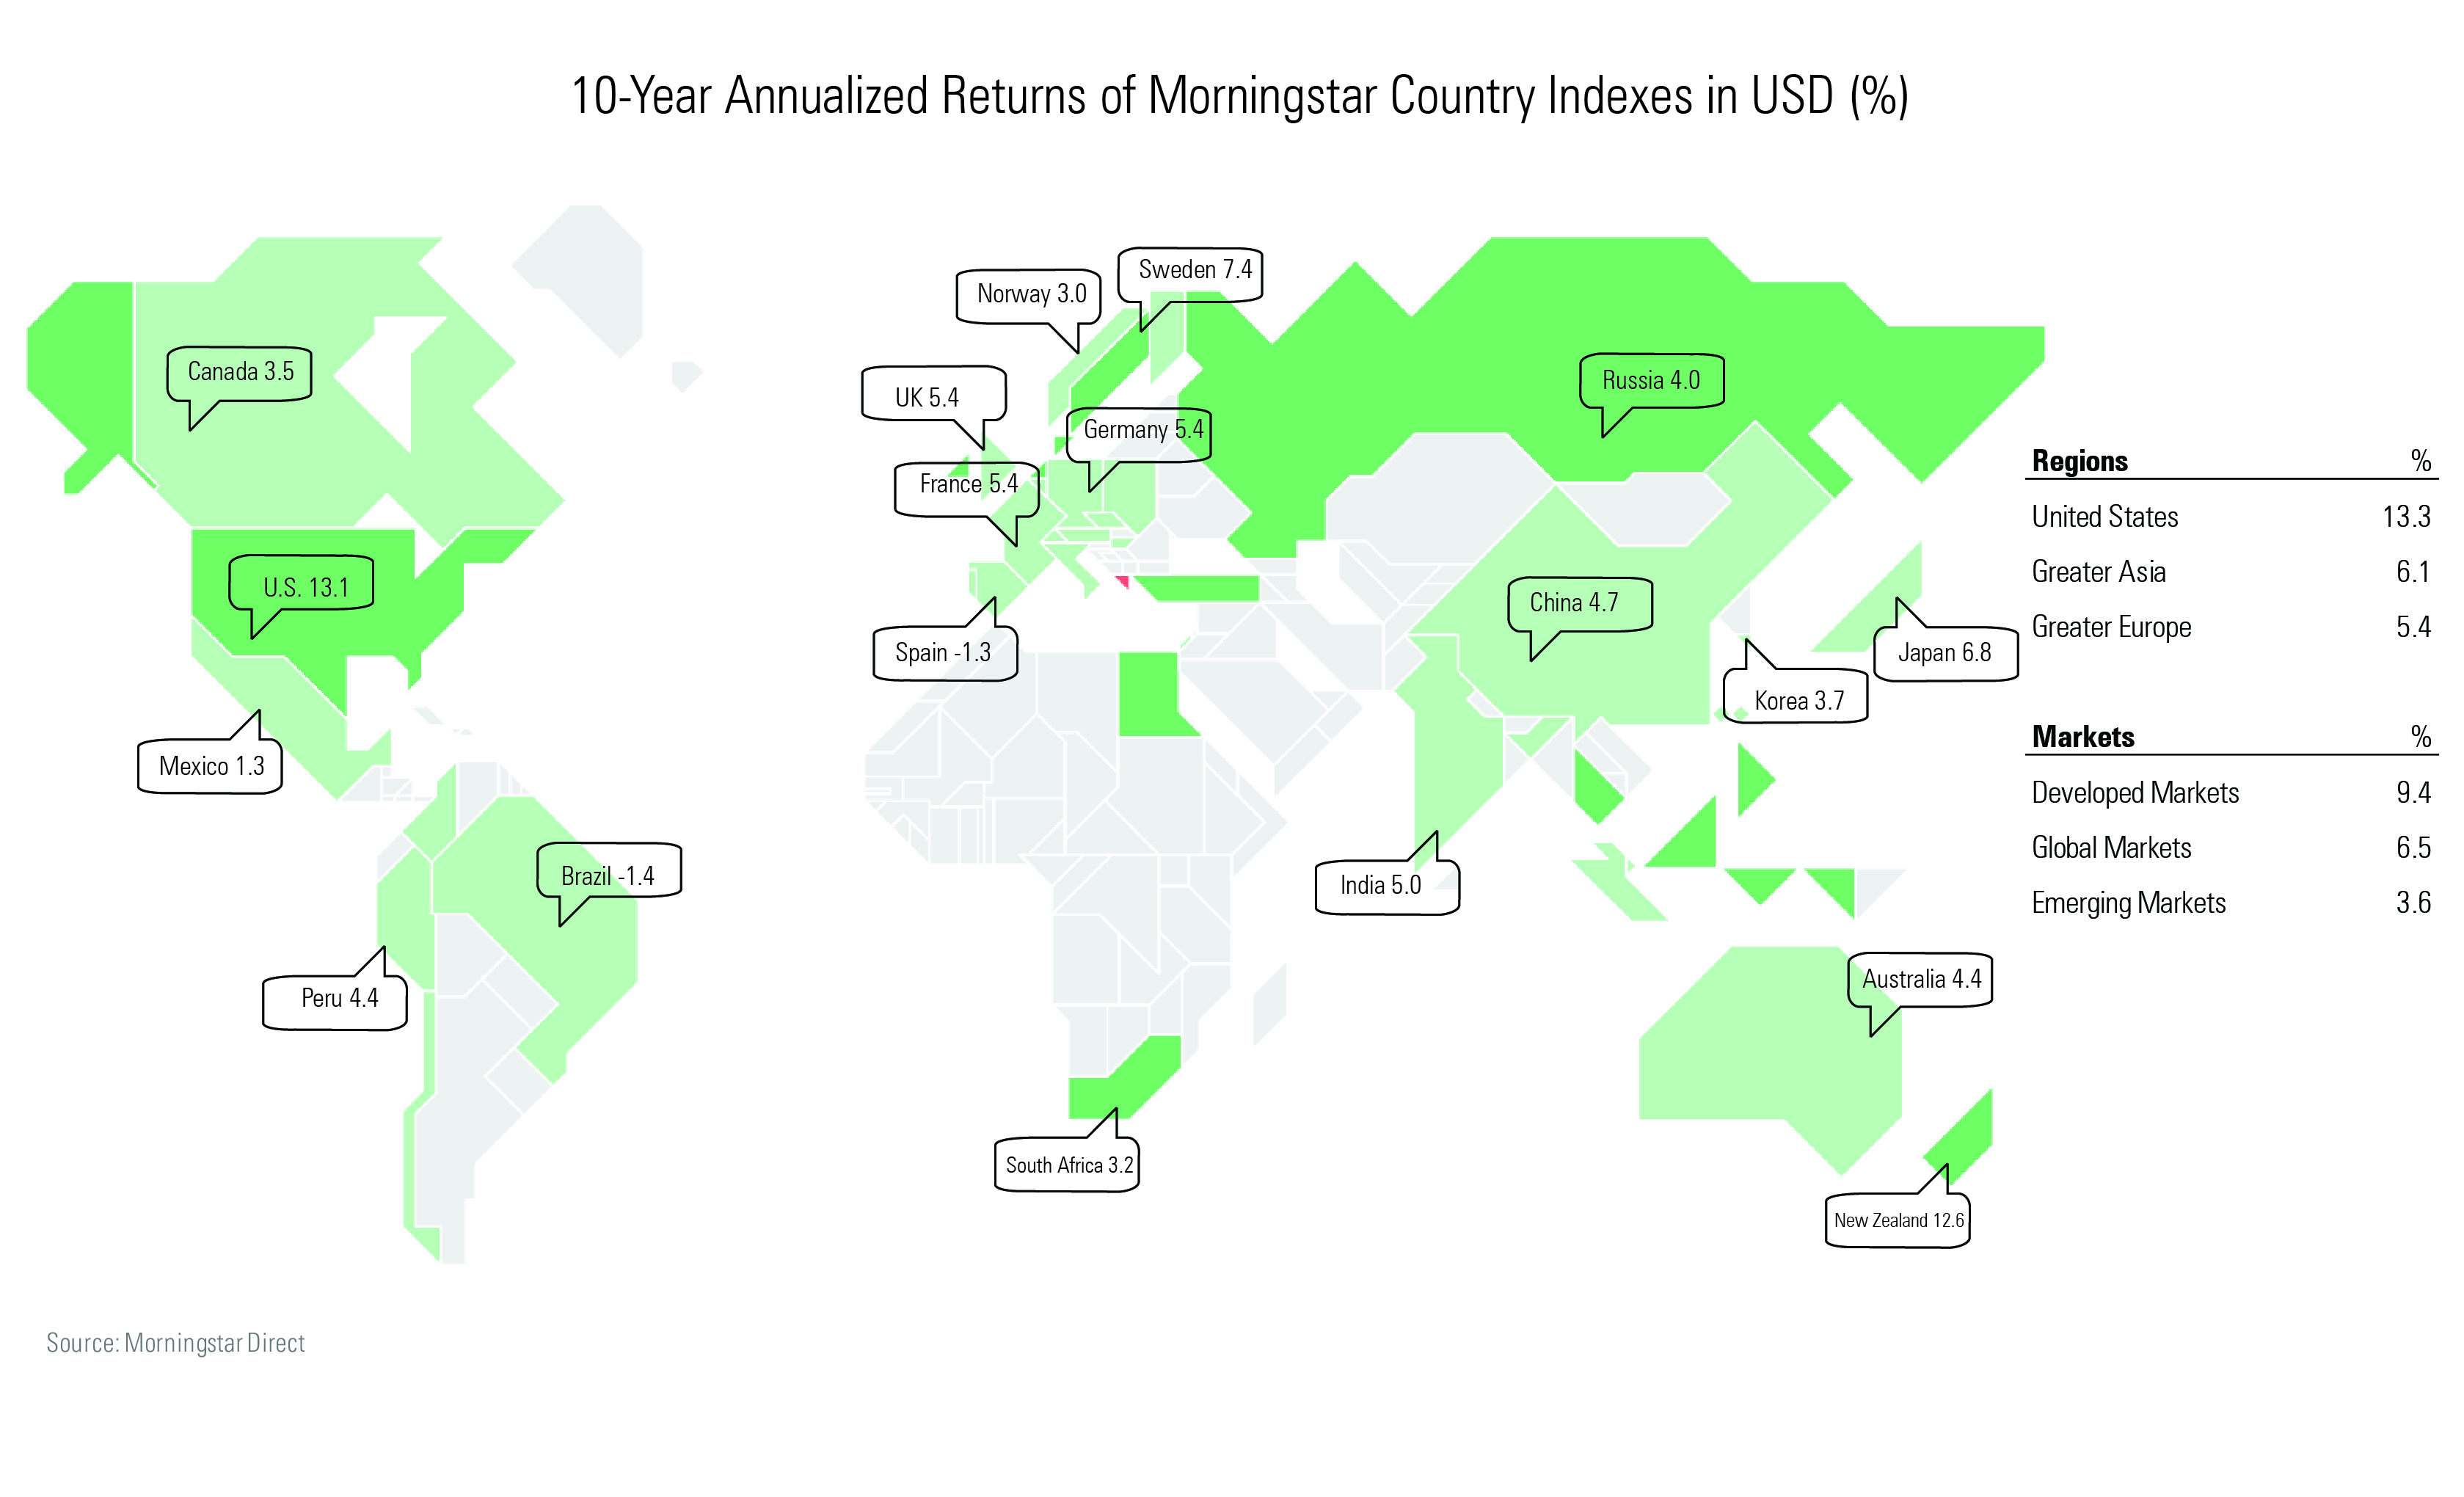
The bull market for stocks was a global phenomenon. Despite continued volatility in emerging markets, countries such as New Zealand, Denmark, and the United States led the returns. Greece suffered the worst, with its financial crisis early in the decade taking the eurozone to the brink of collapse. In the United Kingdom, uncertainty plagued markets, and U.K. stocks returned an annualized 5.4% for the decade. Japanese stocks lagged, and China, where markets struggled at the tail end of the decade, also had relatively low returns at less than 5% a year.
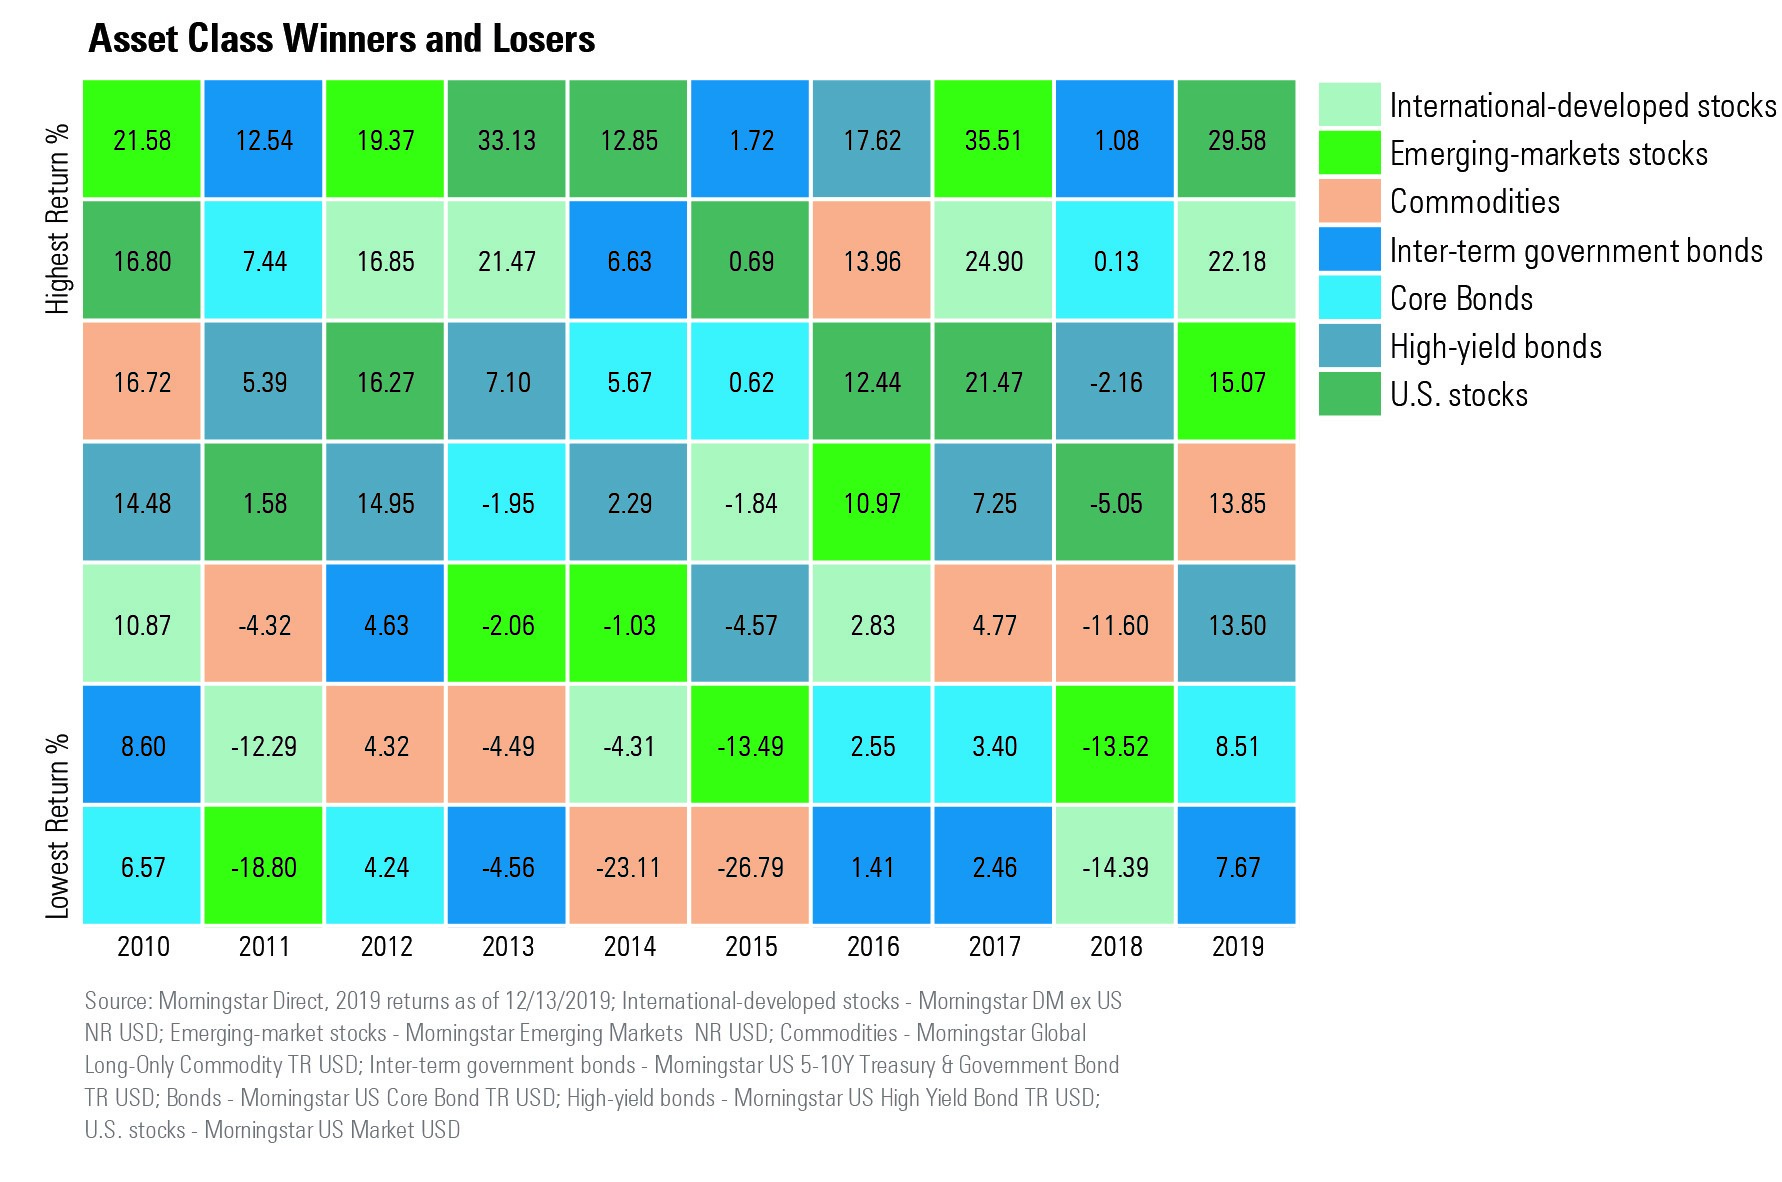
When looked at more broadly across asset classes over the course of the decade, U.S. and emerging-markets stocks dominated. Meanwhile, in three of the past four years, intermediate government bonds and core bonds performed the worst across asset classes. Commodities were a mixed bag over the past 10 years.
Within the U.S. stock market, the dominant themes were the long economic expansion and the transformation to the digital economy. Consumer cyclical stocks nose out technology stocks as the best-performing Morningstar sector, returning 16.5% to tech shares' 16.2% return. Healthcare, despite continued uncertainty on the policy front, wasn’t far behind with a 15% return.
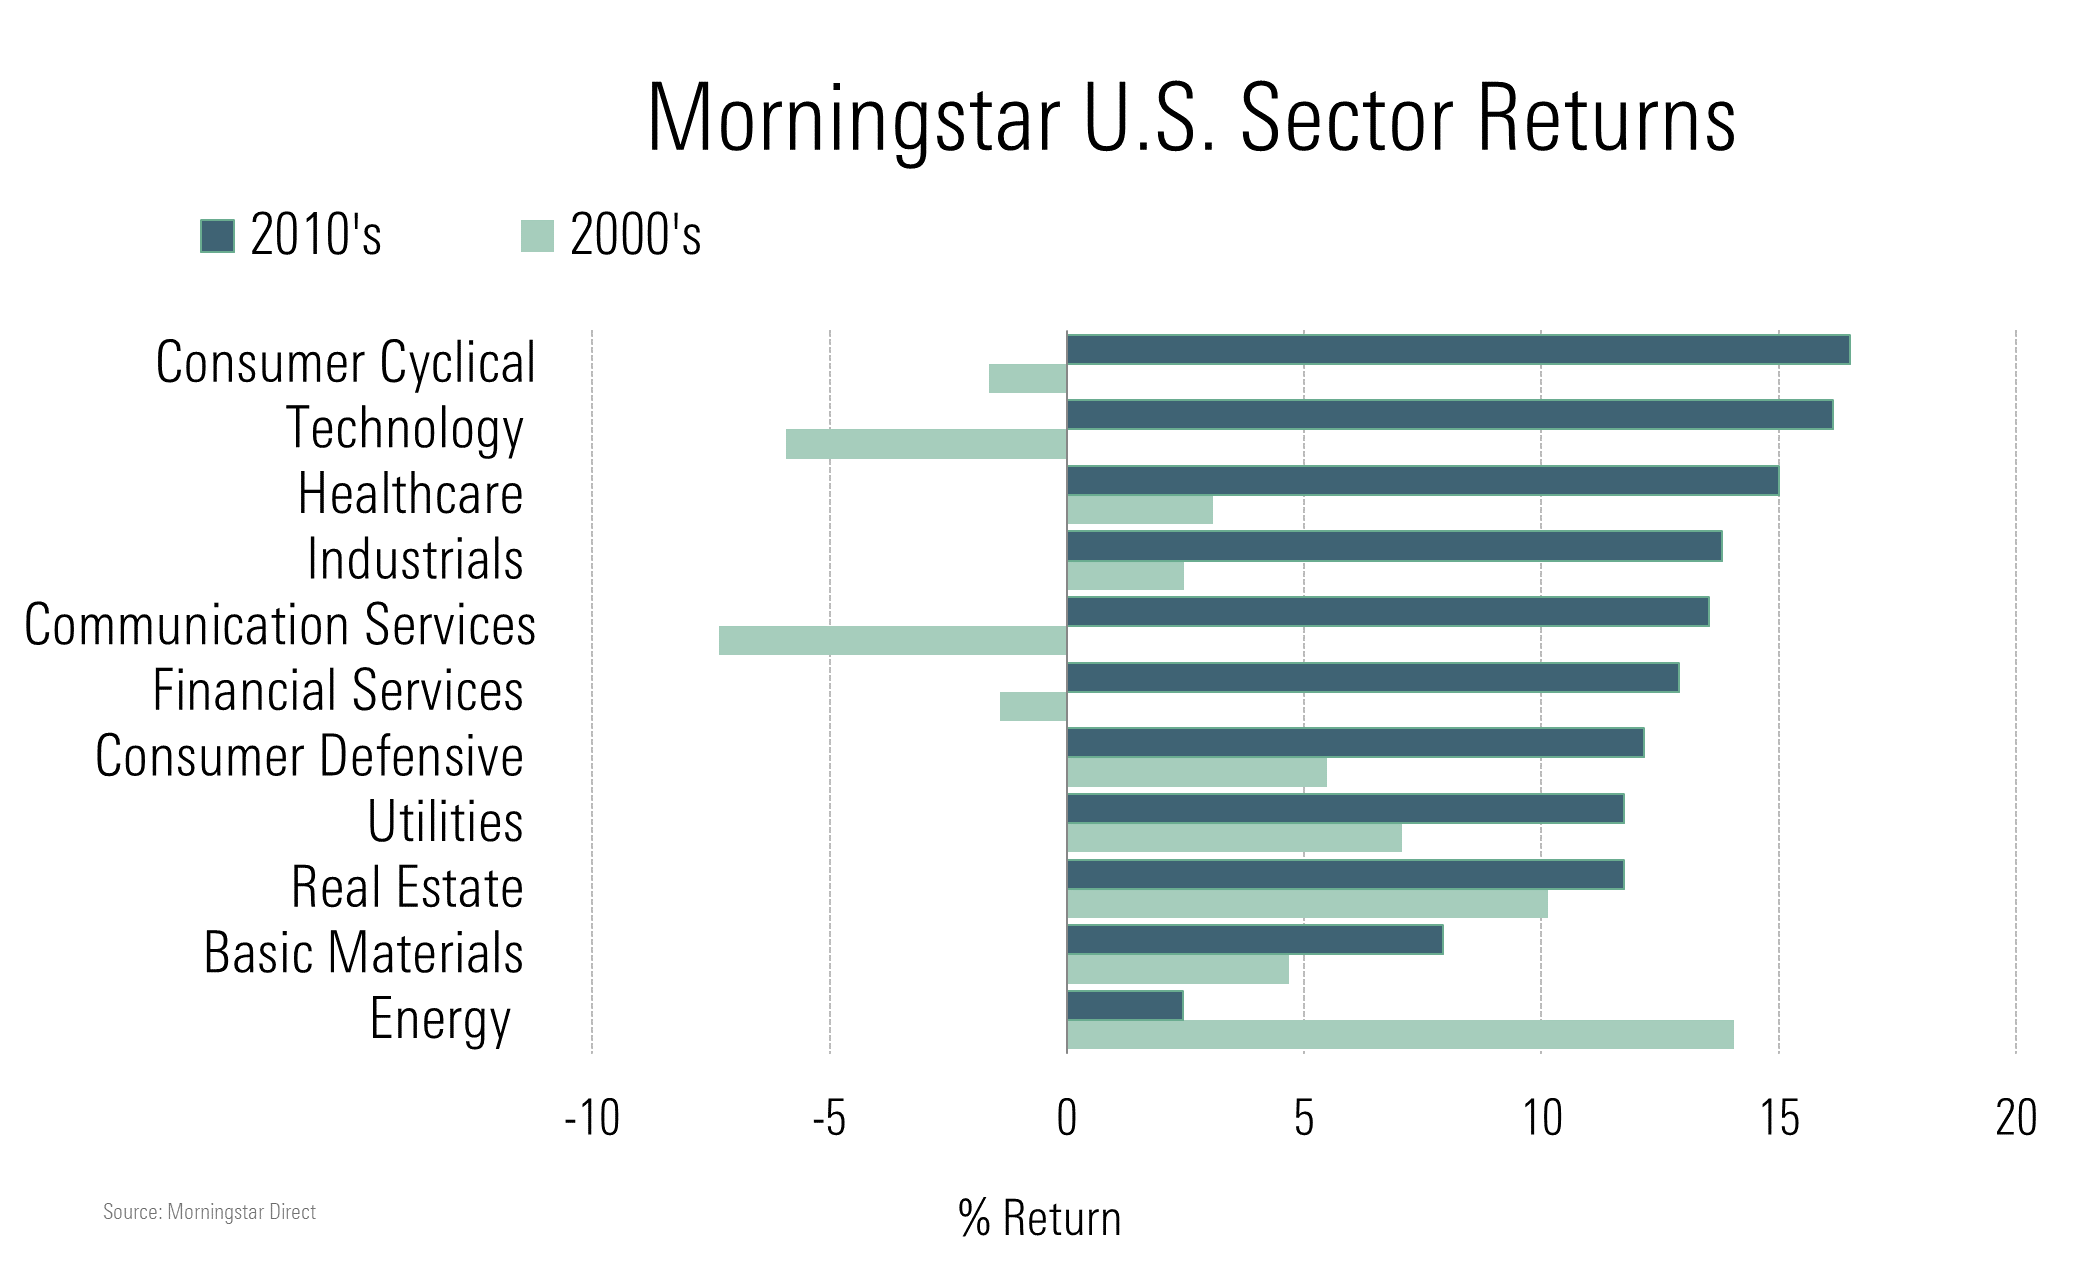
By contrast, the 2010s were a dismal decade for energy stocks, as the industry’s success in extracting more oil via fracking, along with generally slower-than-trend global economic growth, kept oil prices depressed for the much of the decade. Oil started off 2010 around $76 a barrel and is heading into the 2020s below $60.
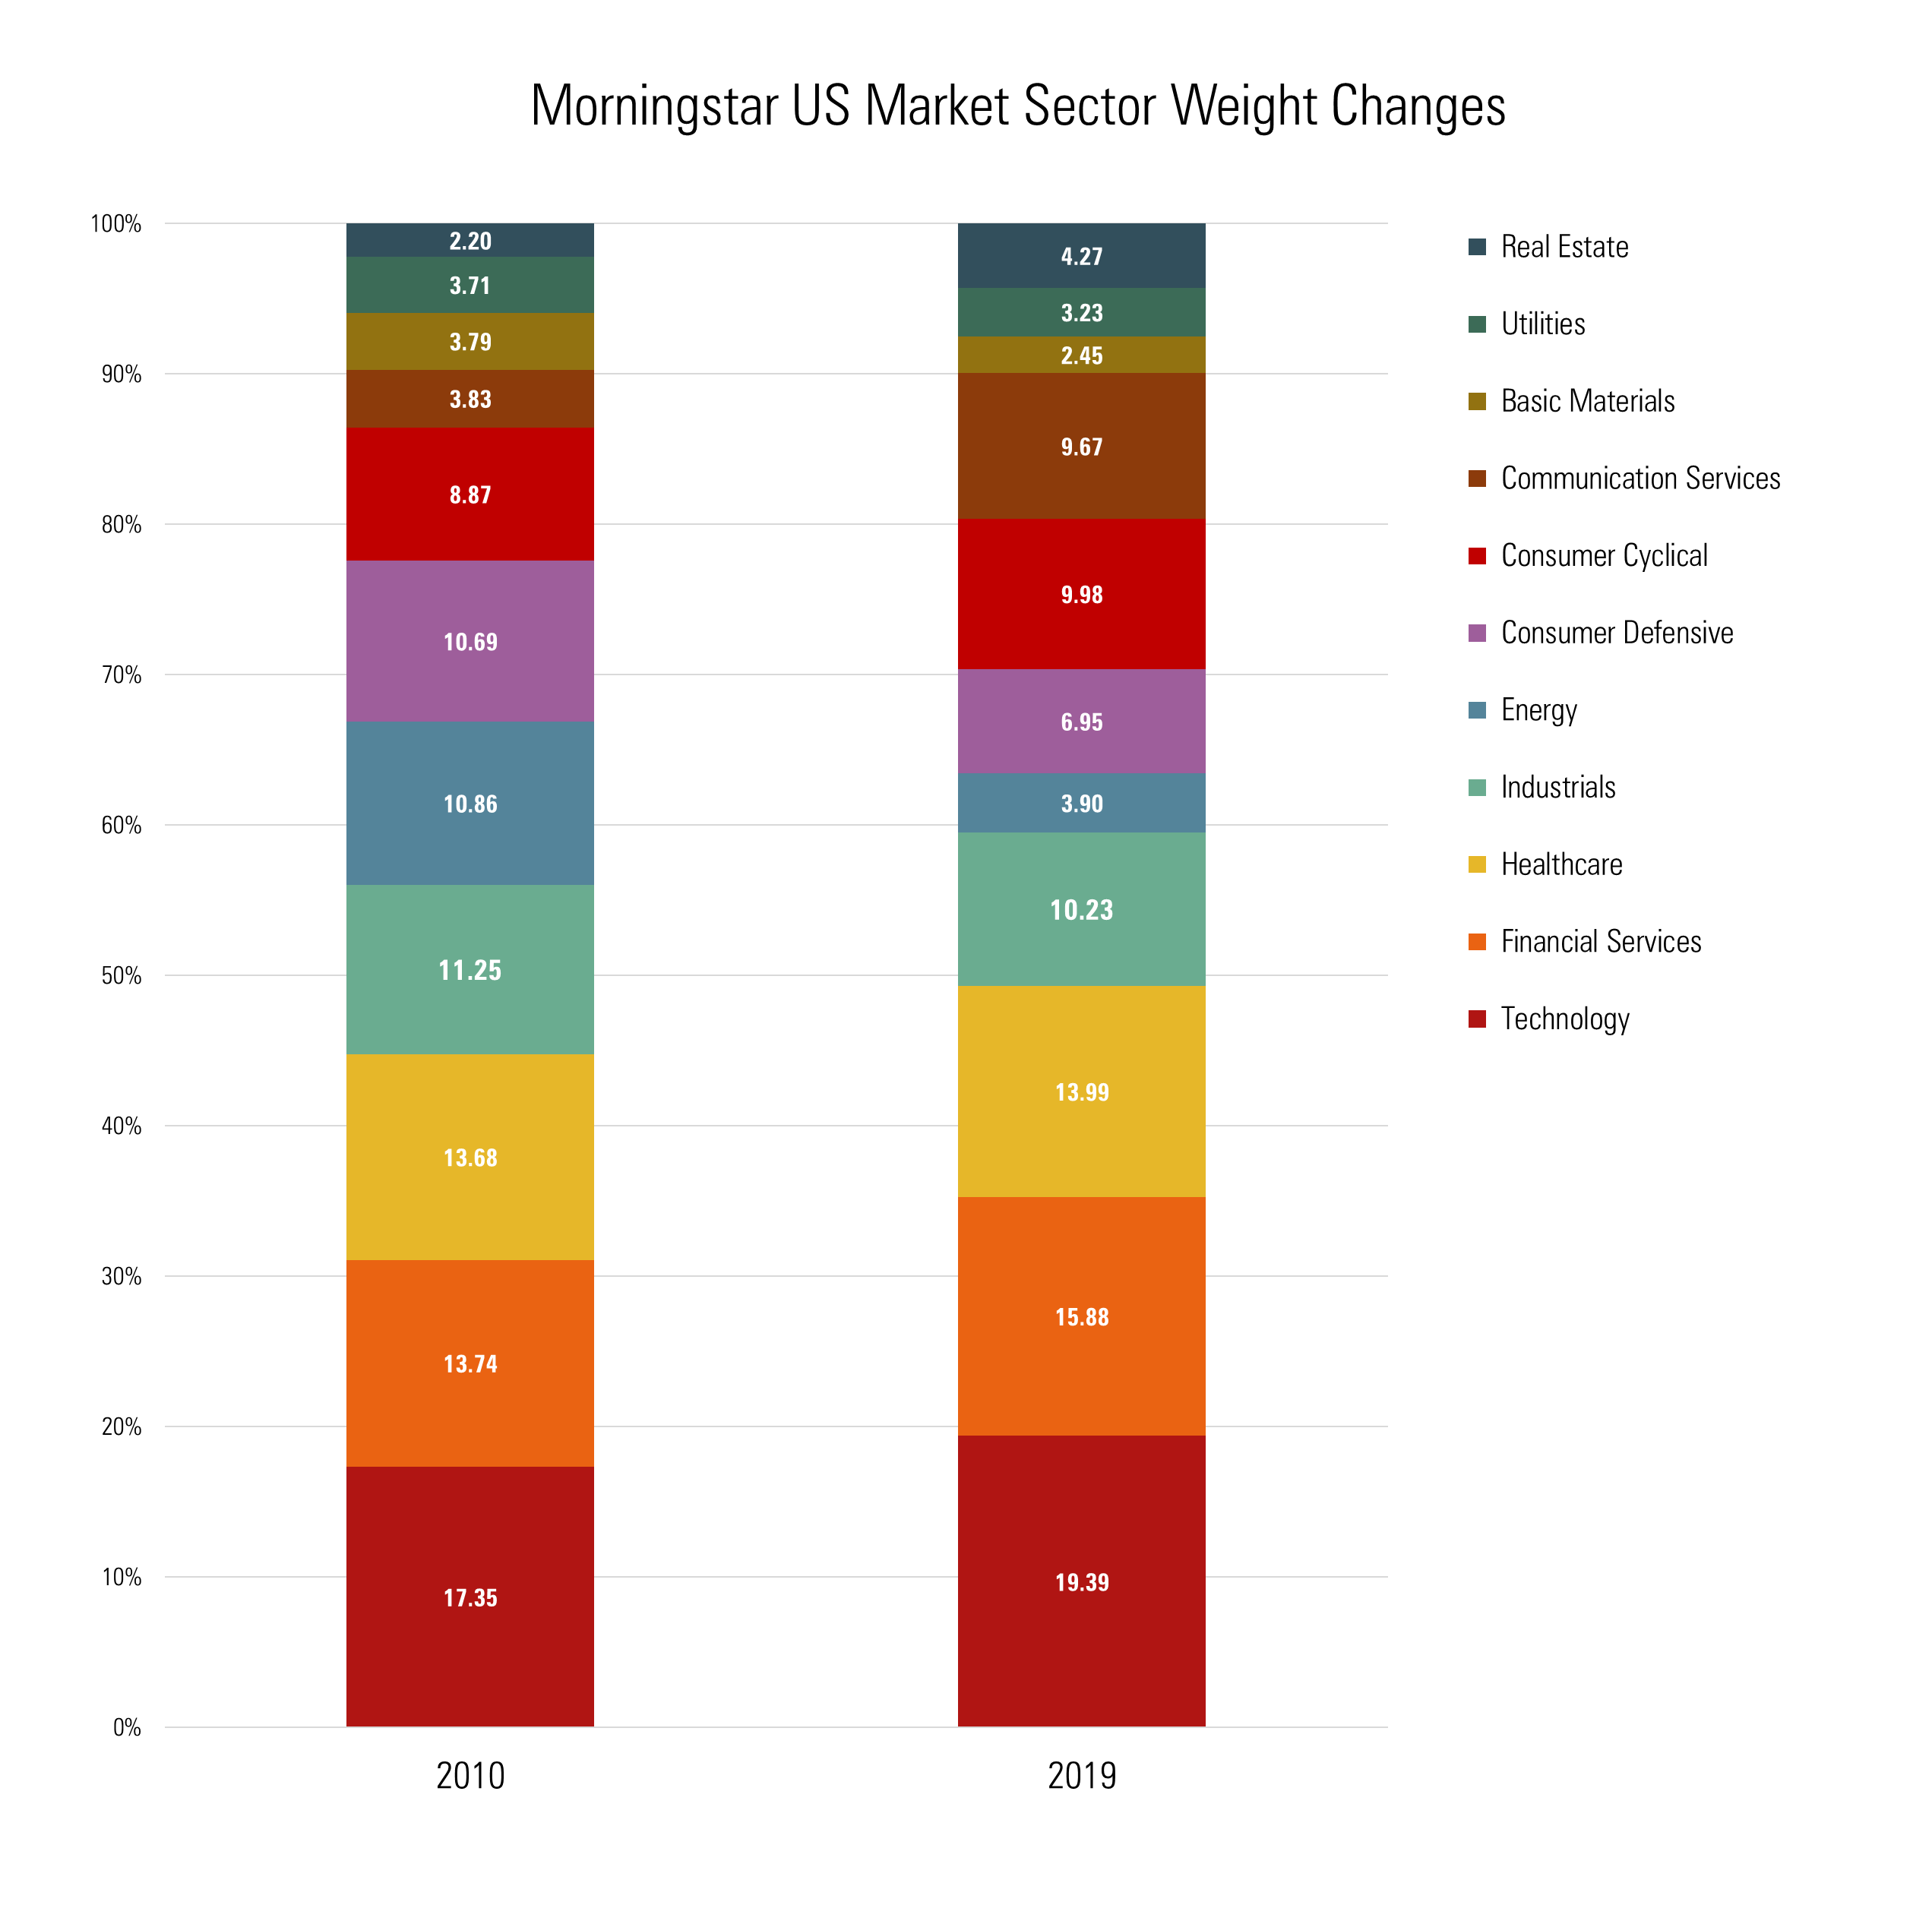
As a result of these performance trends, the overall composition of the stock market has shifted meaningfully from a decade ago. Investors with exposure to the broad stock market have an even bigger portion of their portfolios in technology stocks, much more in communications (which includes Google) and basic materials, and far less in industrials and energy stocks.
The outperformance of consumer cyclical and tech stocks led to another major feature of the 2010s' stock market landscape: the significant outperformance of growth over value.
Mid-value stocks may have posted the best annual return for any of the nine Morningstar Style Box indexes over the past 10 years, but for most of the decade, growth stocks have dominated by a wide margin. (Morningstar Direct and Office clients can check out our three-part series on the performance gap between growth and value funds.)
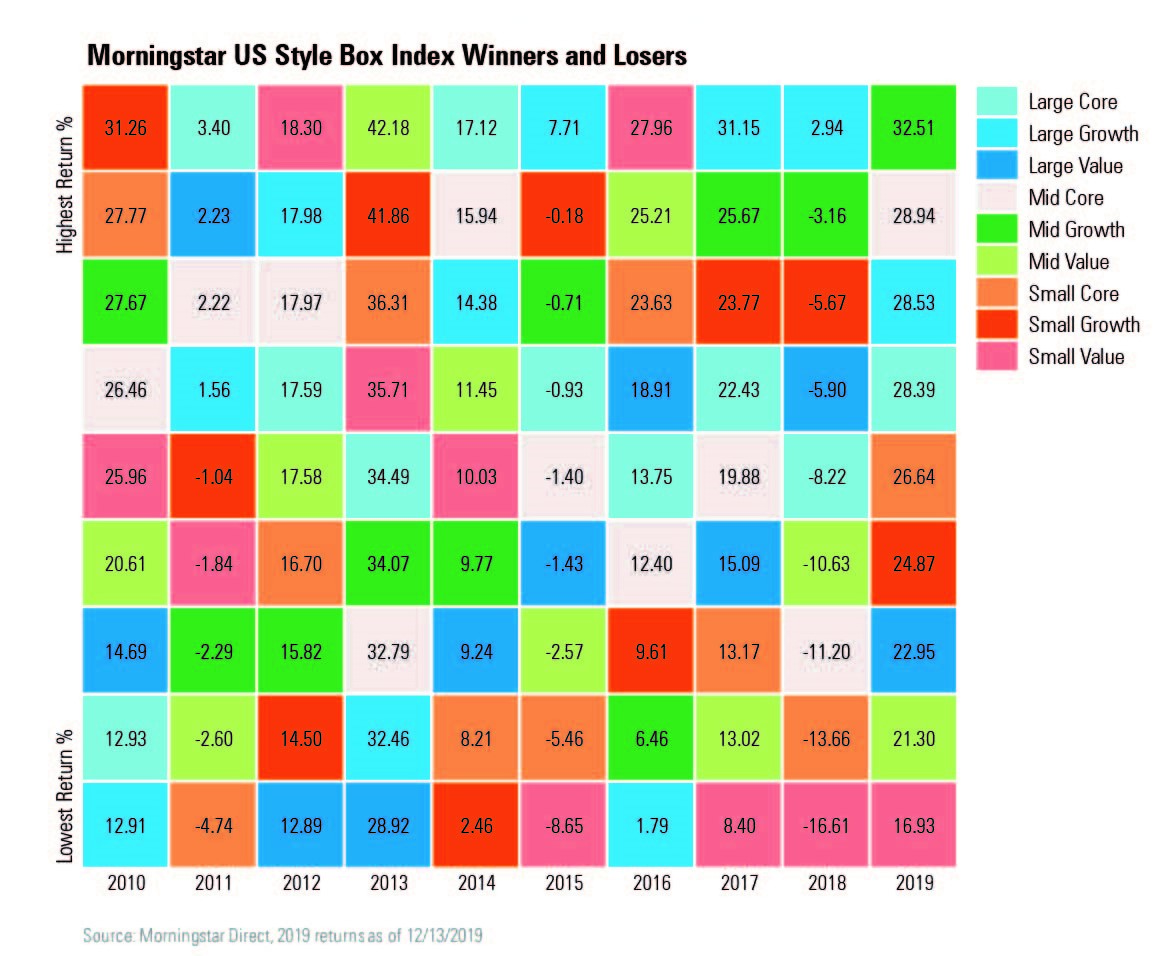
Small-value stocks had a couple of strong years--they performed the best of all style box categories in 2012 and 2016--but for most of the second half of the decade, those stocks have lagged by a wide margin.
/cloudfront-us-east-1.images.arcpublishing.com/morningstar/54RIEB5NTVG73FNGCTH6TGQMWU.png)
/cloudfront-us-east-1.images.arcpublishing.com/morningstar/ZYJVMA34ANHZZDT5KOPPUVFLPE.png)
/cloudfront-us-east-1.images.arcpublishing.com/morningstar/MNPB4CP64NCNLA3MTELE3ISLRY.jpg)
:quality(80)/s3.amazonaws.com/arc-authors/morningstar/8b2e267c-9b75-4539-a610-dd2b6ed6064a.jpg)
:quality(80)/s3.amazonaws.com/arc-authors/morningstar/ed529c14-e87a-417f-a91c-4cee045d88b4.jpg)