
What Investment Factors Work for Stocks?
Volatility, size, and momentum, say Morningstar's quantitative researchers.
/s3.amazonaws.com/arc-authors/morningstar/1aafbfcc-e9cb-40cc-afaa-43cada43a932.jpg)
Narrowing the Field This March, I wrote about the most extensive research on investment factors that has even been conducted. Two professors at Erasmus University of Rotterdam collaborated with a Dutch asset manager, Robeco, to evaluate how six factors--1) trend, 2) momentum, 3) value, 4) carry, 5) seasonality, and 6) betting against beta--have performed in various countries, for various assets (stocks, bonds, commodities, and currencies), for periods that extended as far back as 1799.
Broadly speaking, everything succeeded. Each item improved total returns for most asset classes, in most countries, over most periods. Admittedly, knowing such a thing is different than profiting from it: Often, transaction costs would have consumed the theoretical gains from employing such strategies. Nonetheless, it's helpful to understand the long-term influences on stock prices.
Morningstar recently published its own analysis of investment factors, using both a different factor list and a different database. Morningstar's inquiry is narrower than the Dutch paper's, evaluating just stocks, beginning in 2004. (That said, Morningstar's equity database is quite broad, covering the globe and containing 40,000 securities.) Restricting the view reduces generality, but it improves clarity.
1,000 Words Unlike with the Dutch study, Morningstar's results may be readily summarized.
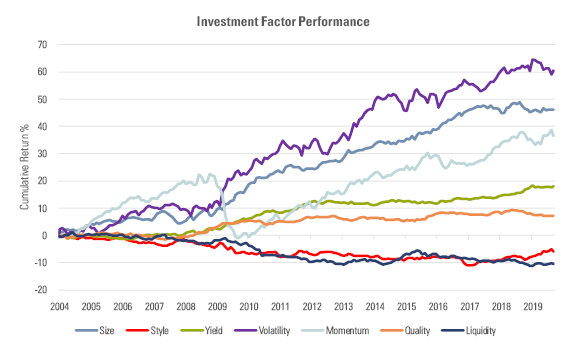
- Source: Morningstar
The lines depict each factor's excess return, calculated cumulatively over 16 years. (This sentence is deceptively simple, in that there are many ways to determine a stock's excess returns, and then many ways to convert those single-security results into an average. However, I will skip the details for this article. If you wish to have them, email me.)
The excess-return totals aren't particularly meaningful, because these factors cannot be purchased. They come attached to stocks, which in turn offer exposures to other factors. Best, then, to skip any attempt at precise analysis, gleaning instead from the patterns. Which factors have been most and least powerful? Which factors have been relatively persistent, and which have been erratic?
Volatility (Purple) The best-performing factor is perhaps the most confusing, because equity researchers don't often treat absolute volatility as an investment factor. They either evaluate relative volatility, which compares an individual security's volatility against that of a benchmark (that is, beta), or they skip the subject altogether. The Dutch article, for example, does not test volatility.
Morningstar's result is straightforward: Over time, volatile stocks (as measured by standard deviation of returns) have substantially outgained stocks that have posted stable prices. This is entirely in keeping with academic theory, which states that higher-risk securities carry higher expected returns. It would be strange if assets were priced otherwise.
This conclusion might seem to contradict the Dutch finding that investors thrive by "betting against beta"--that is, from owning securities that have relatively low volatility--but it does not. That's because Morningstar's study solely measures returns, while the Dutch authors risk-adjust their totals. Effectively, Morningstar says, "Higher volatility brings higher returns," while the professors counter with, "Yes, but those returns should be higher yet. They do not full compensate for the extra volatility."
Size (Dark Blue) This factor is sometimes called "small size," as the smaller a company's stock-market capitalization, the higher its size score. Such is the nomenclature, starting with Eugene Fama's and Ken French's signature research. The size factor effectively means the small-company factor: The belief that, all things being equal, secondary stocks outperform blue chips, presumably because of their higher risks.
That is indeed what Morningstar has found, although the size premium has disappeared over the past several years. It should be noted, however, that smaller-company stocks have performed better overseas than in the United States. That blue line would be significantly lower if it measured U.S. stocks only.
Momentum (Light Blue) Price momentum is perhaps the most persistent of all factors, occurring across all investment assets. Researchers struggle to explain why this is so, because investing in securities that have relatively high recent returns doesn't seem to be assuming greater risk, and the tactic is certainly no secret. If the strategy is not more dangerous, and is widely known, why does it generate extra profits?
That question has yet to be satisfactorily answered. Once again, momentum has triumphed, with the light blue line placing third in Morningstar's analysis. However, this showing came accompanied by quite a jolt, as momentum stocks shed 20 percentage points of excess returns within nine short months, from mid-2008 through early 2009. When this approach fails, it really fails.
Yield (Green) Managers who run high-income stock funds praise dividends. Morningstar's numbers support their claims. Higher-yielding stocks have indeed outgained their lower-yielding rivals, and steadily, too. The three previous factors each suffered temporary reversals, yet the yield factor never seems to lose ground. It either maintains its relative positionor gains moderately, as during 2008-12 and then again in 2016-18.
However, the gains from extra yield are modest. To briefly violate my instruction not to interpret the graph's numbers, the green line's final value is 18. That implies an excess return of about 1 percentage point per year that accrues to the yield factor. Terrific if one were guaranteed that amount, but it is of only moderate importance given that whatever portfolio a stock investor holds, its yield exposure will be only one factor among many.
Quality (Orange) Quality is a newcomer among factors, having initially been suggested as a possible explanation for stock returns in 1996, but not thoroughly tested until the next decade. It might be termed "The Buffett Thesis": the idea being that firms that possess particularly strong, high-quality businesses are undervalued. Their stocks are typically priced at a premium, but per the hypothesis, that premium is insufficient.
Perhaps so, but Morningstar hasn't found much fire beneath the smoke. The overall excess returns for high-quality stocks, defined by Morningstar as having above-average returns on equity and below-average debt ratios, have been only modestly positive. Once adjusted for county origin, sector exposure, and currency--as all Morningstar's factors are, through the calculations--the alleged benefit from quality all but disappears.
Style (Red) Of all investment factors, style has been the biggest dud. Morningstar's presentation muddies the waters by portraying the style return not as the value premium, which is customarily how things are done, but instead as the growth nonpremium. In other words, the red line on Morningstar's chart is positive when growth stocks outperform and negative when value stocks lead the way.
Overall, it finishes slightly below zero, indicating that, all things being equal, value stocks slightly beat growth stocks over the 16-year period. But ever so slightly. Value investing is typically regarded as being the most academically accepted strategy-- an approach that even the efficient-markets proponents have begrudgingly credited. Given that endorsement, this showing is a disappointment.
Liquidity (Darker Blue) Bringing up the rear is liquidity. Securities that are difficult to trade should enjoy excess returns, because they are less attractive to investors and therefore must provide higher returns to compensate for their undesirable feature. This is indeed what Morningstar's chart shows, because the darker-blue line representing higher liquidity heads downwards. In general, the less-liquid stocks prevailed.
But it wasn't much of a triumph. As explanatory factors go, volatility, size, and momentum were considerably more meaningful than liquidity.
Every stock mutual fund has exposure to these seven factors. Morningstar will be measuring and tracking those exposures through a new graphic called Factor Profiles. Friday's column will discuss how the Factor Profiles can be used when analyzing funds, as well as forming portfolios.
John Rekenthaler has been researching the fund industry since 1988. He is now a columnist for Morningstar.com and a member of Morningstar's investment research department. John is quick to point out that while Morningstar typically agrees with the views of the Rekenthaler Report, his views are his own.
The opinions expressed here are the author’s. Morningstar values diversity of thought and publishes a broad range of viewpoints.
:quality(80)/cloudfront-us-east-1.images.arcpublishing.com/morningstar/HCVXKY35QNVZ4AHAWI2N4JWONA.png)
:quality(80)/cloudfront-us-east-1.images.arcpublishing.com/morningstar/EGA35LGTJFBVTDK3OCMQCHW7XQ.png)
:quality(80)/cloudfront-us-east-1.images.arcpublishing.com/morningstar/LUIUEVKYO2PKAIBSSAUSBVZXHI.png)