
Strong-Performing Bond Managers May Have Better Odds of Future Success
This study finds evidence that bond managers' risk-adjusted gross-of-fee performance tends to persist.
/s3.amazonaws.com/arc-authors/morningstar/56fe790f-bc99-4dfe-ac84-e187d7f817af.jpg)
How much do active bond managers' performance records say about their odds of success in the future? Fund flows suggest investors give a lot of weight to past performance, often interpreting a strong record as a sign of manager skill that should continue to benefit fund investors. However, managers often take very different levels of risk from their benchmarks and each other. That can drive differences in returns that have nothing to do with skill. Risk-taking that pays off in one period may not continue to work in the next.
To better assess performance and whether that record is predictive of future performance, it's necessary to control for differences in exposure to common sources of risk and see if there's anything left over (alpha). This study attempts to do that using gross-of-fee performance from October 1994 through September 2019 for active managers in the intermediate core bond, intermediate core-plus, and high-yield bond Morningstar Categories. The full paper is now available.
Key Findings
- There is some evidence that bond managers with strong (gross-of-fee) risk-adjusted performance in the past are more likely to deliver strong performance in the future than those with poor past performance.
- Performance persistence varies by category. It appears to be the shortest in the investment-grade-focused intermediate core-bond category and the longest in the high-yield bond category.
- Funds with strong past performance records were more likely to survive and deliver positive alphas, and strong category-relative performance, than previous laggards.
- These results are consistent with differences in manager skill, but we can't rule out alternatives. The model developed for this study doesn't capture all the risks managers may be taking, and performance is noisy and is often affected as much by luck as skill.
- While past performance may offer some information about manager skill, it isn't prudent to blindly chase performance.
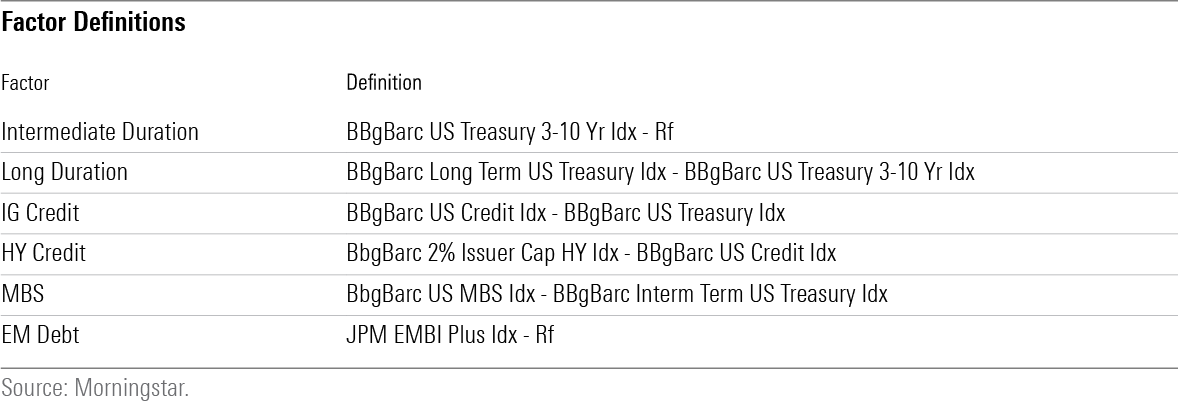
Gauging Performance To measure each fund's risk-adjusted performance (alpha), we constructed a multifactor regression model. This model attempts to explain each fund's return as a function of credit, interest-rate, and mortgage-backed security risk. Anything left over is attributed to manager skill.
The factor definitions are shown in the exhibit below. Because investors can get similar exposure to these factors through low-cost ETFs, active managers must do more to get credit for their performance.
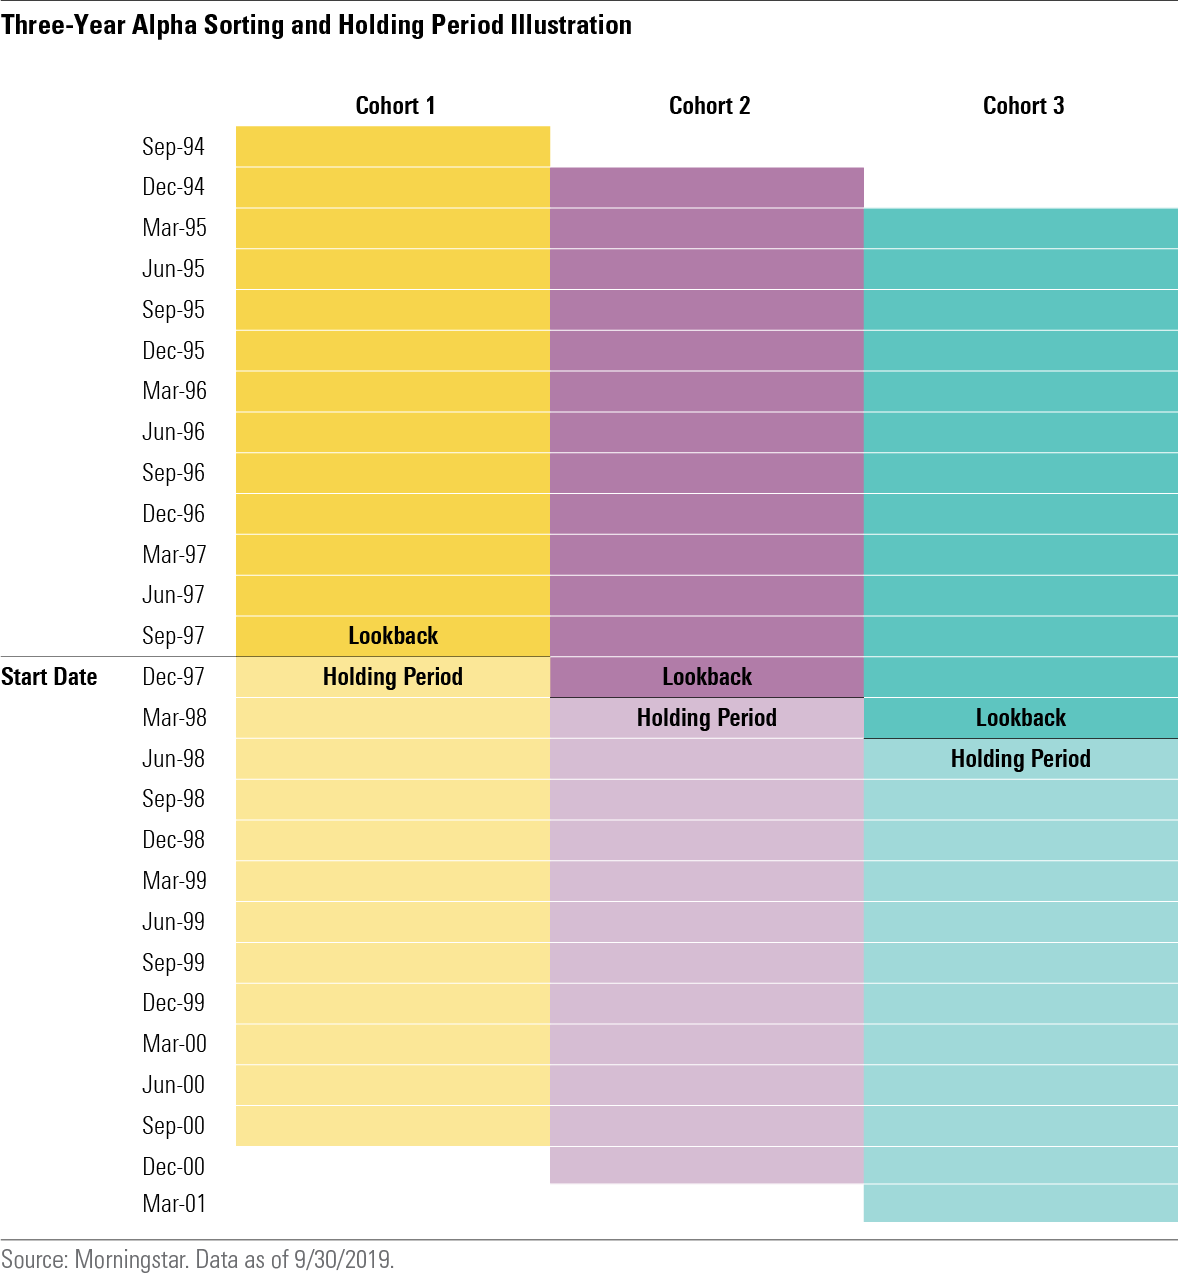
Setup Within each category, funds were sorted into quintiles at the end of each quarter based on their alphas, calculated using their gross-of-fee performance and the model outlined above, over the preceding 12 months. We then calculated the alphas for the funds in each quintile over the next 12 months and compared the average alphas in each quintile, averaging the results across all the rolling holding period windows in the sample. We also calculated the success rates for funds in each quintile, and transition matrices, which track where funds from each past performance quintile wound up at the end of the subsequent period. (The transition matrices are presented in the full paper.)
We replicated this analysis using two-, three-, four-, five-, and 10-year lookback and holding periods. In each case, the length of the lookback and holding period was the same. The diagram below illustrates how this works for the three-year sorting period.
Alpha Persistence There was evidence that alpha tended to persist, though the length of this persistence varied by category. The following exhibits show the average realized alphas for funds in each quintile after the sorting dates.
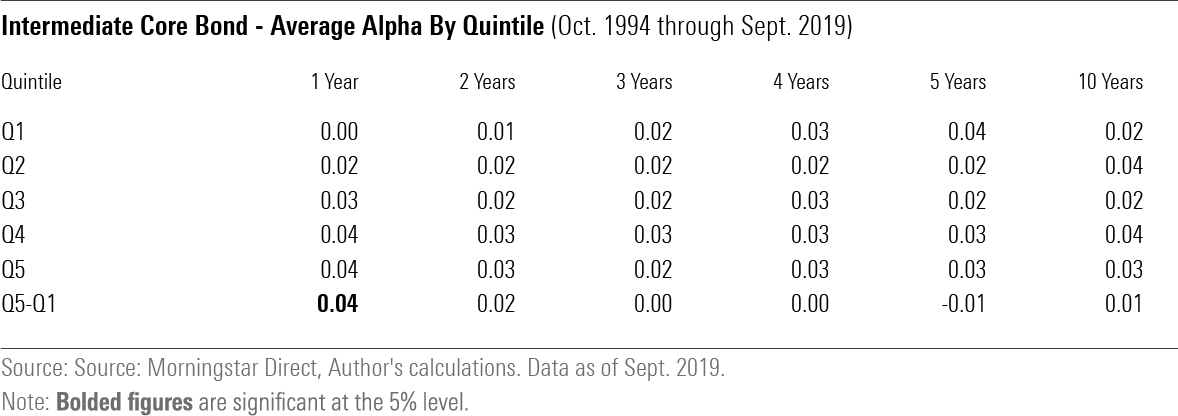
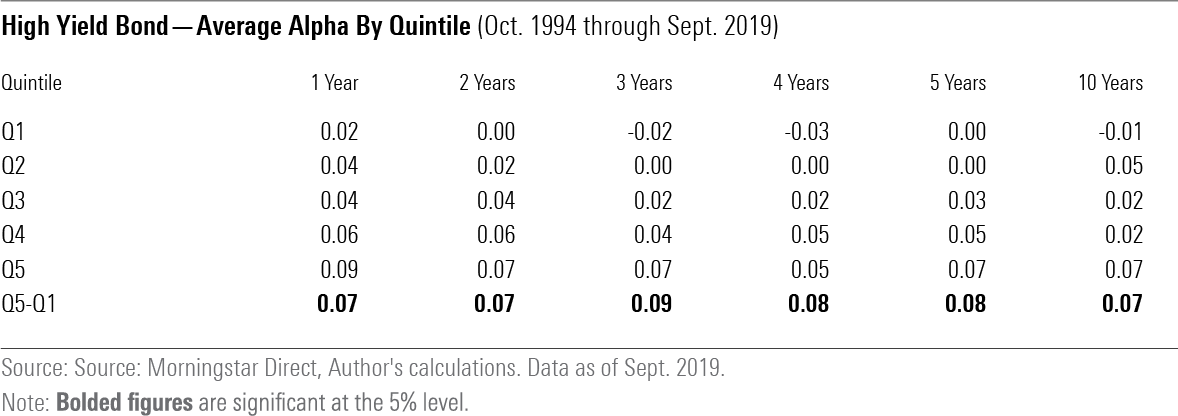
While the sample included nonsurviving funds, alphas could only be calculated for funds that survived at least one holding period. This introduces some survivorship bias, though it is less pronounced in the shorter windows. It's also worth noting that the bottom quintiles tended to have lower survivorship rates than the higher quintiles. So, if anything, these results likely overstate the realized performance of the bottom quintiles relative to the top, as nonsurviving funds tend to post subpar performance. This should make it harder to detect performance persistence.
In the intermediate core bond category, funds in the top alpha quintile (labeled "Q5") over the past year tended to continue to deliver higher alphas on average over the next year than their counterparts in the bottom quintile ("Q1"). However, outside of that short horizon, the differences between the alphas of the top and bottom quintiles weren't statistically significant, meaning there isn't compelling evidence that observed differences were due to anything other than chance.
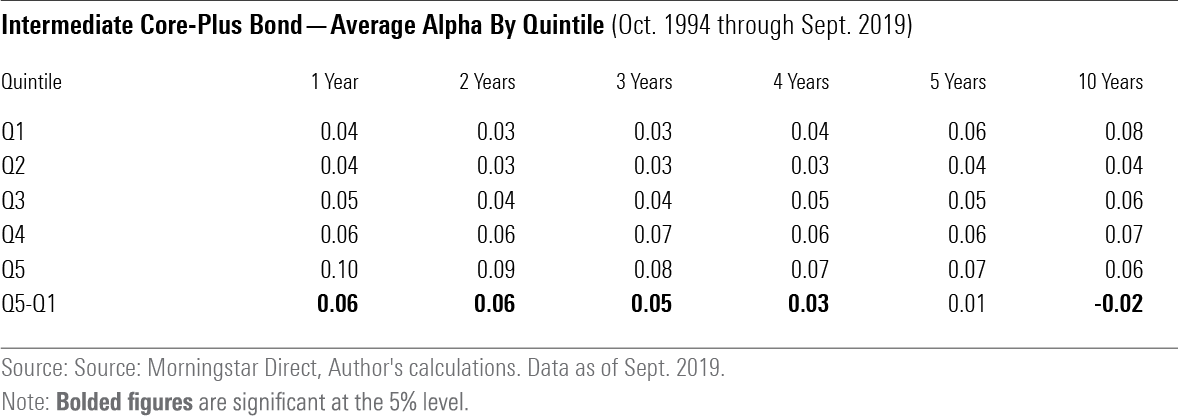
Performance tended to persist longer in the intermediate core-plus category. Here the top-performing funds over the past one, two, three, and four years continued to deliver higher alphas than the previous laggards over the subsequent funds' one-, two-, three-, four-, and five-year periods. The performance differences between the top and bottom quintiles were significant for the one- through four-year periods, but weren't statistically significant over the five-year period. And the laggards over the previous 10 years actually outperformed over the subsequent decade. That result was statistically significant, but it may be partially due to greater survivorship bias over the long holding window. Survivorship bias is likely a bigger issue in the intermediate core-plus category than in the other two categories because the only funds assigned to this category were those that were around at the end of May 2019.
Evidence of alpha persistence was the strongest in the high-yield category. Here, the past winners continued to deliver higher alphas than the past losers, on average, over all six periods evaluated. The differences between the average alphas of the top and bottom quintiles was also higher here than in the other two categories.
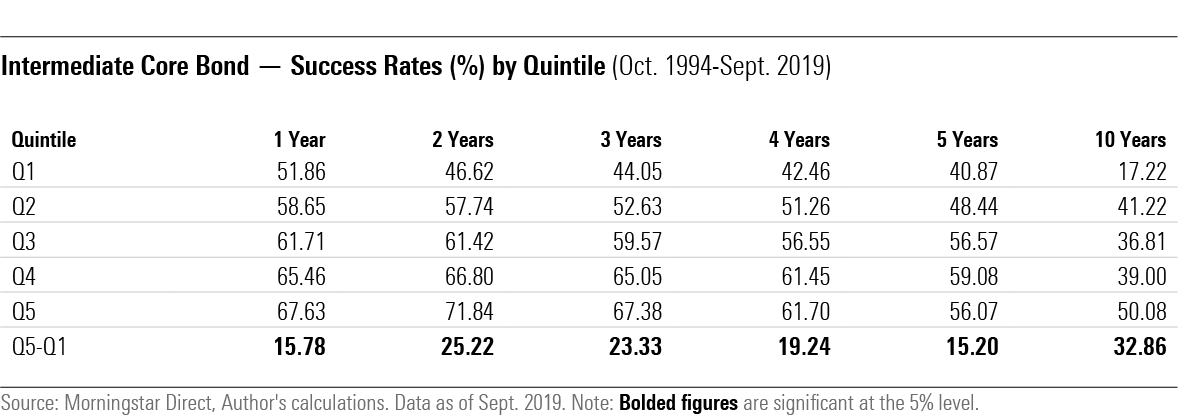
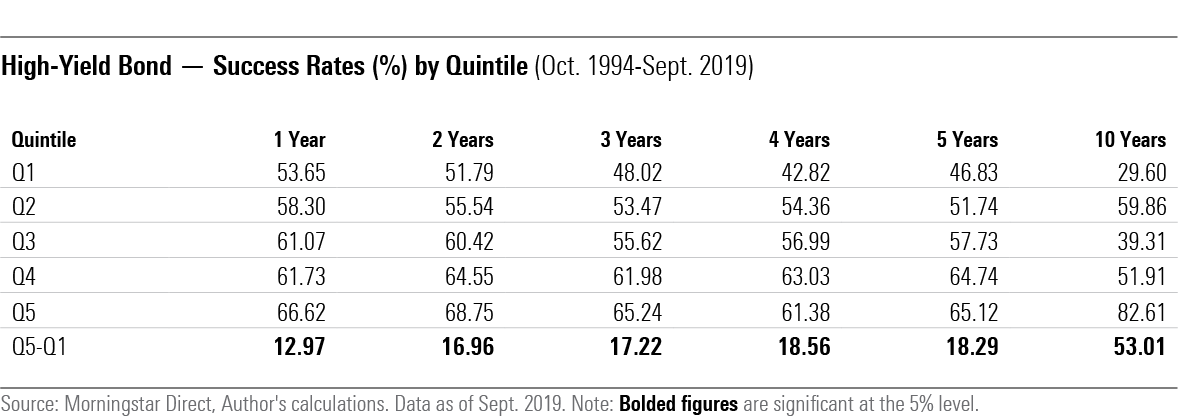
Success Rates Success rates more effectively removes survivorship bias than the average alpha comparisons and are less susceptible to outliers. To be counted as a success, a fund must survive and deliver a positive alpha in the holding period. The number of funds that meet these criteria are the numerator in the success rate calculation. The number of funds in each quintile at the start of the holding period is the denominator. The exhibits below show the success rates in each quintile for each category.
These results suggest that investors would have had better odds of picking future winners from the cohort of past winners than from the past losers.
The success rates of the top past performers were higher than the previous laggards across the board in the intermediate core and high-yield bond categories. Part of that owes to higher survivorship rates in the top quintiles than in the bottom, and that effect was more pronounced in the longer holding periods. Not surprisingly, there was a direct link between past performance and future survivorship rates. However, the differences in survivorship rates couldn't fully explain the differences in success rates, apart from the four- and five-year holding periods in the intermediate core category.
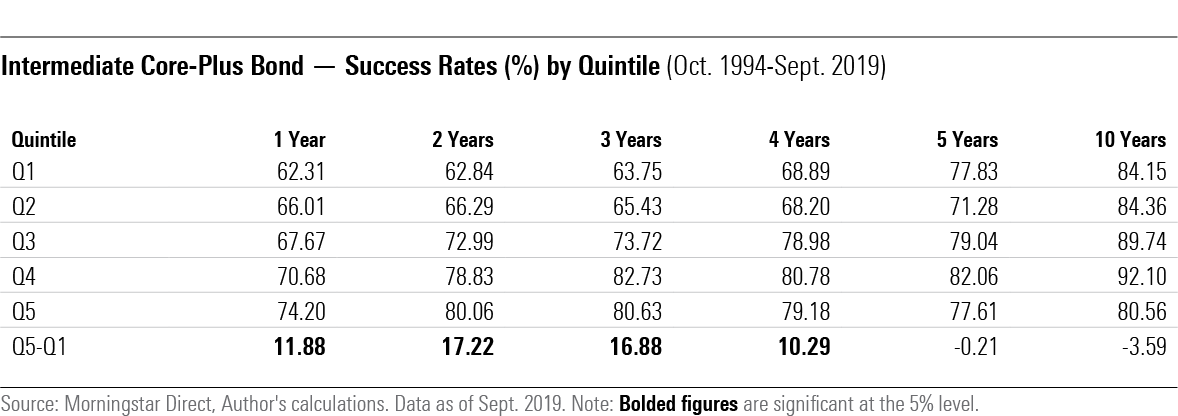
Consistent with the results of the alpha persistence analysis above, success rates for the top quintile of funds in the intermediate core-plus category were higher than the bottom over the one-, two-, three-, and four-year holding periods. The differences in success rates between the top and bottom quintiles weren't significant over the five- and 10-year holding periods. This category includes few nonsurviving funds, so survivorship rates didn't have a big impact on the success rates.
Taken together, the results of this study suggest that risk-adjusted (gross) performance, measured by alpha, tends to persist. That persistence appeared to last the longest in the high-yield bond category and the shortest in the investment-grade-focused intermediate core-bond category.
What's Behind This Persistence? The performance persistence found here is evidence of manager skill, but that's not the only possible explanation. Performance is a function of luck, skill, and risk-taking, and differences in any one of those could have influenced the results. This analysis attempted to control for differences in risk, but the model doesn't cover every risk managers might be taking, particularly in the high-yield bond market.
The incompleteness of the model might explain the observed performance persistence and the longer persistence in the intermediate core-plus and high-yield categories, where managers can take more types of risk. Yet, managers who consistently outperform after controlling for common risks are probably doing something right. Prudent risk management is the primary lever bond managers can pull to generate market-beating performance, and it requires skill. Most managers' main objective isn't risk avoidance, but rather identifying investments that offer attractive compensation for their risk.
Momentum could explain the short-term (one-year) performance persistence observed in each category. Strong-performing managers over the past year may have happened to own strong-performing securities that continue to outperform in the next year. However, momentum is a short-term phenomenon, and isn't a good explanation for the longer-term persistence observed in the intermediate core-plus and high-yield bond categories. There, skill is likely a bigger part of the story.
Don't Blindly Chase Performance While past performance may offer some information about manager skill, it isn't a good idea to blindly chase performance. It's more important to pay attention to risk, capacity, fees, and the quality of the management team and investment process. For example, a strong performance record could mean very little if there were a recent manager change or if it were the result of a single large bet and the manager doesn't have a consistent record of success with similar big bets. Look beyond the top-line numbers.
Adjusting for risk can go a long way toward improving comparability across funds in a category, but it many cases it's not feasible to control for all risks. Be wary of unusually high returns. That may be a sign of risk lurking beneath the surface.
Disclosure: Morningstar, Inc. licenses indexes to financial institutions as the tracking indexes for investable products, such as exchange-traded funds, sponsored by the financial institution. The license fee for such use is paid by the sponsoring financial institution based mainly on the total assets of the investable product. Please click here for a list of investable products that track or have tracked a Morningstar index. Neither Morningstar, Inc. nor its investment management division markets, sells, or makes any representations regarding the advisability of investing in any investable product that tracks a Morningstar index.
/d10o6nnig0wrdw.cloudfront.net/04-18-2024/t_34ccafe52c7c46979f1073e515ef92d4_name_file_960x540_1600_v4_.jpg)
/d10o6nnig0wrdw.cloudfront.net/04-09-2024/t_e87d9a06e6904d6f97765a0784117913_name_file_960x540_1600_v4_.jpg)
/cloudfront-us-east-1.images.arcpublishing.com/morningstar/T2LGZCEHBZBJJPPKHO7Y4EEKSM.png)
:quality(80)/s3.amazonaws.com/arc-authors/morningstar/56fe790f-bc99-4dfe-ac84-e187d7f817af.jpg)