
The Payoffs and Penalties of Investing in U.S. Active Funds
We look at recent research and results before fees.
/s3.amazonaws.com/arc-authors/morningstar/550ce300-3ec1-4055-a24a-ba3a0b7abbdf.png)
Here’s a question investors often ask: Where should I invest in active funds and where should I index?
For a good many, the answer is simple: They shouldn’t invest in active funds anywhere. Why? They lack the time to do the research or the resolve to stick with it when adversity sets in. Given this, they ought to focus on managing what they can--saving, diversifying, and minimizing expenses, including taxes, by indexing across the board. Even if that theoretically means forgoing some extra returns.
Other investors, however, will want to mix it up, and so the question becomes--how? We’ve taken up that question as part of our planned enhancement of the methodology behind the Morningstar Analyst Rating for funds. Specifically, we’ve sought to estimate the potential payoff and penalty associated with active investing across various investment styles before fees.
Study To estimate that payoff and penalty, we compiled the rolling 36-month, pre-fee capital asset pricing model alphas of all U.S. active funds in our database for the period January 2000 through Dec. 31, 2018. We derived each fund's pre-fee alpha by regressing its 36 gross monthly returns against the returns of the benchmark index assigned to its Morningstar Category. We repeated this for all funds--including those that had been merged or liquidated--and rolling periods, then grouped those alphas by Morningstar Category.
From there, we sorted each Morningstar Category's pre-fee alphas from smallest to largest to form a distribution, and then calculated the 25th and 75th percentile alphas. We subtracted the 75th percentile alpha from the 25th percentile to approximate the interquartile range of historical pre-fee alphas, and then divided that range by two to approximate the spread of alphas on either side of an assumed zero median. We refer to this figure as the semi-interquartile range, or IQR/2.
To illustrate, below is a plot of the distribution of rolling 36-month, pre-fee CAPM alphas of all active funds that have resided in the large-blend category since January 2000. (The chart cuts off the top and bottom percentiles of the distribution for presentation purposes.) The IQR is represented by the distance between the histogram’s red-shaded bars while the IQR/2 is marked by the narrower distance between the green-shaded bars.
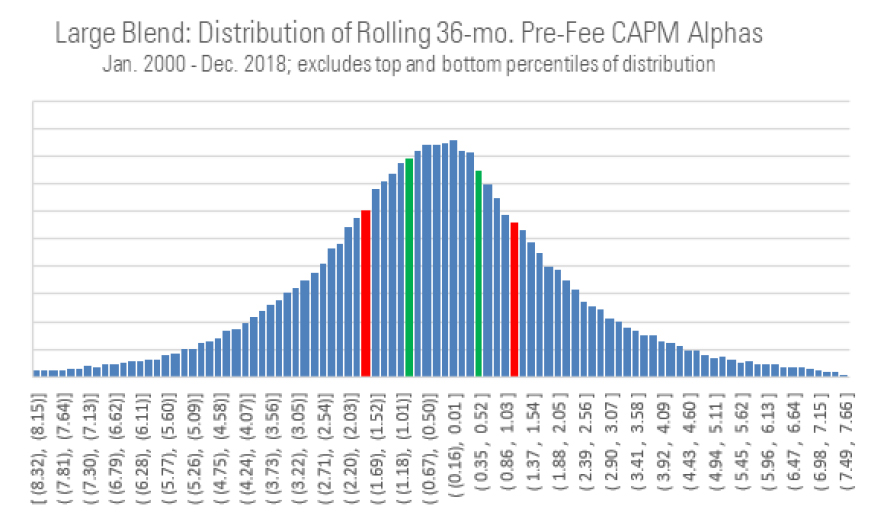
- source: Morningstar Analysts
A Morningstar Category’s IQR/2 yields a sense of how widely pre-fee alphas have ranged over time. Dispersion isn’t synonymous with success, of course, but it offers insights into the potential payoff or penalty associated with different investment styles. The wider the IQR/2, the bigger that payoff or penalty; the narrower the IQR/2, the smaller the payoff or penalty.
Findings We found that in some areas just about all active funds produced similar results before fees, while in others it varied considerably. In general, equity funds produced a wider range of pre-fee alphas than fixed-income funds, as shown in the exhibit below. The payoff/penalty was highest among small- and mid-cap equity funds and lowest in various kinds of investment-grade bond funds.
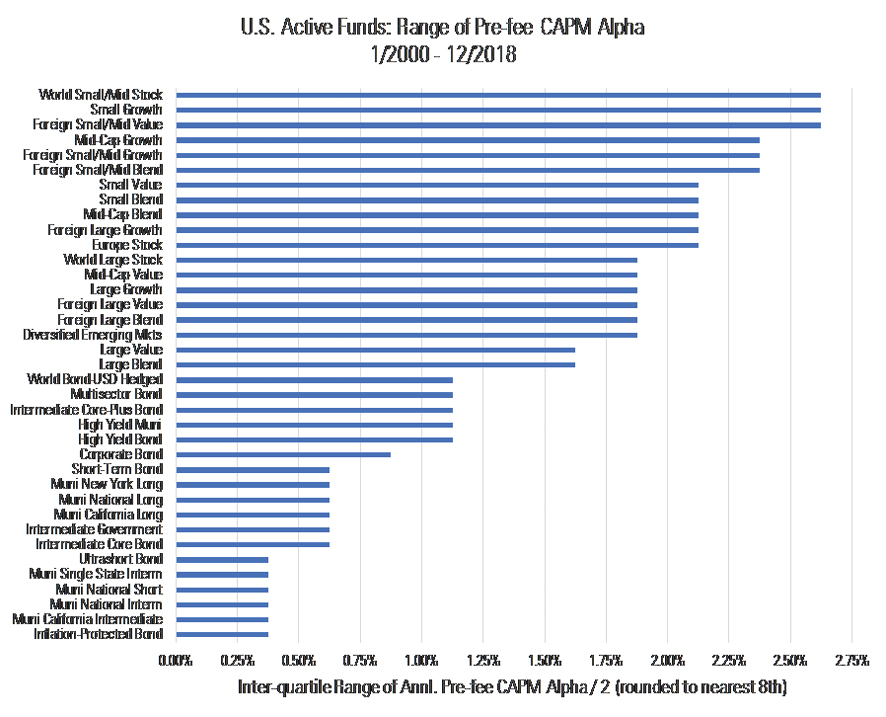
Source: Morningstar. The interquartile ranges shown above represent the difference between the 25th and 75th percentile pre-fee CAPM alphas (calculated vs. the relevant Morningstar Category benchmark index) based on a history of such alphas compiled for all rolling 36-month periods begun and ended between January 2000 and December 2018. We divide those interquartile ranges by two to approximate the spread of alpha around an assumed zero alpha. This yields a sense of how much pre-fee alpha has varied, excluding outliers, among active funds in a Morningstar Category over time. From this we can infer a sense of the potential payoff, and penalty, of investing in particular active investing styles. For further details, see the Study section below.
In this section, we tally up the IQR/2 for active funds in some of the largest Morningstar Categories that we cover.
U.S. Equity Among the nine U.S. equity-fund categories, the IQR/2 figures range from around 1.50% to more than 2.50% per year. Not surprisingly, pre-fee alpha ranged more widely among small- and mid-cap funds, reflecting the wider spread of outcomes associated with those more-volatile investment styles.
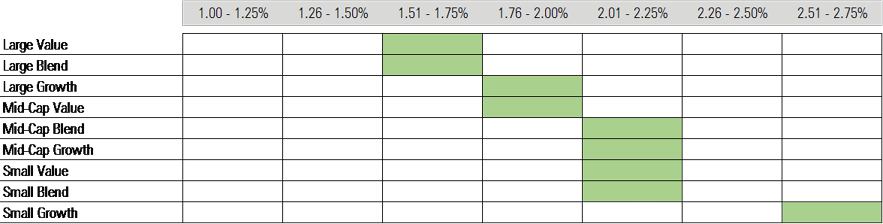
- source: Morningstar Analysts
Over time, the range of pre-fee alpha has been pinched narrower in every U.S. equity category, as shown in the time-lapse below.
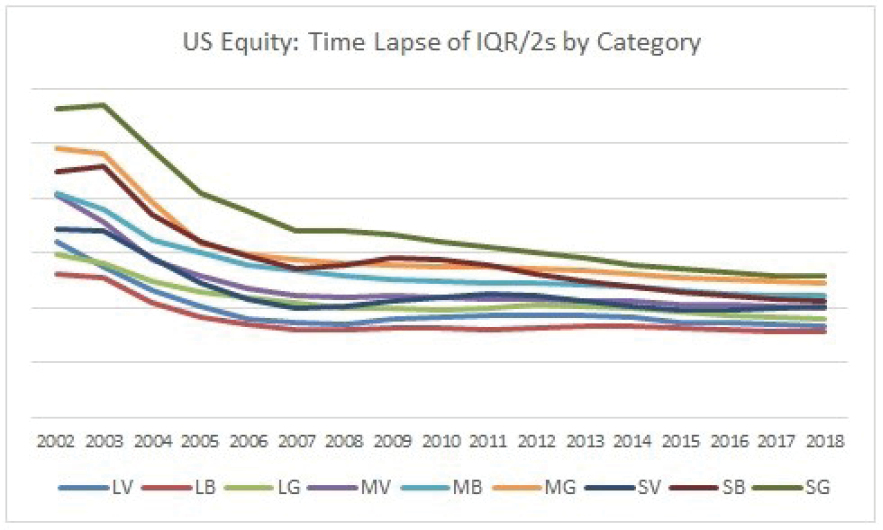
- source: Morningstar Analysts
International Equity In general, foreign-stock funds' pre-fee alphas were about as widely dispersed as U.S. stock funds. International small- and mid-cap funds experienced the widest range of pre-fee alphas.
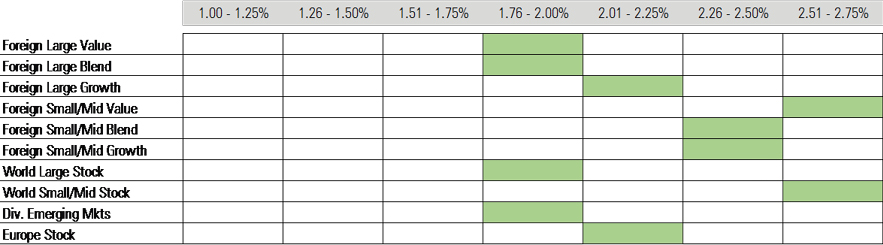
- source: Morningstar Analysts
As with U.S. stock funds, the IQR/2s of active foreign-stock funds have significantly narrowed over time, as shown below.
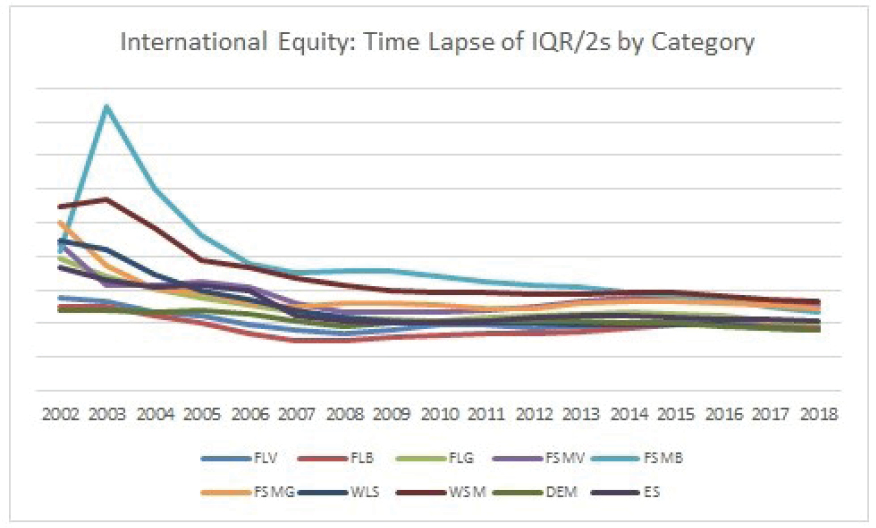
- source: Morningstar Analysts
Taxable Bond As expected, taxable-bond funds' pre-fee alphas haven't ranged as widely as those of stock funds. This reflects bond funds' lower volatility, which tends to limit the extent to which active fixed-income managers can add (or subtract value), as well as the homogeneity of some bond market segments.
Among taxable-bond funds, funds in riskier and more-freewheeling categories saw the widest range of pre-fee alphas. On the other hand, government-related bond funds’ alphas have tended to be pretty tightly clustered, explaining the narrower spread of pre-fee alpha in those categories.
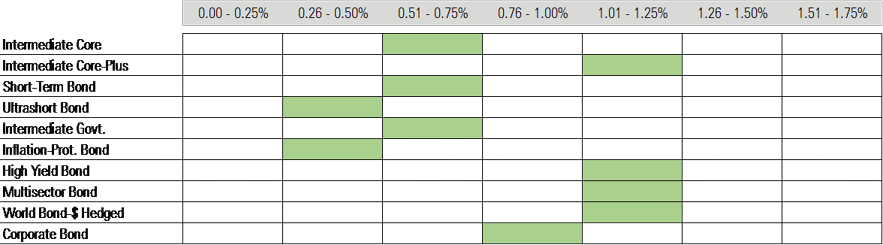
- source: Morningstar Analysts
Interestingly, the IQR/2s of active taxable-bond funds haven’t shrunk to the same degree as active equity funds. True, the range of pre-fee alpha among active high-yield bond funds has substantially narrowed, but other categories--intermediate-term bond core, short-term bond, and world bond-dollar hedged--have more or less held steady.
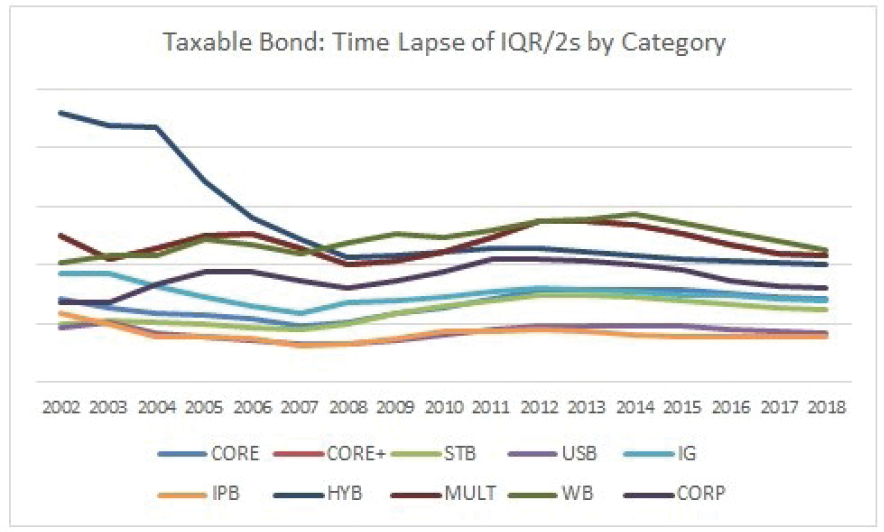
- source: Morningstar Analysts
Municipal Bond Muni-bond funds' pre-fee alphas were spread about as widely as some of the more conservative taxable-bond fund categories, with IQR/2s of 0.25% to 0.75% per year being the norm. The outlier was the high-yield muni category, where pre-fee alphas ranged more widely, owing to the loftier credit risk of the municipal bonds in which such funds invest.
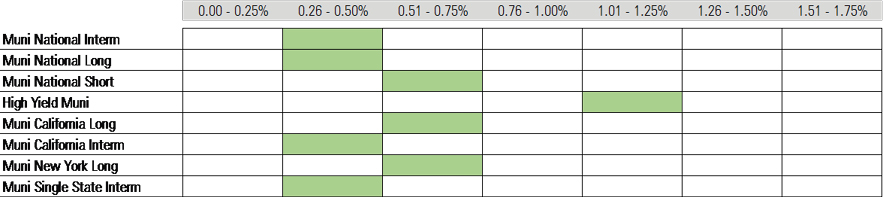
- source: Morningstar Analysts
The IQR/2s of active municipal bond funds have been remarkably stable. In fact, they rose across every category shown from January 2000 to December 2018, with active high-yield muni-bond funds experiencing the biggest jump.
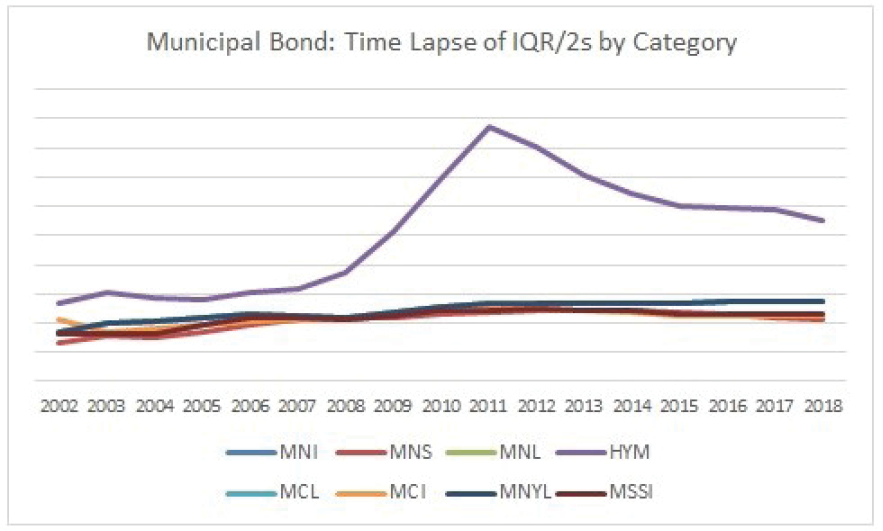
- source: Morningstar Analysts
Interpreting the Findings At first glance, these findings suggest one should target active funds in categories where there has been a larger potential payoff to active investing and to avoid those where the payoff has been smaller. For instance, we found the potential payoff of successful active foreign small-cap funds exceeded 2.50% per year. Who wouldn't want to reap that kind of excess return?
The findings also yield insights into how much to pay for active funds across various investment styles. For instance, in categories where the potential pre-fee payoff has been less, then it stands to reason fees would also need to be correspondingly lower in order to leave any room to generate alpha after fees. In that sense, these findings might help investors to estimate an appropriate fee to pay.
But some caveats apply as well. While the potential payoff of active investing looks tantalizing in some categories, an investor still must successfully identify and choose those skilled managers in advance to capture it. This is especially important to keep in mind with respect to categories or styles that involve very expansive or heterogeneous markets. In these cases, while the manager has greater theoretical opportunity to add value, it can also be more difficult to assess how much risk he’s taking, let alone how prudently. Given this, the potential reward should be weighed against the risk of choosing wrong.
An investor must be able to live with the investment. Some of the categories with the biggest potential payoffs are volatile, and investors have shown a propensity to bail amid underperformance or market turbulence. This might argue against going active in volatile equity categories, which can rattle investors more easily, and argue for active fixed income, where the payoff has been less but also comparatively more stable.
While we found a positive relationship between categories’ range of funds’ pre-fee alphas and the median alphas in those categories, they weren’t always in lock step. For instance, the median pre-fee alpha has been modestly negative across the three U.S. large-cap stock categories over time, likely explaining the increasing difficulty active U.S. equity fund managers have had beating their benchmarks. Thus, while dispersion of pre-fee alpha can yield a directional sense of the potential payoff to active investing, it is still important to consider it a broader context, pairing it with other research like data on active-fund success rates in different investing styles. We set that data forth in the “Active/Passive Barometer” study that we publish several times each year.
Our research finds the potential payoff/penalty of active investing--as measured by the dispersion of active funds’ pre-fee CAPM alphas within their Morningstar Categories--is larger among equity funds than fixed-income funds. Within equity, we found that active small- and mid-cap funds offered the largest potential payoff, with dispersion of pre-fee alpha widest of all among foreign small-cap funds. That said, the range of pre-fee outperformance has been narrowing among equity funds over time, whereas it has been relatively stable among fixed-income funds.
Investors can leverage these findings in order to differentiate the potential payoff of active investing in various Morningstar Categories and investment styles, and to calibrate an appropriate fee to pay for active funds in certain instances. That said, investors considering these findings should be mindful of the trade-offs involved in trying to capture the large potential pre-fee payoffs of active investing in certain styles. These include the risk of being wrong or of not being able to stick with the fund through thick and thin.
/cloudfront-us-east-1.images.arcpublishing.com/morningstar/ZKOY2ZAHLJVJJMCLXHIVFME56M.jpg)
/cloudfront-us-east-1.images.arcpublishing.com/morningstar/IGTBIPRO7NEEVJCDNBPNUYEKEY.png)
/cloudfront-us-east-1.images.arcpublishing.com/morningstar/HDPMMDGUA5CUHI254MRUHYEFWU.png)
:quality(80)/s3.amazonaws.com/arc-authors/morningstar/550ce300-3ec1-4055-a24a-ba3a0b7abbdf.png)