
These U.S. Sectors Are More Global Than You Think
Which areas of the market may be more vulnerable to ongoing trade tensions?
/s3.amazonaws.com/arc-authors/morningstar/11b6f4c1-25d3-4bbc-8deb-d1c1aeedcce7.jpg)
As companies begin issuing third-quarter earnings this week, investors will be watching to see what impact ongoing trade tensions will have on results and guidance.
A business may be domiciled in the United States, but that gives little insight into where its revenue is being generated. Take Amazon.com AMZN, for instance: 28% of its second-quarter 2019 sales were generated by its international division.
Using Morningstar data, we’ve dug into the global revenue sources of various sectors, which provides some insight into which areas of the market may be more vulnerable to ongoing trade tensions.
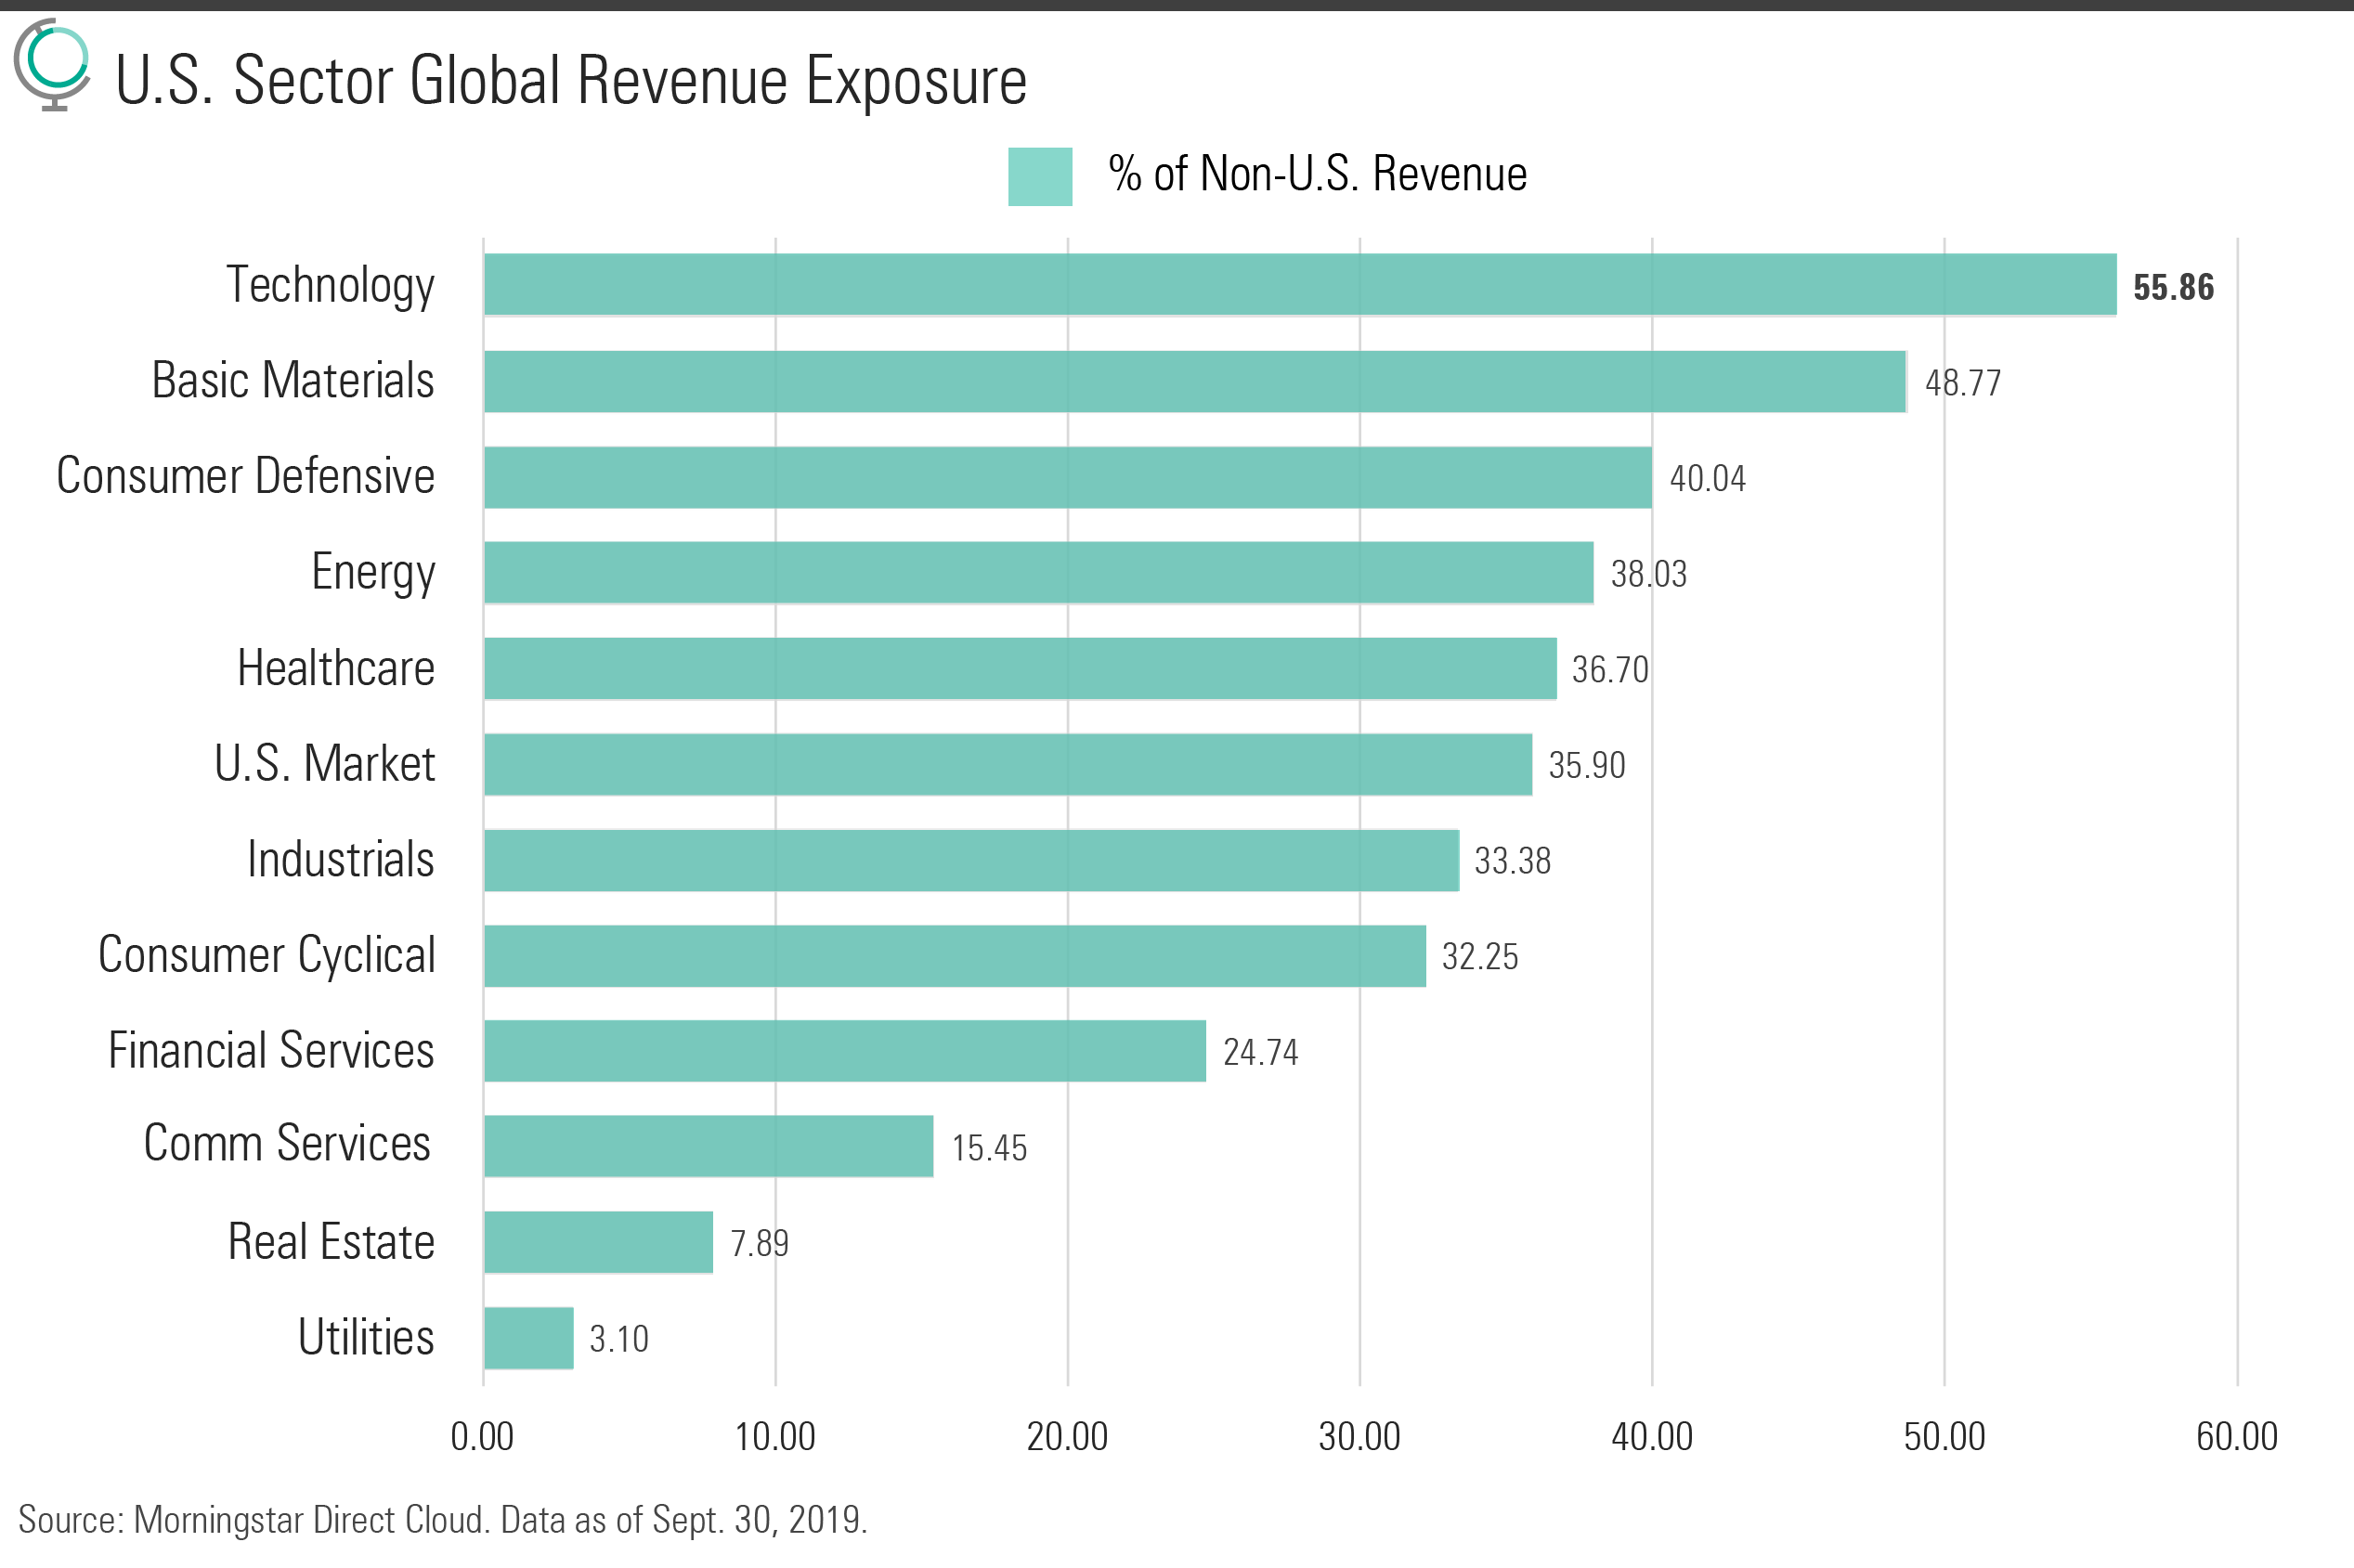
The technology, basic materials, and consumer defensive sectors generate the largest portion of their revenues abroad. More than 50% of the tech sector's revenue stream stems from non-U.S. regions. The basic materials sector is close behind at 48.77%, followed by consumer defensive at 40.04%. Notably, the U.S. market as a whole generates more than 35% of its revenue abroad.
Let’s dive deeper into the sectors with highest percentage of revenue generated abroad. First up, technology.
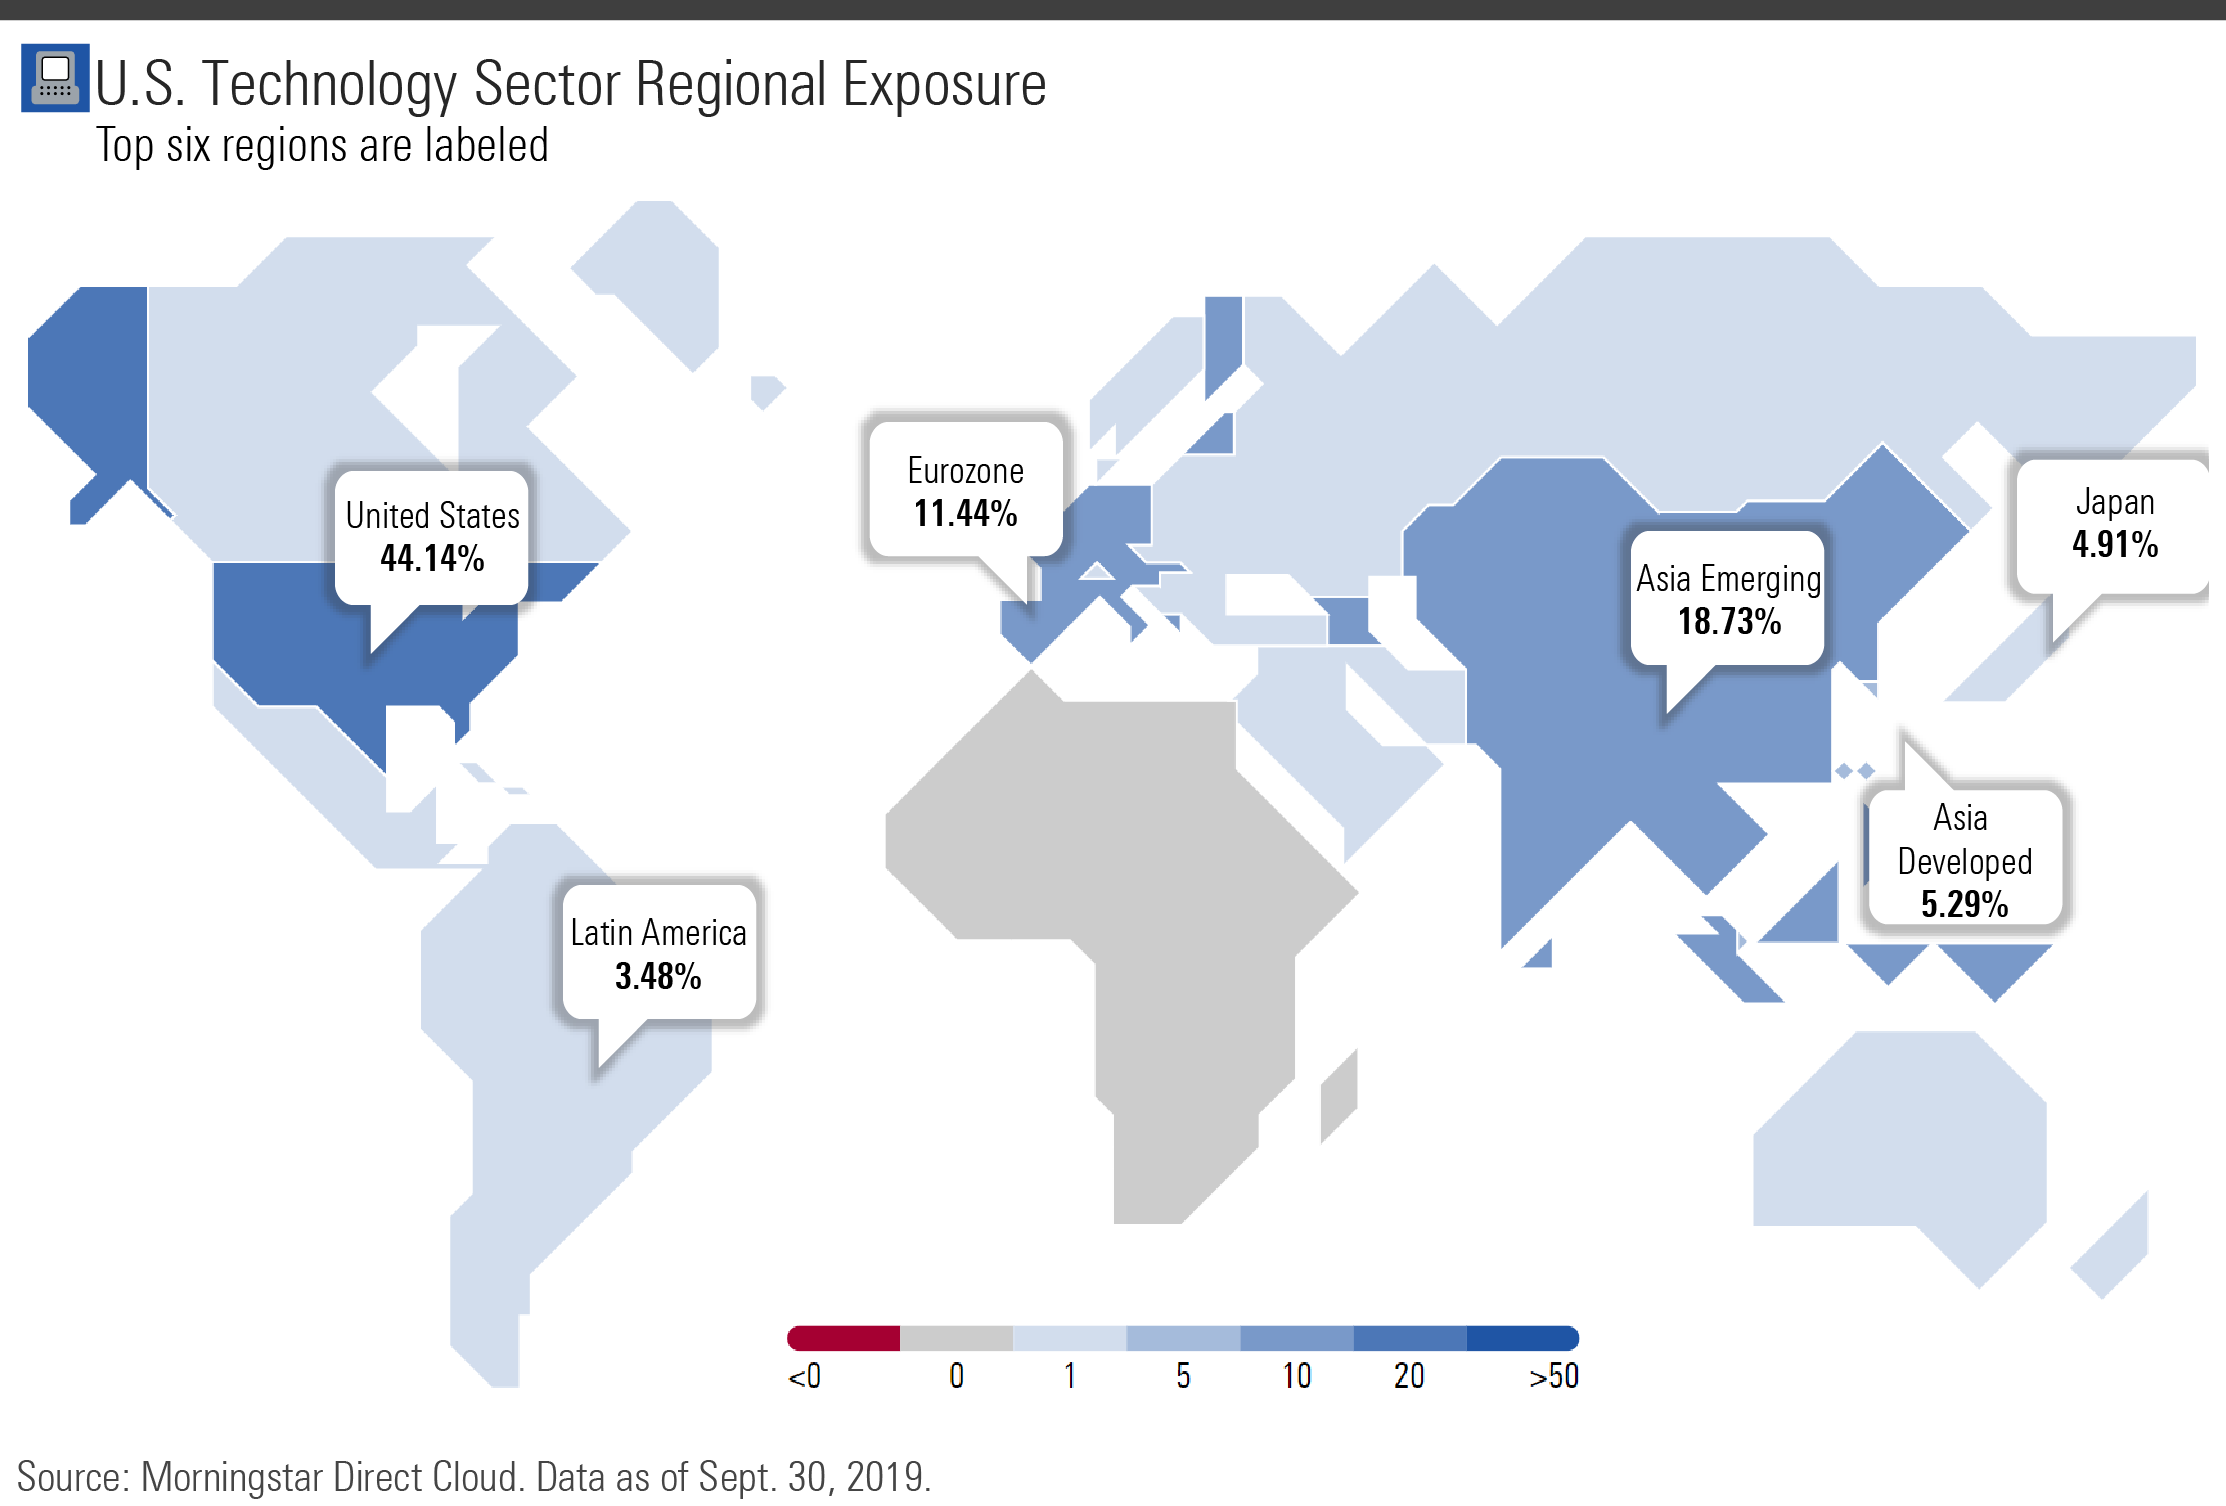
The color scale at the bottom of the graphic shows how to interpret the colors; the darker the blue, the more revenue is generated from a region. The tech sector’s revenue stream clusters around Asia: At 18.83%, Asia Emerging is the top region right after the U.S. Asia Emerging includes countries such as China, Malaysia, Thailand, and Vietnam. The Asia Developed region, at 5.29%, includes markets like Singapore, South Korea, Hong Kong, and others. Japan, a country that’s also considered a stand-alone region, generates 4.91% of the U.S. tech sector’s revenue. These Asian regions combined makes up 28.93% of the tech sector’s revenue stream.
The eurozone and Latin America are also part of the top regions that generate revenue for the tech sector. The eurozone, which includes Germany, France, Italy, and others, stands at 11.44%. Latin America, covering countries like Brazil, Mexico, and Colombia, comes in at 3.48%.
Now let’s take a look at revenue exposure by countries.
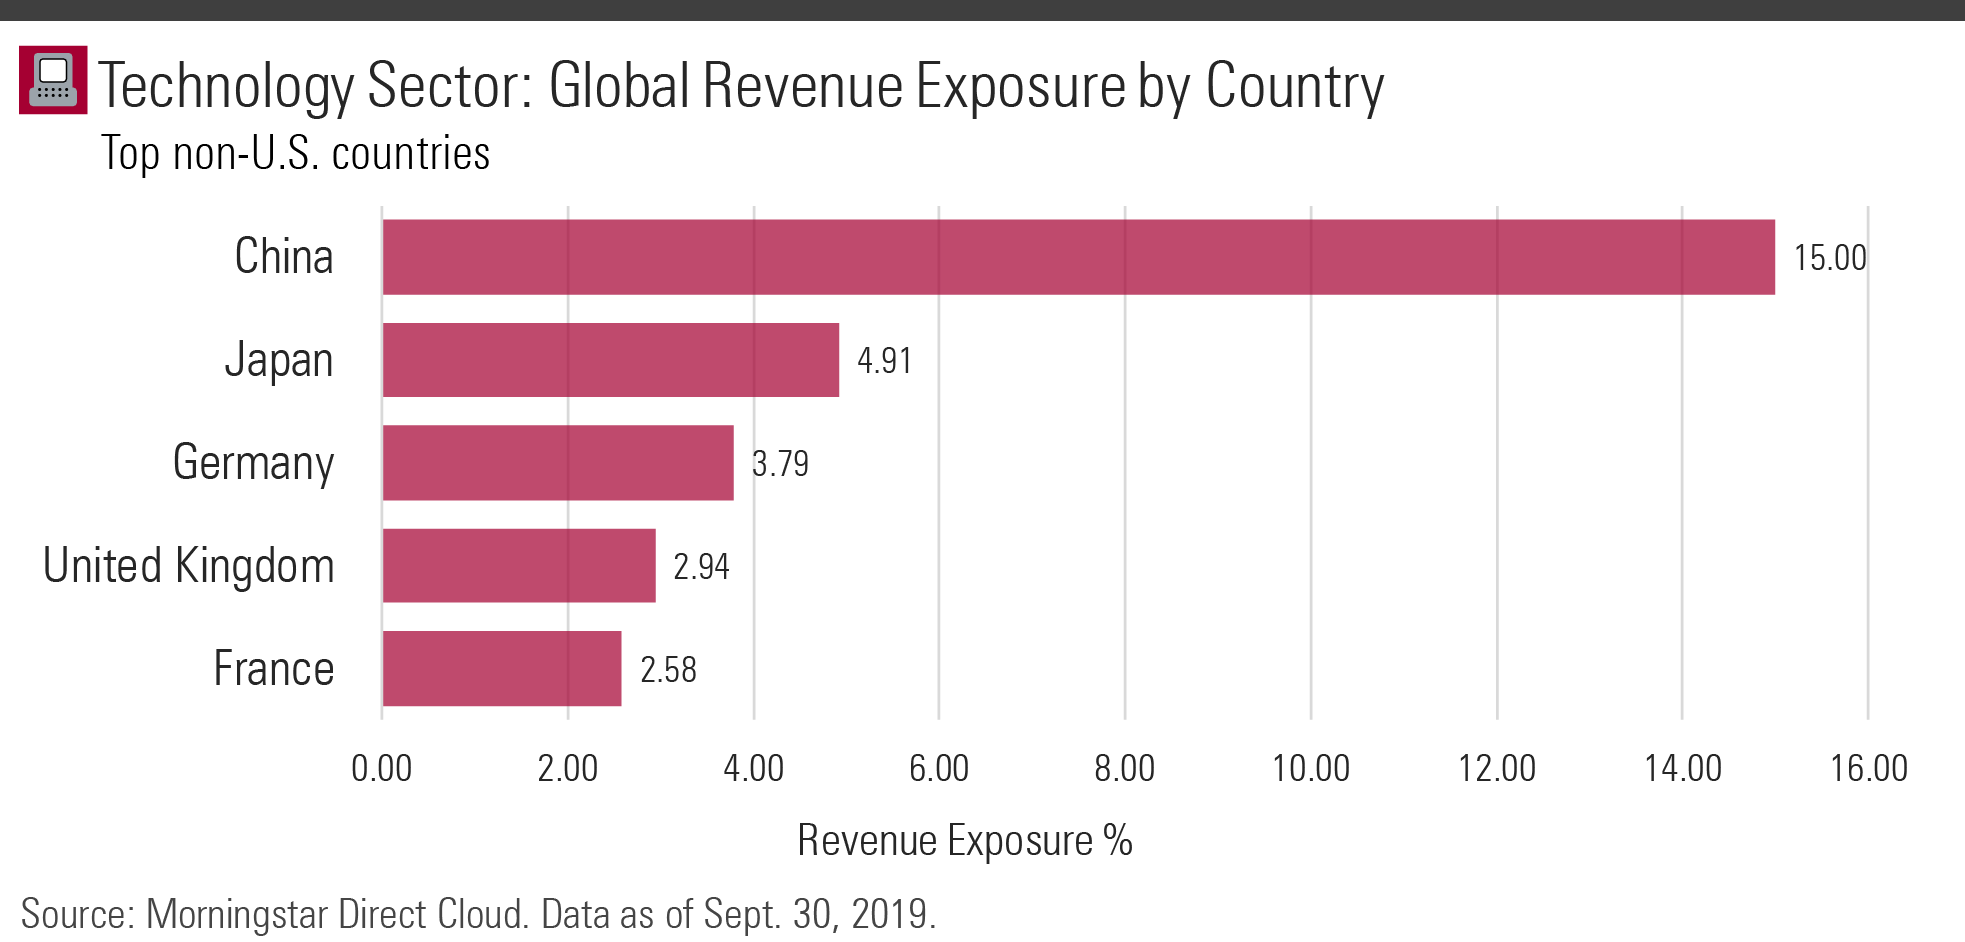
China stands out by far, accounting for 15% of the tech sector’s revenue. Japan comes in second, but with less than one third of China’s number, at 4.91%.
Moving on to basic materials, we see a similar distribution.
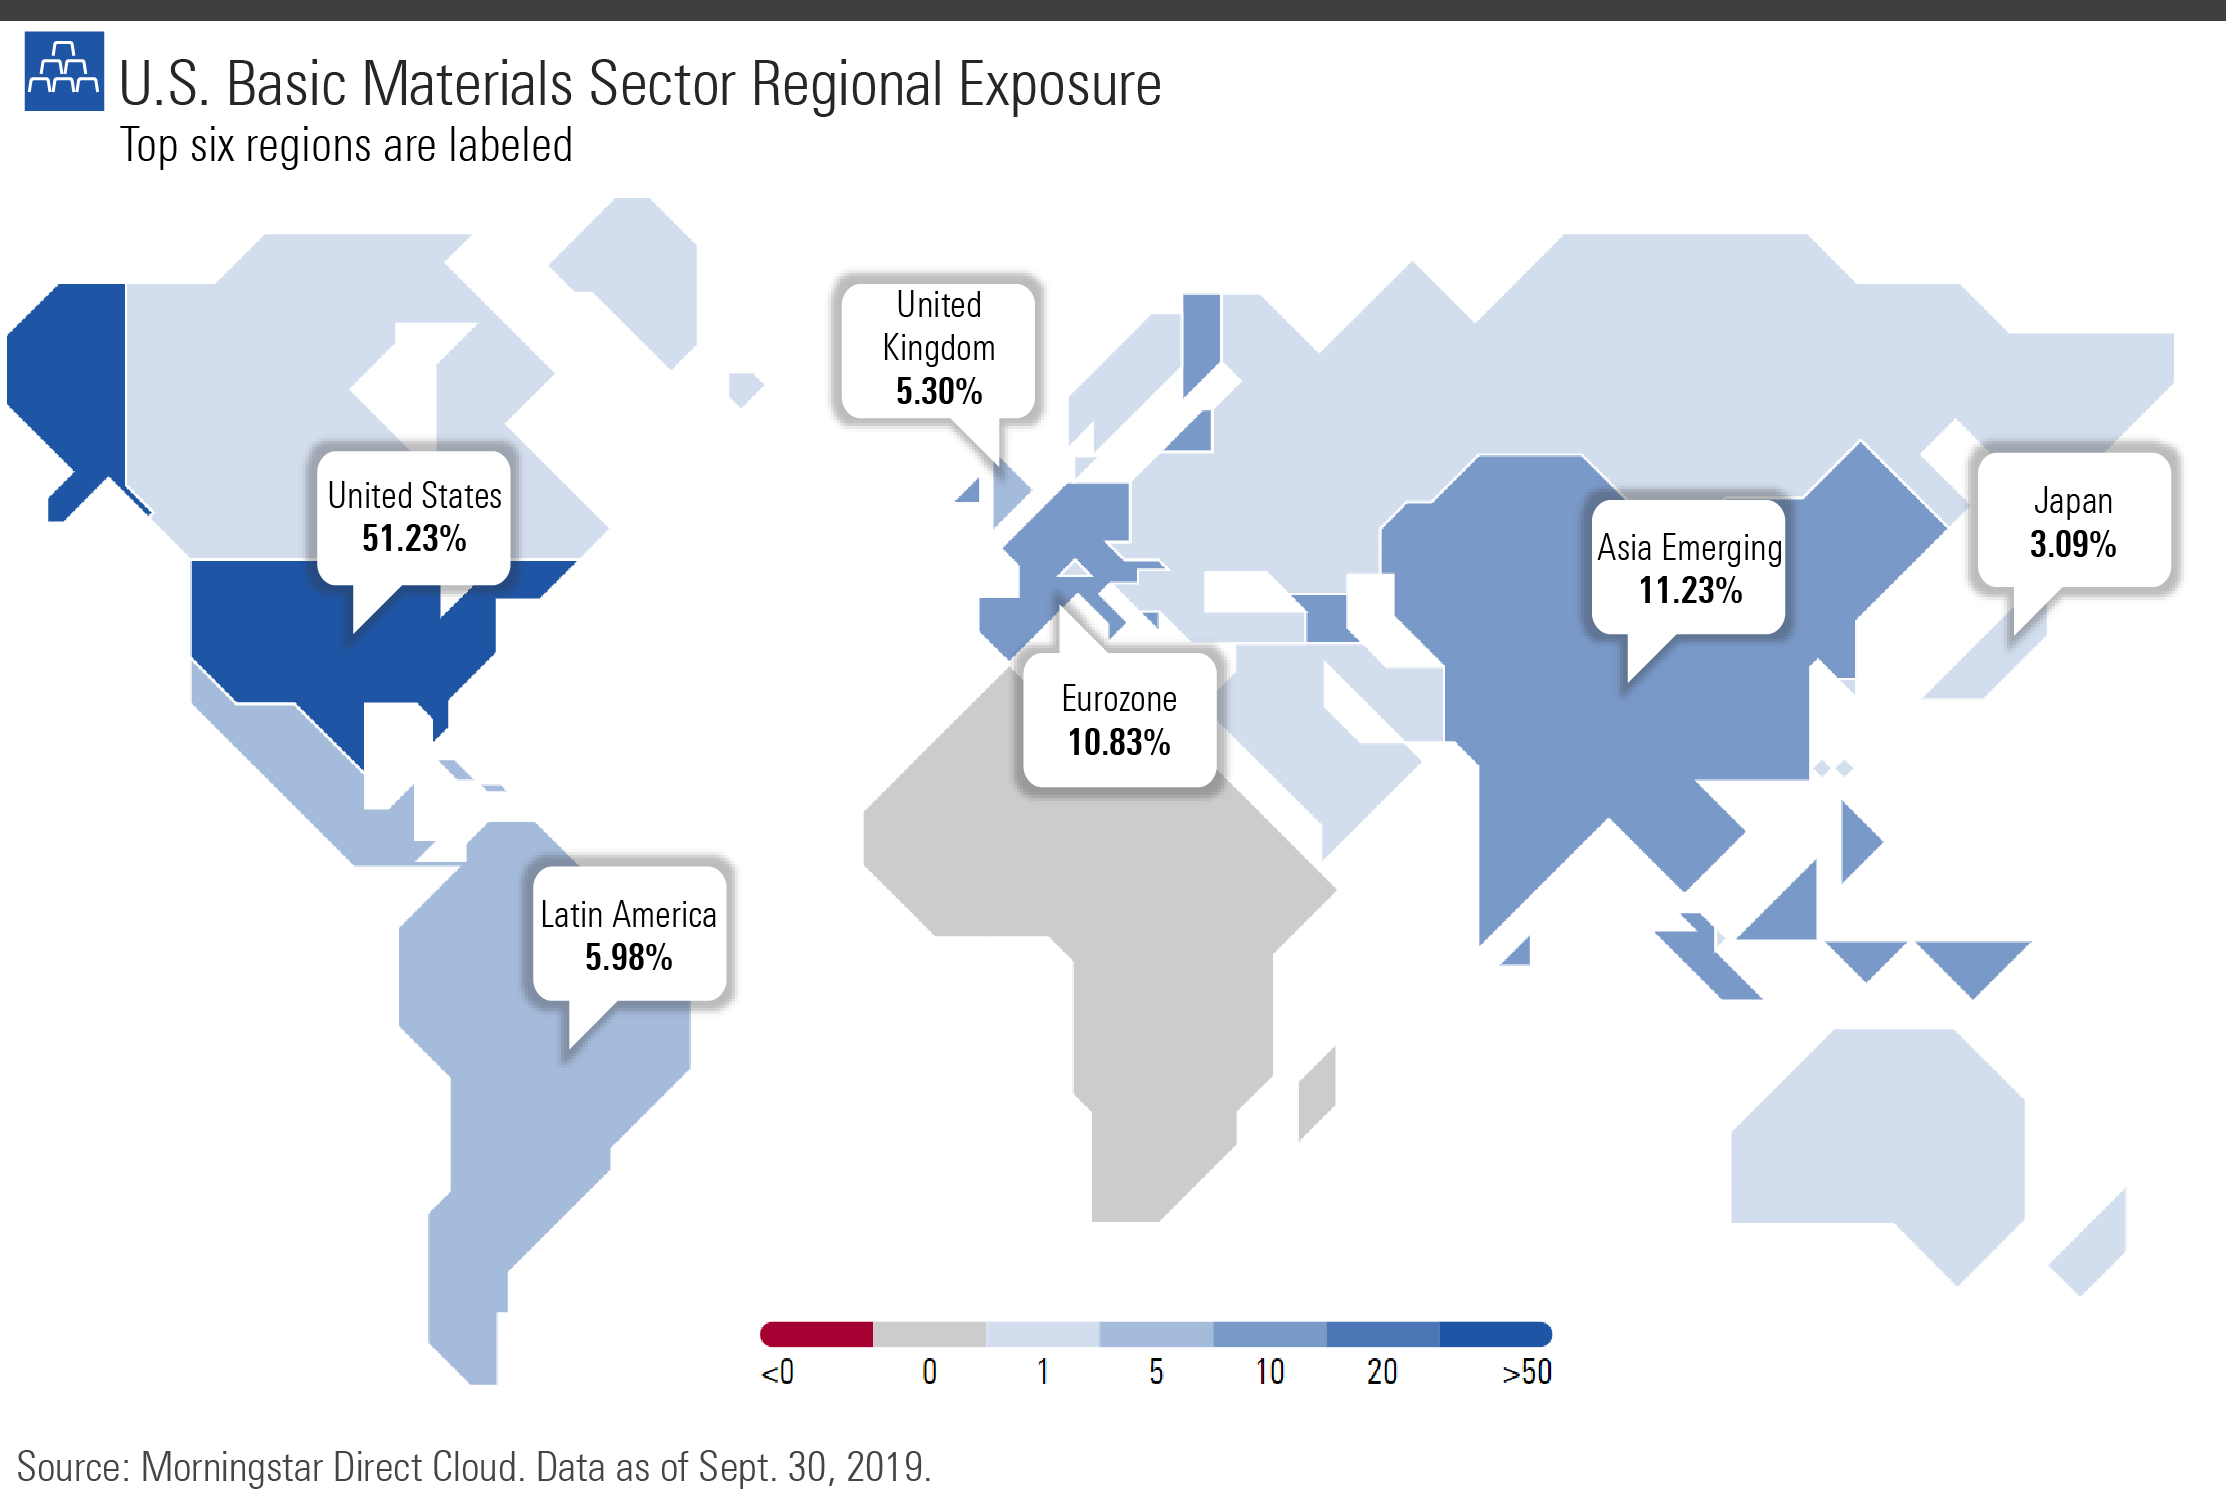
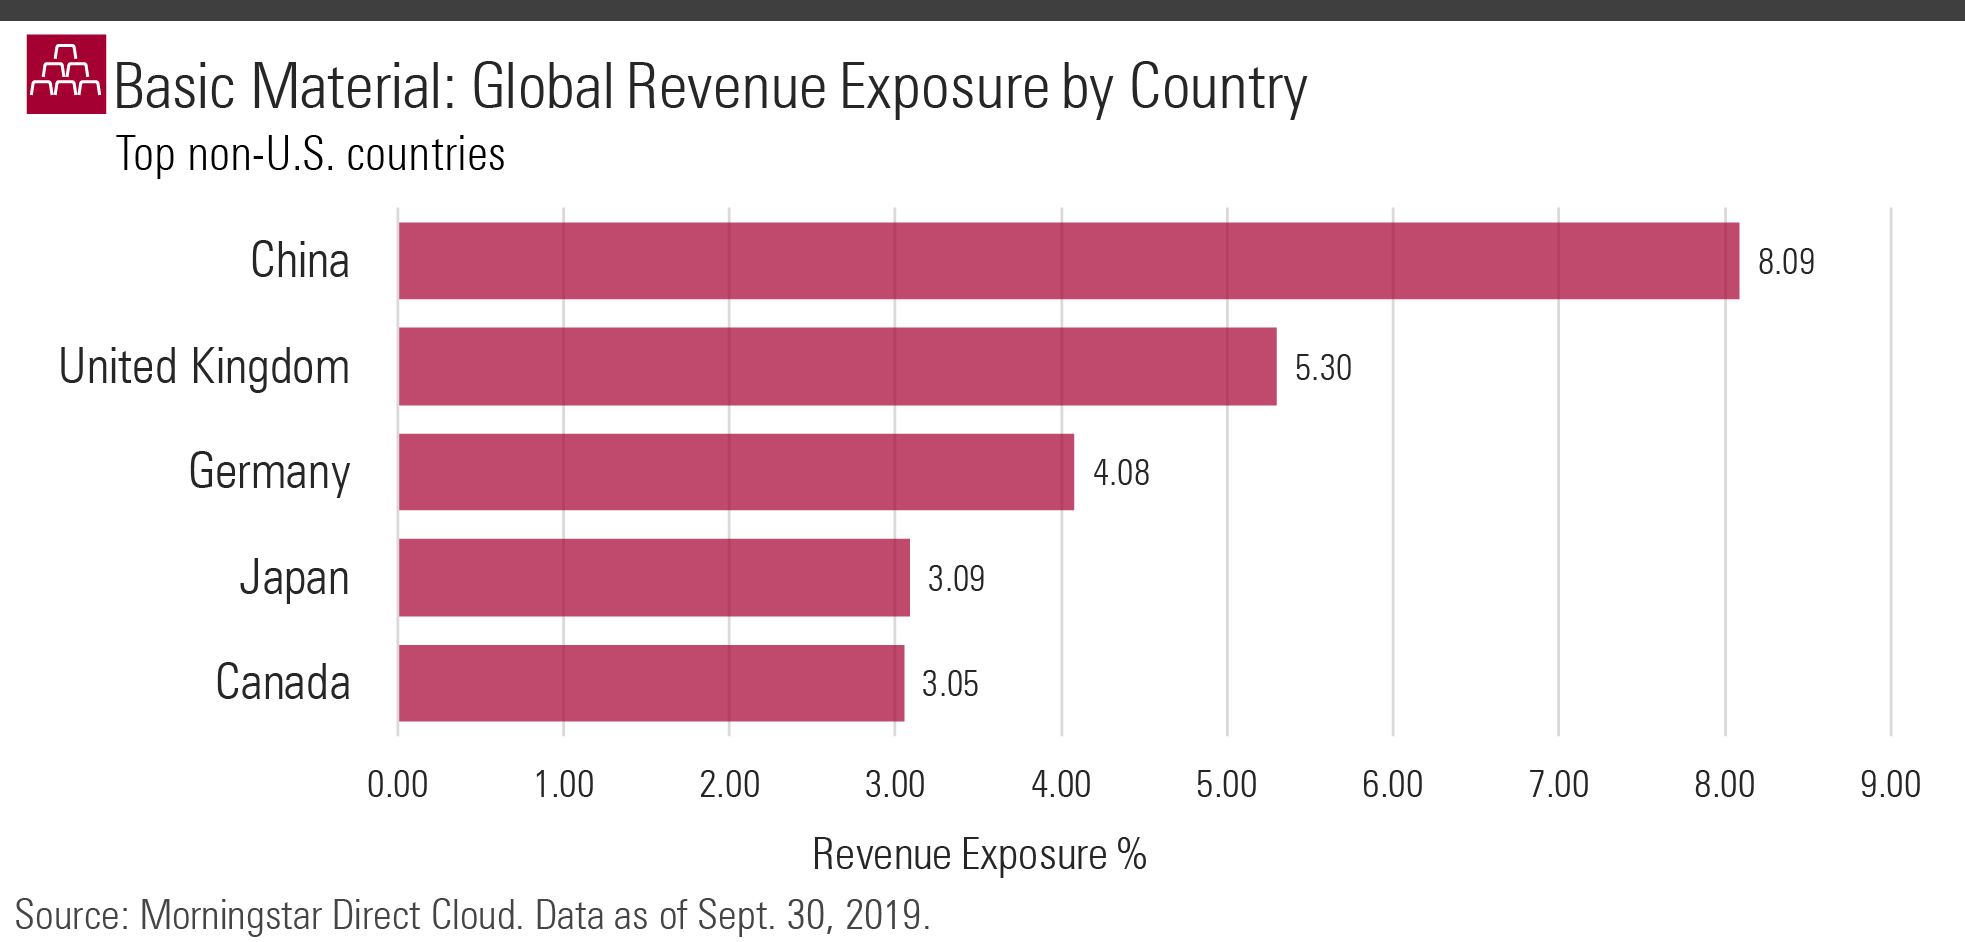
Asia Emerging remains the top foreign region at 11.23%, followed closely by the eurozone at 10.83%. Latin America and Japan show up once again, and the United Kingdom joins in this time at 5.3%.
Breaking down revenue stream by country, China is again the number-one source of revenue for U.S.-based basic materials companies. This time the difference between China and second place is less drastic.
In the map for the consumer defensive sector, we see a higher concentration of revenue coming from the U.S. and lighter shades of blue across the rest of the world.
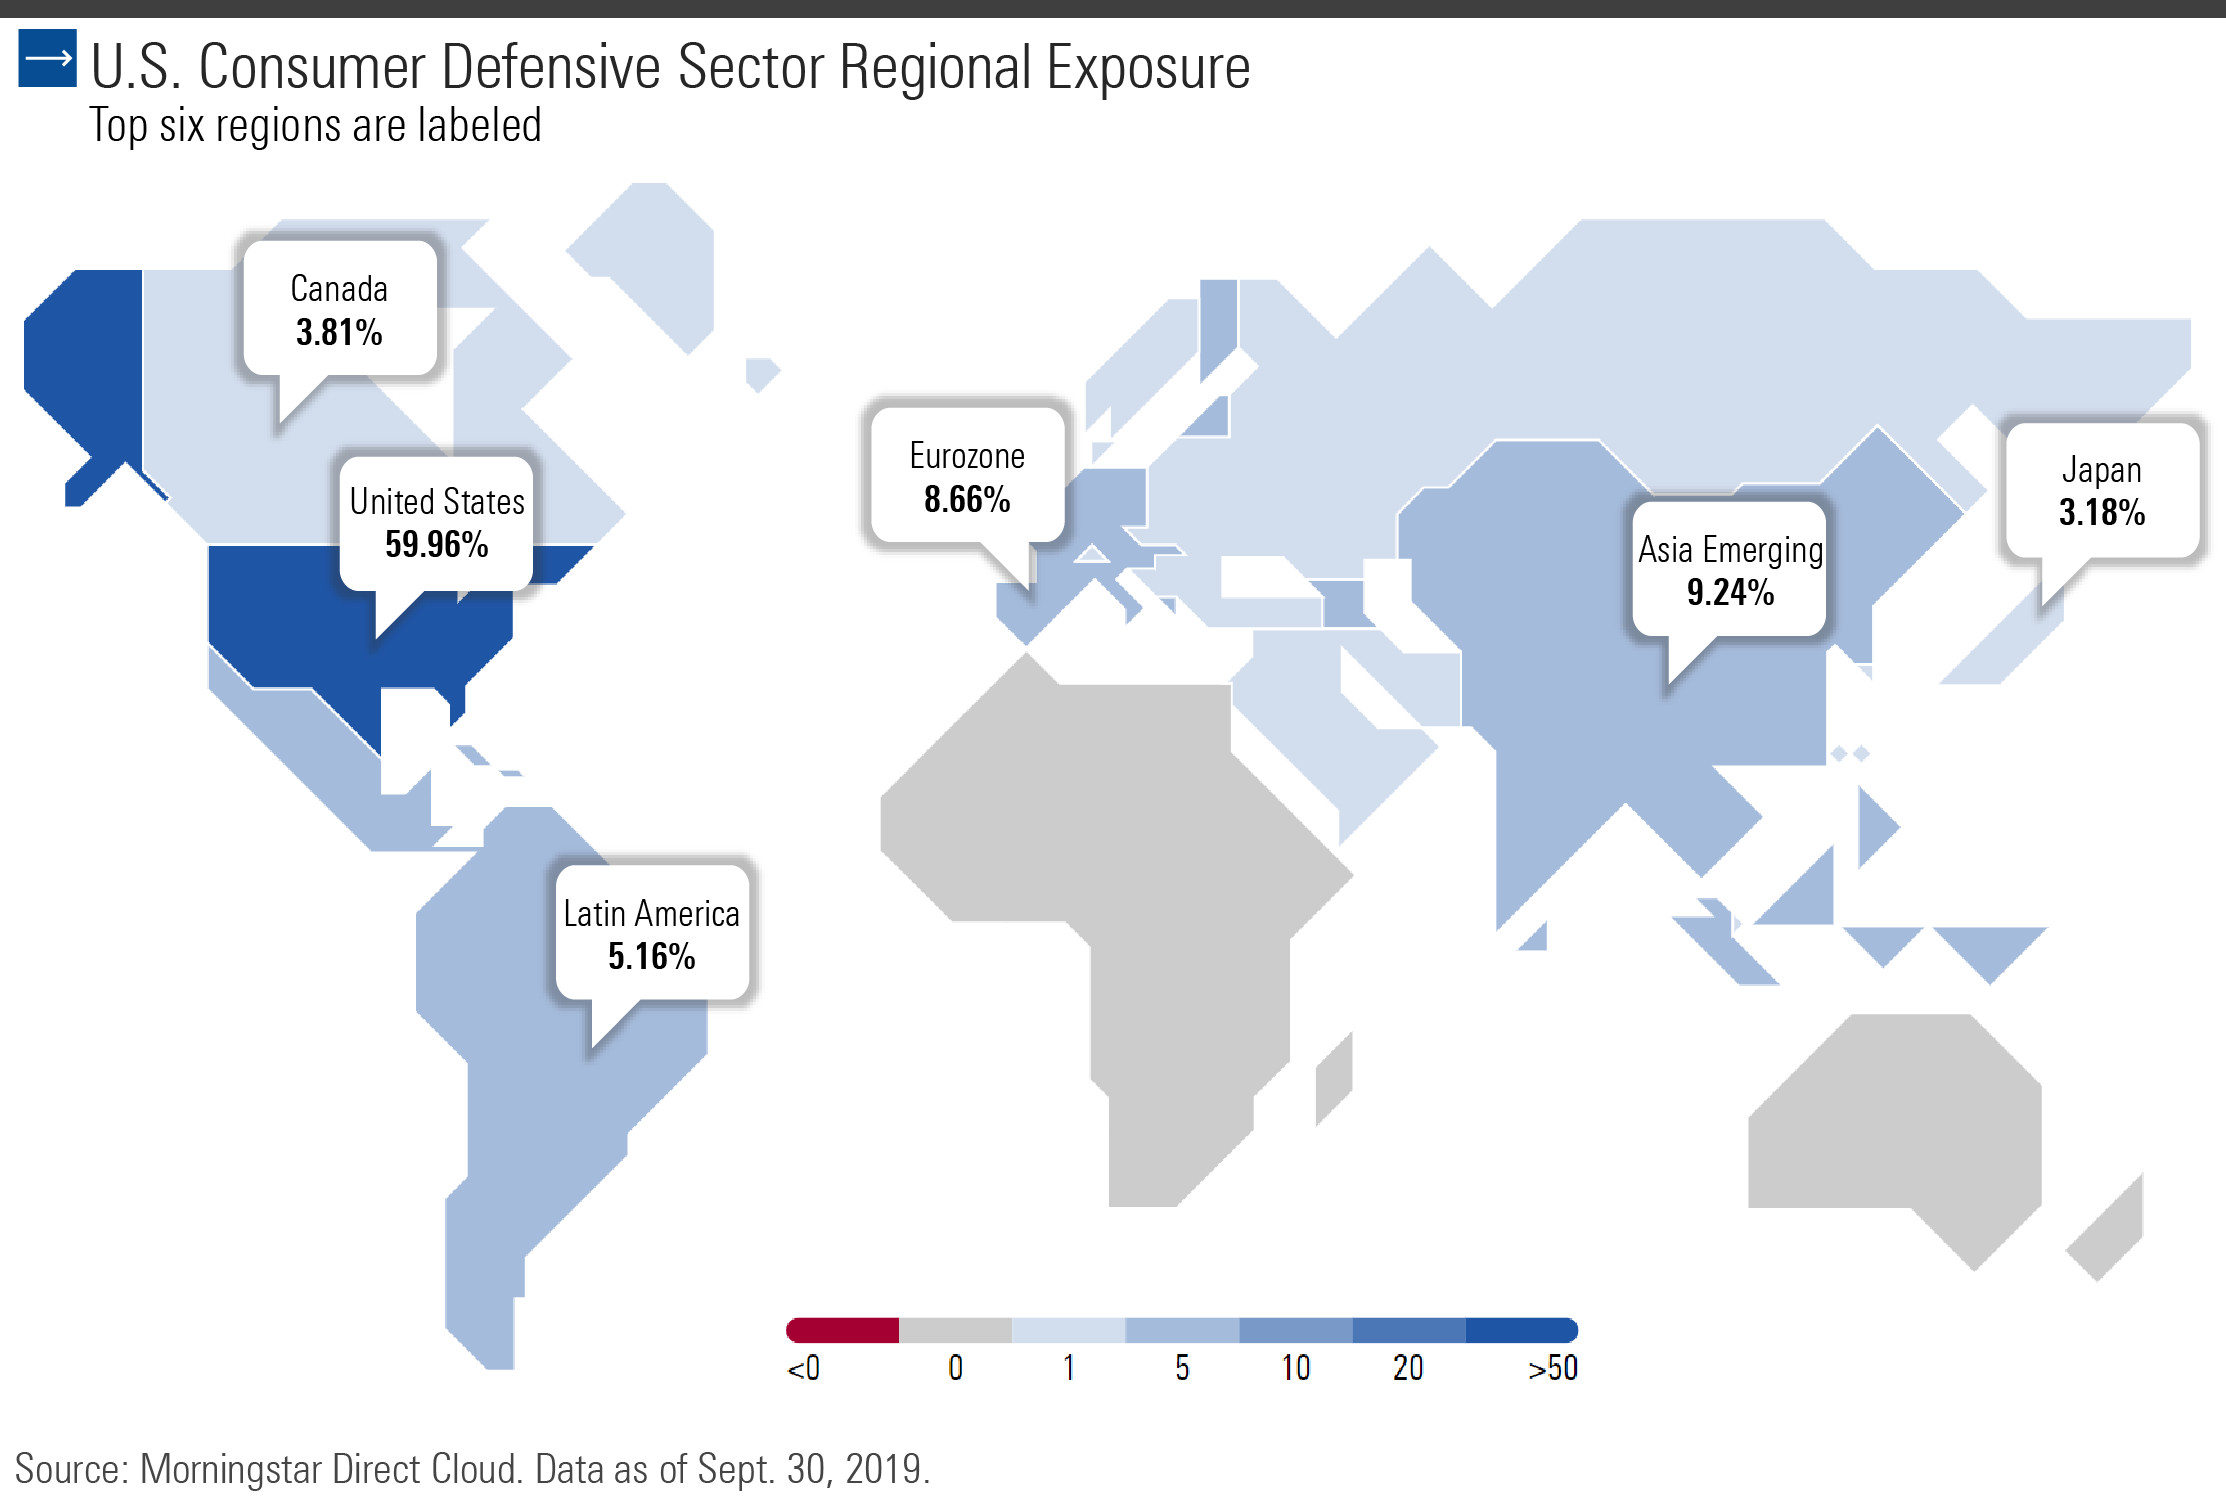
Yet again, Asia Emerging and the eurozone are among the higher weighted areas, at 9.24% and 8.66%, respectively. Latin America and Japan also show up, this time joined by Canada.

Once more, China stands at the top for non-U.S. revenue exposure for the consumer defensive sector. Between tech, basic materials, and consumer defensive, China takes a top spot in foreign exposure.
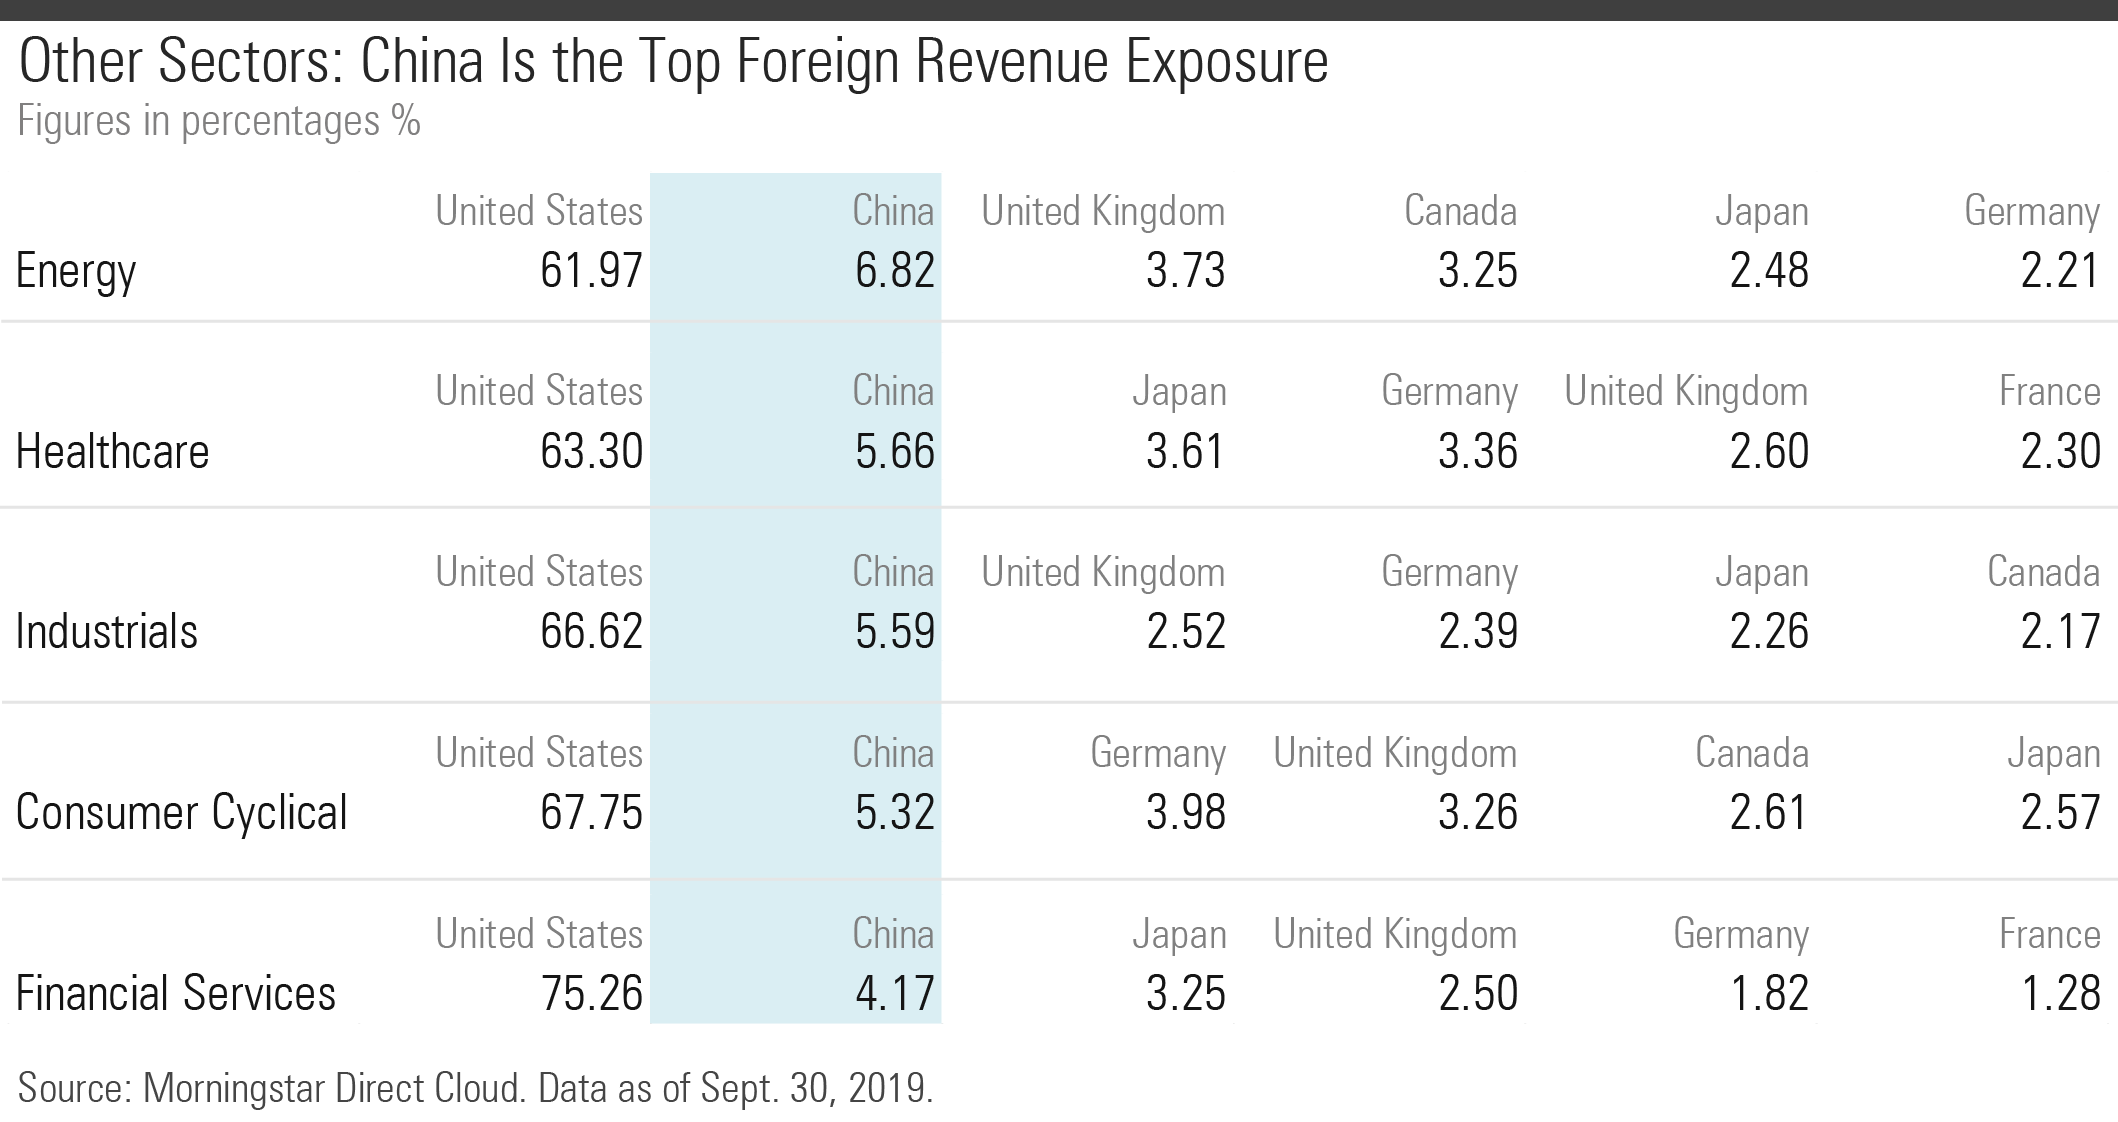
In fact, with the exception of utilities, real estate, and communication services, all other Morningstar sectors exhibit a similar pattern.
The table below shows the rest of the Morningstar sectors where China is the top source of foreign revenue.
/cloudfront-us-east-1.images.arcpublishing.com/morningstar/54RIEB5NTVG73FNGCTH6TGQMWU.png)
/cloudfront-us-east-1.images.arcpublishing.com/morningstar/ZYJVMA34ANHZZDT5KOPPUVFLPE.png)
/cloudfront-us-east-1.images.arcpublishing.com/morningstar/MNPB4CP64NCNLA3MTELE3ISLRY.jpg)
:quality(80)/s3.amazonaws.com/arc-authors/morningstar/11b6f4c1-25d3-4bbc-8deb-d1c1aeedcce7.jpg)