
How Do You Value Amazon Heading Into 2020?
Amid calls for tech breakups, should investors adopt alternative approaches to valuation?
/s3.amazonaws.com/arc-authors/morningstar/d989732f-19b3-4049-b5fe-f59c1fcfa828.jpg)
With Amazon’s AMZN business model evolving the past several years and questions about breaking up large technology companies likely to persist through the 2020 election cycle (and probably longer), we believe it’s appropriate to revisit the longer-term assumptions behind our discounted cash flow analysis and introduce a sum-of-the-parts valuation for each of Amazon’s key business units. While we don’t see a breakup of the company as imminent, we believe this exercise can help investors gain greater confidence in an Amazon investment, which remains our top pick in online retail. Our analysis suggests that Amazon Web Services and Amazon Advertising are not receiving the credit they deserve from the market, and we still identify multiple paths to margin expansion for the company’s online and physical retail segments in the years to come, even against an uncertain global economic backdrop.
5 Reasons to Buy Amazon Based on Our SOTP Analysis Our sum-of-the-parts analysis reveals that AWS and Amazon Advertising are probably underappreciated by the market. With estimated stand-alone valuations of $550 billion and $125 billion, respectively, AWS and Amazon Advertising are the most misunderstood and underappreciated pieces of the Amazon valuation puzzle, in our view. While most investors would agree that these segments are important longer-term margin contributors, we believe the sheer magnitude of cash flow generation is difficult for some to grasp. We see AWS as Amazon's most important cash flow contributor over the next decade, with advertising beginning to take the mantle roughly a decade out. We believe both segments offer more significant margin expansion opportunities than the market is giving them credit for, with AWS riding its differentiated and mission-critical services to low to mid-30s operating margins and Amazon Advertising growing from high teens to mid-20s operating margins over the next decade.
Amazon's online retail businesses still have margin expansion potential. As Amazon's North America operations continue to transition from Prime member acquisition to engagement while becoming a more accommodating third-party marketplace, margin expansion is still possible even after factoring in one-day shipping initiatives. We expect North America online retail segment margins to reach 5.5% by 2028 (compared with 4.5% in 2018, excluding advertising). We also expect Amazon's international online retail segment margins to turn positive in 2021 as more established markets like Europe and Japan benefit from the Prime membership flywheel and investment activity in markets like India and Australia winds down. In our view, Amazon's online retail businesses are worth $450 billion on a collective basis.
Physical stores are complementary to Amazon's other businesses. Physical stores represent a small percentage of Amazon's future valuation on a stand-alone basis--roughly $20 billion--but are highly complementary to other business segments. We believe Whole Foods and Amazon's other retail formats--many of which have yet to be announced--help to bring Prime memberships into the physical world and unlock new subscription monetization opportunities. They also help to attract new third-party vendors and offer a differentiated source of customer data.
We don't believe a separation of Amazon is imminent. Despite increased calls from politicians to more heavily regulate or even separate large U.S. technology firms, we don't expect regulatory pressure or other factors to lead to an Amazon breakup in the near future, especially considering the lengthy investigation and appeal process that would accompany such proposals. We believe the company has little interest in breaking apart, given the complementary nature of its various business units, and would only consider a separation as a last resort, even if the market were willing to assign a higher valuation to segments like AWS or Amazon Advertising on a stand-alone basis.
We believe consumers will continue to utilize Amazon during a recessionary environment, and the continued growth of nonretail segments only helps to diversify the company. Our analysis shows that e-commerce companies react more like defensive retailers during periods of economic softness, with consumers still relying heavily on marketplaces like Amazon because of competitive pricing and the convenience of expedited shipping. While we currently forecast only a moderation in global consumption trends during 2020, we still believe Amazon is well positioned to outgrow most of its peers over the next several years. We also believe AWS and Amazon Advertising should help to insulate the company during the next cyclical downturn and reinforce the company's vastly different business mix compared with the 2008-09 recession.
The Case for a $1.2 Trillion Valuation for Amazon A recurring question over the past decade is how to appropriately value Amazon. Relative valuation metrics are difficult to apply because of the company's shift to third-party sales, subscription offerings, and advertising platforms (which has changed the company's revenue and profitability model) and uneven fulfillment, technology, and content investment cycles (leading to a lack of visibility over profitability forecasts and making traditional enterprise value/EBITDA and price/earnings multiples valuation approaches difficult to apply). Discounted cash flow approaches to valuation like Morningstar's are often back-weighted to the later years, and there are many variables that may change between now and then. Dividend discount models for companies focused on internal investment for growth simply don't apply.
Amazon’s business model has evolved the past several years, and questions surrounding new investment priorities (new AWS capabilities, physical retail, pharma/healthcare, advertising) continue to make future cash flow projections an uncertain proposition, something we’ve factored into our high uncertainty rating. However, we also see these developments as an opportunity to revisit the longer-term assumptions behind our DCF analysis and introduce a sum-of-the-parts valuation for each of Amazon’s key business units. We believe this exercise can help investors to gain a better appreciation for the various drivers of the company’s longer-term cash flow potential and, by extension, get more comfortable investing in Amazon.
On top of the lack of visibility on its future free cash flow, discussions regarding a breakup of Amazon and stand-alone valuation for its various segments have become more prevalent in the past several months amid antitrust claims from the current administration and calls for breaking up large technology companies by several 2020 Democratic presidential hopefuls. We see an Amazon breakup as a low-probability event over the near term, as it’s difficult to make an antitrust case when Amazon represented around 45% of Walmart’s revenue in 2019, and we believe that any Federal Trade Commission investigation into Amazon’s anticompetitive practices would most likely result in changes to what products it produces and how they are sold on its marketplaces (such as Elizabeth Warren’s plan requiring large technology companies to register as “platform utilities” and restrict them from competing with vendors or advertisers on their platforms) rather than a breakup of the company. Still, we believe these headlines offer a reason to look at not only our base-case assumptions, but also what each segment might be worth in a breakup scenario.
Revisiting Our DCF Base-Case Assumptions Let's start by revisiting our baseline valuation assumptions for Amazon. Our fair value estimate of $2,300 per share balances emergent sources of growth such as advertising, new subscription services, international retail, and Alexa (and the future licensing opportunities it presents) with Prime one-day shipping, video and audio content, and other technology investments.
Our model assumes average annual revenue growth of approximately 16% for the five years ending 2023--including almost 19% in 2019--due to the contribution from physical retail formats, greater engagement among Amazon Prime members, increased third-party sales from its suppliers, digital content sales, international expansion, and nascent growth channels like Amazon Advertising and technology licensing. With respect to Amazon’s sales mix, we forecast online retail revenue to grow 9% annually over the next five years, below our forecast of low-double-digit global industry revenue growth over the same period, but partly a byproduct of Amazon’s ongoing shift to a third-party marketplace. On the basis of gross merchandise volume (GMV, which represents the total amount of Amazon and third-party products and services sold on Amazon’s marketplaces), we anticipate midteens growth over the next five years. Our model forecasts that smaller segments like physical stores, third-party seller services, subscription services, AWS, and advertising will grow 6% (on a pro forma basis), 19%, 27%, 30%, and 31%, respectively, over the same period.
We forecast that gross margins will reach 43% over the next five years, compared with 40.2% in 2018. Amazon’s growing clout with suppliers and advertisers, the higher proportion of third-party units in the sales mix, AWS’ increased presence, and new advertising service offerings should allow for higher gross margins. We also forecast operating margin expansion through increasing expense leverage (particularly in the marketing and general and administrative expense line items), contribution from AWS, and accelerating third-party unit sales. Our model calls for Amazon to reach 9%-10% GAAP operating margins over the next five years, based on its strong competitive positions in AWS and North America e-commerce, as well as early indications of success in certain international markets.
At the reported segment level, we expect modest operating margin expansion from Amazon’s North America segment (including online retail, physical stores, advertising, and other revenue) over the next several years--compared with 5.1% in 2018--as new membership/subscription revenue opportunities and the continued shift to third-party sales help to offset one-day shipping and incremental content investments. We forecast that Amazon’s international segment will operate at a loss for roughly the next five years as it invests heavily in its early-stage markets--India in particular--but see this segment eventually reaching low-single-digit operating margins over a five-year horizon. Our model also forecasts modest operating margin expansion from AWS--from 28.4% in 2018--with new differentiated (blockchain, Internet of Things, machine learning, and satellite) and mission-critical (security, identity, and compliance) services as well as AWS Marketplace helping to offset price competition in its core cloud compute and cloud storage services.
We expect the consolidated company operating margin to rise from 5.3% in 2018 to 9.4% in 2023. AWS remains the most significant contributor to our five-year operating margin outlook, adding 260 basis points of cumulative margin expansion. Still, beyond AWS, we continue to identify several potential margin expansion drivers among Amazon’s North America and international retail segments, with Prime membership acquisition, retention, and engagement and new subscription offerings, new third-party seller services, and advertising collectively adding 140 basis points and longer-term potential drivers like technology licensing also modest contributors.
Our top-line projections have remained relatively stable in the past two years save for a modest decrease to account for Amazon’s ongoing shift to a third-party marketplace (where Amazon effectively trades off the full revenue generated from the sale of a product for a smaller but more profitable commission), partly offset by more optimistic views regarding Amazon’s advertising business. However, our fiscal 2023 operating margin assumptions have increased by a little more than 2 points, to 9.4% from 7.3%, due to several sources, including increased confidence in AWS’ longer-term margin profile, the potential for new Prime membership pricing tiers and subscription offerings, a more pronounced shift to a third-party marketplace, and the emergence of Amazon Advertising. This was the primary impetus behind raising our fair value estimate to $2,300 per share from $1,250 the past two years.
Putting Parameters to Our SOTP Analysis With so many moving parts to Amazon's future growth and profitability, we believe that a sum-of-the-parts analysis can be helpful in putting the company's valuation in context. The company now reports six revenue sources (online stores, physical stores, retail third-party seller services, retail subscription services, AWS, and marketing services/other) but provides operating profit data for just three separate business entities (North America, international, and AWS). As such, we've had to develop estimates for Amazon's different business units and utilize six segments for our SOTP analysis: (1) North America online retail, (2) international online retail, (3) physical stores, (4) AWS, (5) Amazon Advertising, and (6) other revenue/corporate.
A few additional notes on our SOTP analysis. One, although the company reports revenue separately for online stores, third-party seller services, and retail subscription services, we believe these functions all work together to enhance Amazon’s network effect with margin profiles that depend on one another. Thus, we grouped these revenue streams together for purposes of the SOTP calculations. Two, we broke out Amazon’s North America and international online retail segments as separate entities, just because they are both at different points in their respective maturity curves. Three, our SOTP analysis isolates Amazon’s physical stores because we believe this will be an increasingly complementary contributor to the future cash flow of Amazon’s online retail operations but it also carries different capital requirements than those segments. Four, we also believe it’s important to isolate Amazon Advertising because we consider this to be one of Amazon’s most important future cash flow contributors, and grouping it with other revenue streams could distort our analysis. Five, for purposes of this initial analysis to arrive at stand-alone SOTP valuations for Amazon’s various business units, we assume no meaningful synergies or dissynergies are created by separating Amazon.
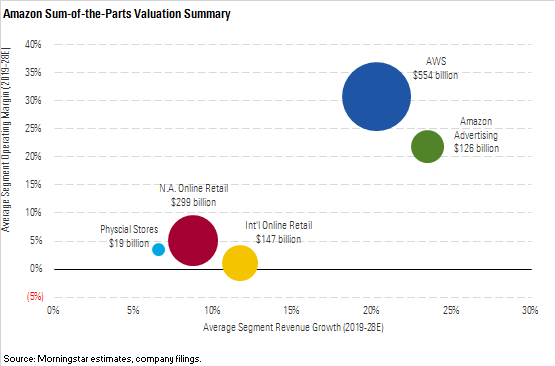
Assuming that the nearly $1.2 trillion equity valuation implied by our $2,300 fair value estimate for Amazon is correct, here we summarize our SOTP valuations for the various segments. Not surprisingly, given its expected growth and margin profile, we view AWS as Amazon’s most valuable entity, with a stand-alone valuation of just over $550 billion. This would make AWS the fourth-most valuable company in the world, trailing only Microsoft, Apple, and Alphabet, and ahead of other tech giants like Facebook and Alibaba.
We estimate that Amazon’s North America retail segment (including first-party product and service sales, Prime membership and other subscription fees, and third-party seller services) has a stand-alone valuation of approximately $300 billion, which would be good enough to make it the second-most valuable retailer in the world behind Walmart. If we include our stand-alone valuation for Amazon’s international online retail segment--which we believe is worth nearly $150 billion--Amazon’s online retail segments would be the most valuable retailer in the world.
Perhaps the most surprising valuation conclusion from our SOTP analysis is Amazon Advertising, which we peg at a little more than $125 billion. While this is currently one of Amazon’s smallest business segments from a revenue standpoint, we see it as an increasingly important cash flow driver that in many ways helps to tie the other segments together.
We’ve arrived at a stand-alone valuation of $20 billion for Amazon’s physical stores, which may not seem like much compared with the other segments, but it’s well ahead of most of our retail coverage universe (only exceeded by Walmart, Home Depot, Costco, Kroger, and Target and ahead of Best Buy) and a 42% premium to the $13.7 billion purchase price for Whole Foods.
Lastly, Amazon’s "other" segment includes the company’s corporate overhead as well as other service offerings such as cobranded credit cards. While certain corporate overhead personnel and functions would probably transfer to Amazon’s various segments under a breakup scenario, the valuation impact would likely depend on how a hypothetical separation was structured. Ultimately, under a breakup scenario, we believe AWS would inherit roughly $20 billion of overhead and other corporate functions, online retail would absorb close to $25 billion (largely a function of cobranded credit cards, which would likely be allocated to this segment), and Amazon Advertising would pick up $5 billion in corporate expenses.
/cloudfront-us-east-1.images.arcpublishing.com/morningstar/WC6XJYN7KNGWJIOWVJWDVLDZPY.png)
/cloudfront-us-east-1.images.arcpublishing.com/morningstar/HHSXAQ5U2RBI5FNOQTRU44ENHM.jpg)
/cloudfront-us-east-1.images.arcpublishing.com/morningstar/737HCNGRFLOAN3I7RKGB7VPEKQ.png)
:quality(80)/s3.amazonaws.com/arc-authors/morningstar/d989732f-19b3-4049-b5fe-f59c1fcfa828.jpg)