
Grading on a Curve: Leaders and Laggards in the Evolving 529 Market
As most 529 plans make improvements, plans that stay stagnant are falling behind.
/s3.amazonaws.com/arc-authors/morningstar/eda620e2-f7a7-4aef-bb6c-3fb7f1ac7a38.jpg)
Morningstar Direct and Office clients can access the full report here.
Since Morningstar began covering 529 plans, the industry has consistently improved. Fees have fallen, underlying investment quality has increased, and oversight has strengthened. As a result, we launched new Morningstar Categories for 529 plan age-based portfolios in April 2019. Federal policymakers have shown growing interest in expanding the flexibility of the 529 plan; the most recent expansions of tax benefits could have consequences for 529 plan administration. Morningstar's 529 Landscape paper showcases the industry's most recent improvements, as well as how our evaluations have evolved as we continue to raise the bar for plans. Here are our key findings.
1. Low fees are helping direct-sold plans outpace advisor-sold plans, while total assets in 529 plans remained mostly unchanged in 2018.
In 2018, fourth-quarter losses dragged down the S&P 500’s calendar-year return to negative 4.4%, which damped positive 529 plan flows. As such, 529s did not grow from 2017 to 2018--assets under management remained virtually unchanged year-over-year, the first time they haven’t posted meaningfully positive growth since 2011. Over the three- and five-year periods ended December 2018, 529 plans are still growing strong, at annualized rates of 7.9% and 7.4%, respectively. Plans sold directly to college savers (direct-sold) have contributed the most to this growth.
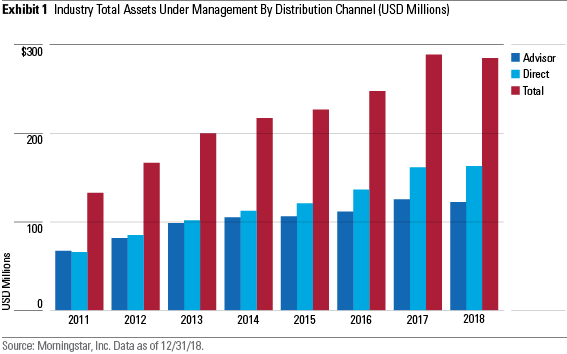
Low-cost direct-sold plans have grown at 9.9% annually over the past five years, outpacing the 4.4% growth rate of higher-cost plans that are sold through financial advisors. Higher inflows contribute to direct-sold plans’ growth, but lower expense ratios have also helped them grow faster than advisor-sold plans because they lose less of their assets to fees. In addition, as advisors shift from a commission-based (paid by the fund company) to a fee-based (paid by the client) compensation structure, advisors may choose to recommend cheaper direct-sold plans. Some direct-sold plans have even taken steps to become more accessible to advisors, including Utah’s my529 plan, which built a platform to serve its growing advisor base.
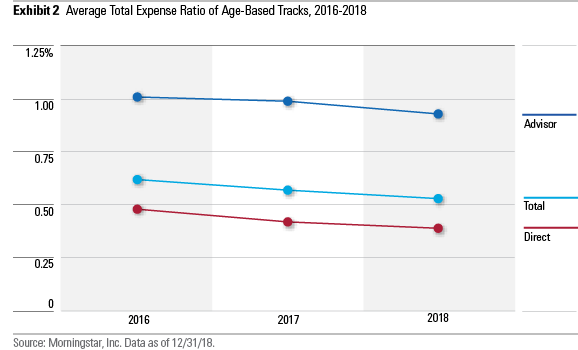
Fees continue to decline for both direct- and advisor-sold plans. The average advisor-sold portfolio costs 0.93%, down by 0.06 percentage points since 2017. The average direct-sold age-based portfolio is cheaper at 0.39%, but this already-lower fee has fallen at a slower pace than advisor-sold plans at 0.03 percentage points.
2. Many plans have implemented smoother transitions to bonds from stocks in their age-based portfolios, so Morningstar has launched new categories.
529 plans typically include at least one track of age-based options, where the investments’ asset-allocation shifts to bonds from stocks along a glide path as the beneficiary nears college matriculation. Target-date retirement funds, common in 401(k) retirement plans and typically offered in five-year increments, all shift the assets in each fund over the life of the investment. 529 plans each determine when and how to shift assets, resulting in investment design variability. Some 529 plans physically move client assets from one age-based option to the next when the asset-allocation shifts, whereas others follow a target enrollment method that keeps investors in one option that smoothly shifts over time, similar to target-date funds.
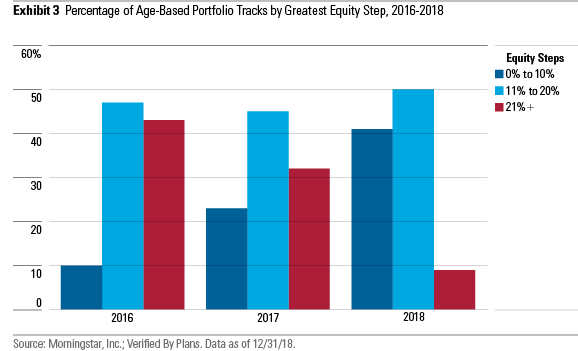
In recent years, many plans have shifted toward smoother glide paths, which should improve investment outcomes for college savers. Exhibit 3 groups the industry’s 529 age-based tracks into one of four buckets based on the largest equity percentage-point step down in the glide path: 0-10 percentage points, 11-20 percentage points, and 21 or more percentage points. Target Enrollment portfolios fall into the 0-10 bucket. In 2016, only 10% of tracks fell into the 0-10 bucket, and 42% of tracks had a step greater than 20 percentage points. At the end of 2018, 42% of tracks landed in the 0-10 bucket, and only 7% of tracks had a step exceeding 20 percentage points of assets.
Plans have reduced their equity steps in one of two ways. Although some plans--typically ones affiliated with asset managers that provide target-date solutions--have long embraced the target enrollment design, it has gaining traction within the industry as more plans like Indiana’s CollegeChoice Direct and Oregon’s College Savings Plan launch target enrollment portfolios. We've launched brand-new target enrollment categories as more plans adopt this method. With the new categories, ranging from target enrollment 2039+ to target enrollment 2015 in three-year increments, we can now directly compare target enrollment portfolios against other portfolios of a similar target enrollment date and design.
Other 529 plans that move investors from one portfolio to another have begun to make smaller, more-frequent shifts in the age-based options’ asset allocation. Because these steps are smaller and occur more frequently, we debuted new categories that come with narrower age ranges of two years. Given the short time horizons that 529 investors face, these new categories are designed to capture portfolio performance against other portfolios designed for a child of similar age.
3. The quality of investments underlying 529 plans has improved.
The underlying investments included in a 529 plan’s age-based and static portfolios play a meaningful role in helping families reach their college-savings goals. The quality of these underlying investments--which often hinges on the managers running those strategies--has driven Morningstar’s People Pillar rating for 529 plans.
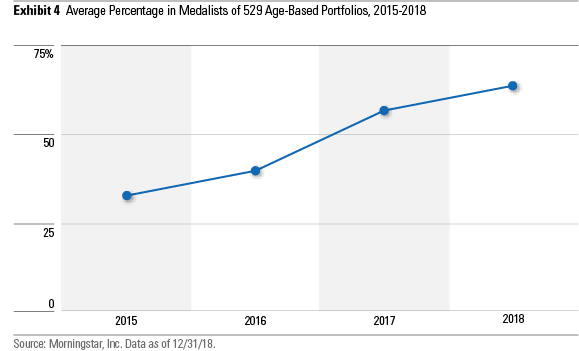
Since 2015, the average percentage of a plan’s age-based portfolios’ weight in Morningstar Medalists has about doubled, from just over 30% in 2015 to nearly 65% at year-end 2018, highlighting the need for plans to continually review and upgrade their lineups to remain competitive.
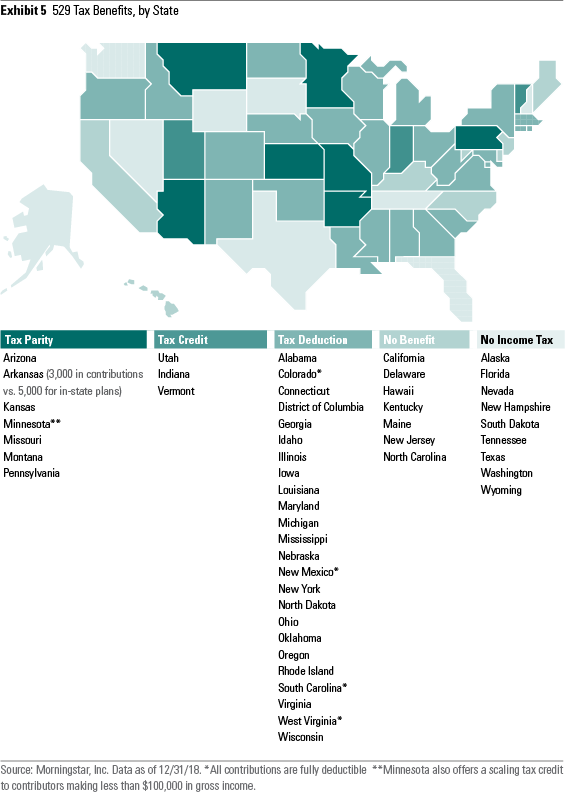
4. Taxes are an important consideration for 529 investors. In late 2017, federal policymakers expanded the tax benefits of 529 plans to private primary and secondary education, though these benefits are not universally matched at the state level.
Depending on investors’ state of residence, state tax benefits may be an important factor when choosing a plan. In states with generous tax benefits, investors may be better served by sticking with a local plan with less-than-compelling investment options to also take advantage of the state’s tax benefits.
The three most common tax configurations include: no tax benefit because states either don’t levy a state income tax or because they don’t offer a 529 deduction; a tax benefit for investors in plans that are administered by the state of residence; or tax parity, which allows investors to pick any state’s plan and still receive a tax benefit from their state of residence. College savers who live in a state with state-specific income-tax deductions should weigh their potential tax savings against plans with cheaper expense ratios.
In recent years, federal policymakers have increased the flexibility of the 529 plan as a spending vehicle to extend federal tax savings on education. With the Tax Cuts and Jobs Act passed in late 2017, 529 qualified expenses expanded to include tuition for private education for kindergarten through high school.
States aren’t uniformly embracing this greater latitude found at the national level. For example, some state legislatures like Missouri automatically conformed to federal legislation enabling the use of 529s for private K-12 education. Some states, like New York and Colorado, introduced bills to expand tax benefits to K-12 savers but either haven’t yet passed or failed to pass the legislation. Some states like Massachusetts created laws that exclude K-12 savers from their local tax benefits.
/cloudfront-us-east-1.images.arcpublishing.com/morningstar/HDPMMDGUA5CUHI254MRUHYEFWU.png)
/cloudfront-us-east-1.images.arcpublishing.com/morningstar/OMVK3XQEVFDRHGPHSQPIBDENQE.jpg)
:quality(80)/s3.amazonaws.com/arc-authors/morningstar/eda620e2-f7a7-4aef-bb6c-3fb7f1ac7a38.jpg)