
How Health Shocks Affect Retirement Spending
Most retirees seem able to weather an expensive medical bill.
/s3.amazonaws.com/arc-authors/morningstar/951e122c-7299-4252-bafb-80cfefb25764.jpg)
Note: This article is part of Morningstar.com's 2020 special report, "Are You Able to Retire?" A version of this article originally published in May 2019.
Rising healthcare expenses are receiving increasing attention from retirees (and the media), and many financial planners are thinking about how to incorporate these expenses into a financial plan. A related concern is health shocks, or out-of-pocket medical bills that claim 10% or more of a year’s retirement budget. Because these events are—by definition—expensive and surprising, it’s reasonable to assume that they might damage a retiree’s financial position. However, these events might require less planning and saving than we might think.
In a study, we found that health shocks are rarely financially cataclysmic and that retirees tend to respond to them by reducing future spending.[1] Whether that’s by choice or necessity, we don’t know. In any case, the result is that, on average, lower ongoing spending at least partially offsets the costs of a health shock. We’ll explore spending in retirement to help put this new research into context, then dig into some of the new findings.
Retiree Health Expenses While outliving retirement savings is often noted as the greatest fear among retirees,[2] expenses related to health are generally not far behind. Two drivers of healthcare fears are increasing news coverage about the total estimated costs of retiree healthcare and the significant costs associated with a health shock.
Estimates of healthcare expenses are frequently cited in the media, such as Fidelity’s 2018 estimate that a couple retiring today at age 65 would need $280,000 for medical expenses, excluding long-term care. Other estimates vary. Fronstin and VanDerhei (2017), for example, suggest median costs of $169,000 for a couple (versus $226,000 at the 75th percentile and $273,000 at the 90th percentile). HealthView[3] forecasts total health premiums, deductibles, etc., for a 65-year-old couple could be closer to $404,253. Regardless of the details, the sums are significant.
That said, it’s important to put healthcare expenses into context. These expenses are only part of the total expenditures for households (and retirees). One could just as easily create a staggering estimate for the expected total costs of food and housing, yet this type of information rarely makes the news.
In Exhibit 1 , we provide some perspective on the percentage of total retiree expenditures devoted to healthcare. Panel A shows retiree expenditures by percentile (the first percentile spends the least, 100th spends the most). Panel B shows expenditure by retiree income quintiles. The data is from the Bureau of Labor Statistics’ Consumer Expenditure Survey[4] using the interview files from the first quarter of 2012 to the first quarter of 2017.
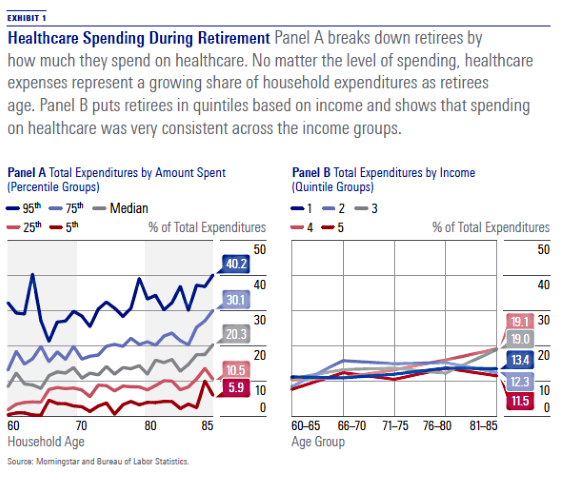
The definition of health expenditures used for the analysis includes health insurance, medical services, prescription drugs, and medical supplies. To be included in the analysis, the household had to have four quarters of available data (data in the exhibit is annualized), it must be coded as retired (either the individual respondent if single or both the respondent and spouse if married), and its total combined health expenditures over the four periods cannot be negative. A total of 1,927 households met these filters. Age is either the age of the respondent or the average age of the couple, if married.
Panel A demonstrates that healthcare expenses represent a growing share of total household expenditures during retirement. The median household (gray line) devotes 10% of total expenditures to healthcare at age 65 versus 20% by age 85. Households with the highest healthcare spending, the 95th percentile (dark blue line), allocate approximately 20% of total expenditures to healthcare at age 65 versus 40% at age 85. Panel B shows that median spending on healthcare was remarkably consistent across the income quintile groups. (The first quintile represents retirees who spend the least; the fifth quintile spends the most.)
There are two primary components of healthcare expenditures for retirees: health insurance premiums and out-of-pocket healthcare expenditures. Health insurance premiums, which include Part B, Part C (Medicare Advantage), Part D (prescription drug plans), and supplemental coverage (such as Medigap and retiree health plans) account for roughly two thirds of total healthcare expenses among retirees, according to both Fronstin and VanDerhei (2017) and Cubanski et al. (2014). This is important because these expenses are generally known with more certainty than are other out-of-pocket healthcare expenses.
Medicare premiums are typically based on income. In 2018, the Medicare Part B premium was $134 per month for a single (or joint) household making $85,000 ($170,000) or less (yearly income as of 2016); the monthly premium was $428.60 for a single (joint) household making $160,000 ($320,000) or more.[5] Part D (prescription drug plan) premiums work in a similar way: the more a household makes, the higher the premium.[6]
Out-of-pocket healthcare expenditures are expenses other than insurance premiums, including things like medical supplies and nursing home stays. The costs of a nursing home can be significant. According to Genworth’s Cost of Care Survey,[7] the average cost of an annual stay in a semiprivate room at a nursing home in 2017 was $85,775, with a 3% forecast five-year growth rate. It’s important to note that while nursing home costs can be significant, for most retirees the healthcare costs are effectively bimodal, with many retirees experiencing little or no cost and others facing significant expenditures.
Healthcare expenditures not only increase in retirement but are greater for retirees than for the working population. This difference is important when attempting to model how spending might change over time. In the Consumer Price Index for All Urban Consumers, or CPI-U, the weight of healthcare is approximately 8%,[8] which is significantly lower than its portion of total expenditures for older Americans. Alternative consumption baskets, such as the Consumer Price Index for Americans 62 years of age and older, or CPI-E, better reflect the expenditure distribution of older Americans and are likely a better proxy for how the base costs would change. Alternative consumption baskets such as the CPI-E have grown faster than more traditional consumption baskets such as the CPI-U used to measure inflation, in large part due to the higher weighting on health expenditures.
Given that healthcare represents a rising allocation of expenditures for retirees as they age, and that healthcare expenditures increase at a rate higher than inflation, it would seem that retiree spending should grow faster than inflation. For example, if we assume that Medicare premiums represent 65%[9] of total healthcare expenditures, that Medicare premiums increase 4% higher than base inflation, and that the remainder of health expenditures are regular medical expenses that increase 2% higher than inflation, the total medical/health expenses component of total retiree expenditures would increase by about 3.3% per year in real terms during retirement. In the absence of any other considerations, retiree spending should increase in real terms through retirement. For example, a financial planner might assume the retirement income need would increase by 2.5% throughout retirement versus a general inflation rate of 2%.
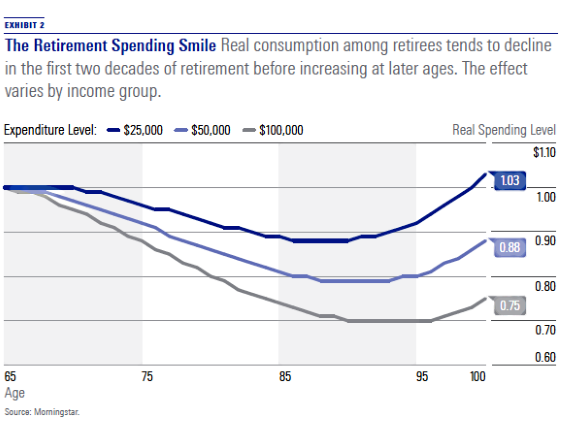
Despite Inflation, Spending Falls in Retirement In reality, however, retirees appear to decrease spending in real terms during retirement. While there has been much research exploring changes in spending and consumption at retirement (dubbed the "retirement consumption puzzle"), there is little research exploring how retirees change their consumption throughout retirement. Wolfe and Brazier (2018) is one example. Another is a study I conducted in 2014. I found that real consumption tends to decline initially and then increase at later ages, noting a "retirement spending smile" (Blanchett 2014). The effect varies by income level; those with higher expenditure levels tend to see larger declines (likely due to higher levels of discretionary spending). Exhibit 2 documents this effect, based on equation 1 in my 2014 paper, for a 65-year-old retiree, assuming initial spending levels in the first year of retirement of $25,000, $50,000, and $100,000.
It is not clear whether retirees reduce consumption throughout retirement in real terms by choice or necessity. I noted in my study that even well-funded retirees tend to reduce spending, which suggests some degree of choice is involved.
This lack of spending is found in other domains. For example, the value of retiree portfolios remains constant or increases over time (see Browning, Huston, and Finke, 2015) even after taking required minimum distributions, which are subsequently reinvested in other financial assets instead of spent (Poterba, Venti, and Wise, 2011).
The fact that retiree spending does not simply increase annually by inflation has important implications for other retirement modeling assumptions, such as how spending may change after a health shock. The default assumption might be that spending is unaffected (other than having to pay for the additional health expense), but this may not be the case. Spending might increase if the retiree incurs higher ongoing medical expenses, or spending might decrease if the retiree cuts back on spending due to health limitations (e.g., less travel and entertainment). We sought to explore this effect in greater detail.
Our Analysis We analyzed data from the Health and Retirement Study, a household survey of individuals over the age of 50 in the United States. We focused on actual healthcare expenditures to determine a potential shock, with a particular focus on outof- pocket expenditures, including those for drugs, health services, and medical supplies. We excluded health insurance premiums from our estimate of healthcare expenditures because these would not be considered a shock—they are known with relative certainty in the near-term (although the longer-term value is less certain given the unknown inflation rate). We used an event study framework, comparing health expenditures over time to base values in 2005. We applied several filters to the data to ensure data quality.
We looked at four types of spending: nondurable spending, durable spending, total spending, and total consumption. Durable spending was estimated by subtracting nondurable spending from total spending. We suspected spending would decline after a health shock, but it may well have increased, too. For example, De Nardi et al. (2016) notes that medical spending is persistent over time, with those in the top quintile of spending in one year having a 54% chance of being in the top quintile in the next year and a 48% chance of being in the top quintile in two years’ time. Presumably, at least some retirees could have health shocks that raise ongoing medical expenses.
What We Found We first studied the four types of spending as dependent variables in an ordinary least squares regression. Spending is averaged across the population in the study. We found that households that experienced a healthcare shock had lower future total spending, consumption, and nondurable spending. The fact that the relation was negative (and was statistically significant) suggests future spending decreases after a health shock. However, durable spending, primarily housing expenditures such as mortgage payments and rent, did not seem to be affected by health shocks. This is not surprising given the relatively fixed nature of durable spending.
Nondurable spending is likely the primary type of spending affected by a health shock. We looked more closely at nondurable spending after a health shock by dividing households into two groups: those with healthcare expenditures below a tested threshold level and those above a tested threshold. The results of the analysis are shown in Exhibit 3, which includes the median change for the two groups (Panel A) and the average change (Panel B).
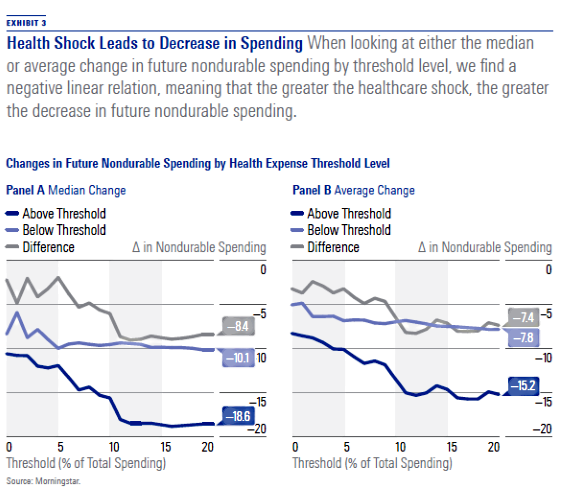
When looking at either the median or average change in future nondurable spending by threshold level, the relation is roughly linear (and negative). This suggests that the greater the healthcare shock, the greater the decrease in future nondurable spending. The impact can be approximated such that for each 1% of healthcare expenses, as a percentage of total spending, future nondurable spending drops by 0.5%. For example, if we assume a household has total spending of $100,000, of which $60,000 is on nondurable items, and has a $20,000 medical expense (which is 20% of total spending), the household’s future nondurable spending is expected to decline by 10%, or by $6,000, over the following four years.
Important Implications Forecasting retiree spending is difficult given the uncertainties associated with healthcare expenditures. In this article, we explored how spending changes after a household experiences an out-of-pocket health expenditure of varying degrees. We found consistent evidence that households hit by greater health shocks tend to reduce future spending in a relatively linear fashion, especially for nondurable items.
It is not clear whether the decision to reduce spending is by choice or by necessity (to replenish savings or as a precautionary decision in case other shocks occur). Regardless, these findings have important implications for financial planners interested in modeling healthcare expenditures during retirement.
[1] The complete version of the analysis can be found in the main paper, titled “Health Shocks and Subsequent Retiree Spending,” published in the The Journal of Retirement, Summer 2018, Vol. 6, No. 1, PP. 55–69.
[2] See research by Collinson (2016) and Allianz (2010).
[3] HealthView Services: 2017 Retirement Health Care Costs Data Report. White Paper.
[5] Medicare.gov
[6] Ibid.
[7] https://www.genworth.com/about-us/industry-expertise/cost-of-care.html
[8] https://www.bls.gov/cpi/tables/relative-importance/2016.pdf
[9] See Fronstin and VanDerhei, (2017) and Cubanski et al. (2014).
References Allianz. 2010. "Reclaiming the Future." White Paper.
Blanchett, D. 2014. “Exploring the Retirement Consumption Puzzle.” Journal of Financial Planning, Vol. 27, No. 5, PP. 34–42.
Browning, C., Huston, S., & Finke, M.S. 2016. “Cognitive Ability and Post-Retirement Asset Decumulation.” Journal of Family and Economic Issues, Vol. 37, No. 2, PP. 242–253.
Collinson, C. 2016. “Perspectives on Retirement: Baby Boomers, Generation X, and Millennials, 17th Annual Transamerica Retirement Survey of Workers.” Transamerica Center for Retirement Studies White Paper.
Cubanski, J., Swoope, C., Damico, A., & Neuman, T. 2014. How Much Is Enough? Out-of-Pocket Spending Among Medicare Beneficiaries: A Chartbook (Menlo Park, Calif.: Kaiser Family Foundation).
De Nardi, M., French, E., Jones, J.B., & McCauley, J. 2016. “Medical Spending of the US Elderly.” Fiscal Studies, Vol. 37, No. 3–4, PP. 717–747.
Fronstin, P. & VanDerhei. J. 2017. “Savings Medicare Beneficiaries Need for Health Expenses: Some Couples Could Need as Much as $350,000.” EBRI Notes, Vol. 38, No. 1.
Poterba, J.M., Venti, S.F., & Wise, D.A. 2011. “The Drawdown of Personal Retirement Assets.” National Bureau of Economic Research, Working Paper w16675.
Wolfe, B. & Brazier, R. 2018. “Spending in Retirement… or Not?” BlackRock Retirement Institute White Paper.
This article originally appeared in the Summer 2019 issue of Morningstar magazine. To learn more about Morningstar magazine, please visit our corporate website.
/cloudfront-us-east-1.images.arcpublishing.com/morningstar/U772OYJK4ZEKTPVEYHRTV4WRVM.png)
/cloudfront-us-east-1.images.arcpublishing.com/morningstar/O26WRUD25T72CBHU6ONJ676P24.png)
/cloudfront-us-east-1.images.arcpublishing.com/morningstar/WDFTRL6URNGHXPS3HJKPTTEHHU.png)
:quality(80)/s3.amazonaws.com/arc-authors/morningstar/951e122c-7299-4252-bafb-80cfefb25764.jpg)