
If Hot Hands Do Exist, What Then?
Momentum strategies look more credible, and market-timing tactics even less so.
/s3.amazonaws.com/arc-authors/morningstar/1aafbfcc-e9cb-40cc-afaa-43cada43a932.jpg)
Revisionism Friday's column discussed how a statistical glitch undermines one of behavioral science's most widely referenced papers, "The Hot Hand in Basketball: On the Misperception of Random Sequences" ("Hot Hand"). This error, discovered recently, reverses the 1985 paper's conclusion that basketball players were not likely to make their next shot after scoring on their previous attempts. In fact, they were: One successful shot tended to lead to another.
The refutation of Hot Hand ("Surprised by the Gambler's and Hot Hand Fallacies? A Truth in the Law of Small Numbers," by Joshua Miller and Adam Sanjurjo) illustrates what has become known as the "replication crisis"--the inability of future scientists to reproduce the results of their predecessors. Usually, this occurs because the original data was atypical. Substituting another sample yields different conclusions. In Hot Hand's case, though, the calculations rather than the raw numbers were challenged.
Surprisingly, Hot Hand’s authors did nothing unusual. Their computations were standard. That is why the paper survived not only its initial peer review, but also thousands of future readings over the next 30 years, without anybody realizing that something was amiss. Hot Hand’s authors were not alone in stumbling when measuring the relationship between past winning streaks and future outcomes. Others did, too.
Friday's article briefly discussed the math. (But only briefly, because I do not fully follow the argument. In that, I have plenty of company. For example, when initially asked about the rebuttal, Hot Hand's lead author, Thomas Gilovich, replied, "There are some things I agree with, some things I disagree with and some things, quite frankly, I still don't think I understand.")
Today’s column touches on the refutation’s investment implications.
More Momentum? PIMCO has a suggestion. "Thoughts on the Hot-Hand Debate in Basketball" advocates that researchers revisit the topic of mutual fund persistence. After all, the accepted lesson of Hot Hand was that people mistook mirages for patterns. If this conclusion is wrong, meaning that basketball fans' impressions were accurate, then perhaps those who believe that mutual fund managers have winning (or losing) streaks are correct. What's more, previous studies of fund persistence likely suffered from the same statistical woes as Hot Hand did.
So PIMCO conducted a test. Its researchers evaluated the quarterly returns of intermediate-bond funds for the 25-year period from 1993 through 2017. Was there a relationship between how a fund had performed during previous quarters (expressed in relative terms, compared with the fund’s stated benchmark), and how it then performed over the next quarter?
No and yes. No, if calculated according to traditional methods. “If we perform a paired t-test on the raw statistics, as in [Hot Hand], we cannot reject the null hypothesis.” In other words, conventional measurements show no connection. But when the calculation incorporates Miller and Sanjurjo’s recommended adjustment, PIMCO finds the relationship to be statistically significant, at the 1% level. That is, “hot” intermediate-term bond funds tended to stay that way.
PIMCO offers a major caveat. Coin flips--the gambles evaluated by Miller and Sanjurjo’s critique--are simpler events than are the relative performances of mutual funds. Coin flips yield only two possible outcomes: heads or tails. Mutual fund performances, in contrast, have a wide range of numerical results. For purposes of its study, PIMCO slotted all fund returns into two groups: 1) above benchmark or 2) below benchmark. That action could affect its study’s finding.
In short, as PIMCO’s researchers acknowledge, its white paper is suggestive, not conclusive. Moreover, even if after further investigation mutual fund performance is indeed found to be persistent, that doesn’t necessarily mean that money can be made from that knowledge. Many financial discoveries are technically true, but do not present investment opportunities.
All that said, there surely will be new studies commissioned on the performance persistence of financial assets, using updated statistical techniques. Presumably, several will find stronger evidence of investment momentum.
Looking Too Hard Another implication of the Hot Hand rebuttal is the danger of reading too deeply into the past. The statistical difficulty that Miller and Sanjurjo identify does not plague contemporary observers. Ask those who are watching a series of coin flips the probability that a coin that has landed heads on four straight occasions will land hands again, and most will instantly give the correct answer: 50%. The mistake only occurs when attempting to analyze historical, recorded data.
A similar effect occurs with investment analysis, albeit for different reasons. (The concept is related, but not the math.) Those who report on events contemporaneously perceive them less clearly than do those who come later. With hindsight, what once was chaos appears to become meaningful. The historian perceives patterns that were previously not discernible.
Whether these patterns are reality, or are imposed by the researcher, is difficult to know. Consider, for example, the Shiller P/E ratio, which measures the U.S. stock market's price/earnings ratio, using as its denominator not the past year's earnings (which is customary), but instead an average of the past decade's annual earnings. From January 1920 through December 1989, the ratio looked like this.
Exhibit 1: Shiller P/E Ratio, 1920-1989
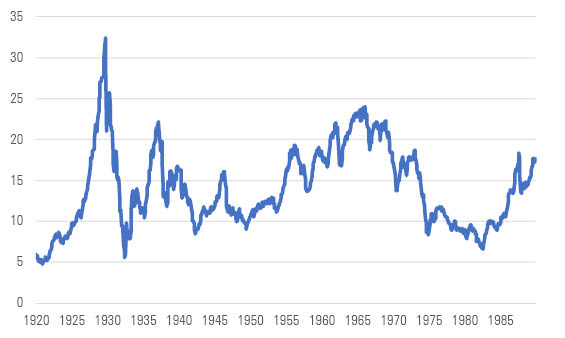
Source: DYQDJ
From the perspective of the 1990 chronicler, the chart’s lesson is clear. When the Shiller P/E ratio exceeds 20, only bad things happen. Three times the ratio moved past the black-magic mark. The first preceded the stock market crash of 1929; the second was immediately before the S&P 500 dropped 35% in 1937; and the third anticipated the bear market of the 1970s. What surprised equityholders on those occasions became no surprise when viewed through history.
The investment solution, obviously, was to clear out of stocks the next time that the Shiller P/E ratio crossed 20. It wouldn’t be long before the ratio dropped back below that mark.
Here is the subsequent chart, running from January 1990 until today.
Exhibit 2: Shiller P/E Ratio, 1990-Present
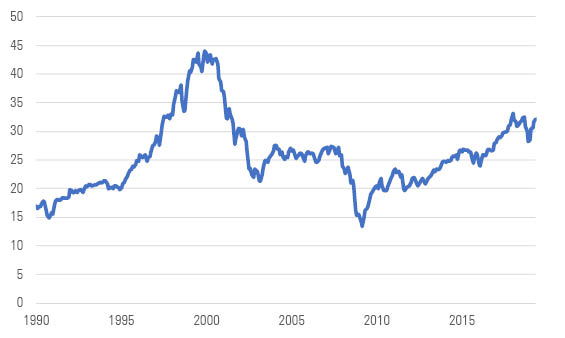
Source: DYQDJ
So much for the obvious. It seems that the act of recording and assessing the signals sent by the Shiller P/E ratio infused meaning where none existed. Well, perhaps meaning did once exist. But if so, the substance changed so greatly over the decades that the indicator became unworkable for the current generation.
Extracting lessons from the past is a tricky endeavor. The researcher may apprehend what never was there, or what once was present, but is no longer.
John Rekenthaler has been researching the fund industry since 1988. He is now a columnist for Morningstar.com and a member of Morningstar's investment research department. John is quick to point out that while Morningstar typically agrees with the views of the Rekenthaler Report, his views are his own.
The opinions expressed here are the author’s. Morningstar values diversity of thought and publishes a broad range of viewpoints.
:quality(80)/cloudfront-us-east-1.images.arcpublishing.com/morningstar/MFL6LHZXFVFYFOAVQBMECBG6RM.png)
:quality(80)/cloudfront-us-east-1.images.arcpublishing.com/morningstar/HCVXKY35QNVZ4AHAWI2N4JWONA.png)
:quality(80)/cloudfront-us-east-1.images.arcpublishing.com/morningstar/EGA35LGTJFBVTDK3OCMQCHW7XQ.png)