
The Best Way to Play Rising Fresh Water Costs
As fresh water demand exceeds supply, wide-moat Ecolab stands to benefit.
/s3.amazonaws.com/arc-authors/morningstar/ca8d2ce1-cd0f-433b-a52b-d163be882398.jpg)
Fresh water consumption continues to exceed readily available supply. Our outlook for rising fresh water costs portends smaller profits for a wide variety of manufacturing companies that consume high volumes of water. However, these companies can mitigate margin contraction with the use of water management systems. Ecolab ECL is a market leader in water management and is well positioned to take advantage of the growing need for water treatment. Our research indicates that the value proposition of Ecolab’s water treatment solutions will improve significantly in the coming years.
Ecolab’s water business might be considered noncore by some, as the company is better known for its cleaning and sanitation solutions. However, we expect the water treatment business to generate 40% of the company’s incremental profits over the next decade. We think the magnitude of this contribution is somewhat underappreciated by the market, even as market-implied expectations for the legacy operations remain lofty. Trading at 17.7 times forward EBITDA, the company’s multiple seems befitting of the wide moat rating we assign. Ecolab’s economic moat is built on customer switching costs underpinned by a razor-and-blade business model.
As a separate consideration, the dearth of readily available fresh water represents a growing concern on the environmental, social, and governance front. This dynamic is likely to attract growing interest from environmentally responsible investors as ESG principles gain mindshare.
We value Ecolab at $180 per share, roughly in line with the current share price but above the median consensus estimate of $172. We contend that this divergence is primarily due to our outlook that rising fresh water costs will create demand for Ecolab’s industrial water management products and services. While our 2020 estimates are also slightly above consensus, we point to the longer-term profit growth from Ecolab’s water business as the critical driver of our more optimistic fair value estimate. Our bullish outlook for Ecolab’s water business is partially offset by our view that the energy business will not be able to reach management’s long-term target of a high teens operating margin.
Water Business a Growing Driver of Profits We think the future earnings power of Ecolab's water management business is overlooked, as it currently generates just 23% of total revenue. However, over the next decade, we forecast that the water business will generate over 40% of companywide operating income growth. This translates into over $1 billion in operating profit growth from the water business, helping the company increase operating profits from $1.95 billion in 2018 to $4.59 billion by 2028. Growth from the water business will be supported by rising fresh water costs that will drive demand for Ecolab's water management products.
Ecolab entered the water business with the 2011 acquisition of Nalco. On the day the acquisition was announced, Ecolab’s stock fell 7.4% as market participants did not see many natural synergies between the two companies. Ecolab’s main customers were hotel operators, food-service firms, and food and beverage manufacturers. Nalco, on the other hand, served mainly industrial and energy companies.
In our view, Ecolab’s acquisition of Nalco reflected astute capital allocation. The acquisition set up Ecolab to take advantage of growing long-term demand for water management products. However, the hidden gem has been the company’s ability to develop and cross-sell new products. Ecolab has expanded the offerings of Nalco’s legacy industrial water business in order to market valuable solutions to its own existing customer base. This has been achieved via the development of new water management products and services tailored to food and beverage manufacturers and institutional customers, such as hotels and food-service providers. The Nalco acquisition also allowed Ecolab to cross-sell other products and services.
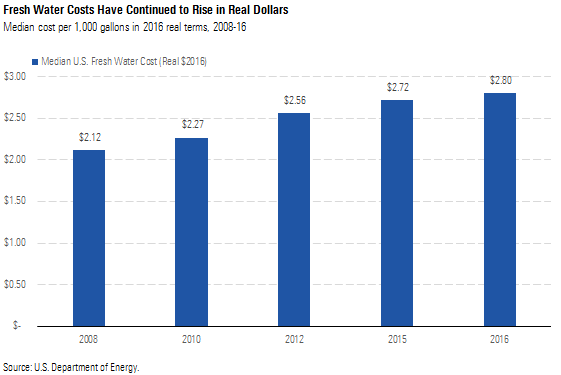
Rising Fresh Water Costs Will Drive Demand for Water Management Systems U.S. fresh water costs have risen faster than inflation over the last decade and will do so over the next decade as well. We forecast fresh water costs to double from 2016 to 2030. As demand for water has grown, surface water (ponds, streams, rivers, and lakes) is no longer sufficient to meet fresh water demand in most areas of the United States. As a result, the excess demand is served by pumping water from large underground bodies of water called aquifers. Increased pumping expenses are a major driver of higher water costs as aquifers deplete. Once pumping expenses increase, they rarely reverse. It takes decades or even centuries for an underground aquifer to be replenished, assuming no further pumping. In addition, increased groundwater pumping can lead to reductions in surface water flows, which results in more groundwater being needed (and higher pumping expenses) to meet total fresh water demand. The result of deeper underground pumping has been higher water costs. Median fresh water costs rose 32% to $2.80 per 1,000 gallons in 2016 real dollars from 2008 to 2016. This represents a 3.3% compound annual growth rate in real terms.
The three main components of water costs are incoming fresh water, wastewater (water that has been used), and base infrastructure costs. Base infrastructure costs vary widely and can increase significantly depending on the need to replace infrastructure in a given water district. Although wastewater and base infrastructure costs have also been rising, we limit our scope to incoming fresh water costs. This is the category over which any given company has the greatest influence, thanks to water management systems.
Largest Driver of Cost Increases Is Groundwater Depletion As water demand exceeds easily available supply, underground aquifers have faced steady depletion over the last 70 years, and this will continue. This results in the need to pump water from greater depths, which increases costs. We analyzed roughly six decades of groundwater depletion data in the U.S. While depletion rates fluctuate from decade to decade, the data show depletion rates are positive and exhibit mean reversion tendencies. As such, our long-term forecast for groundwater depletion assumes the median long-term rate of 103 feet per year. From 2000 to 2008, U.S. groundwater depletion increased to roughly 174 feet per year, the fastest such rate at any point in the last 70 years. Historical groundwater depletion rates have varied widely over time. This is due to the variable amount of surface water available, which changes from year to year based on rainfall and the amount of snow that melts and flows into rivers and streams.
Although some may point to climate change as the reason behind the increased groundwater depletion rate, our winter weather analysis showed one effect of climate change is increased precipitation. Greater precipitation means more surface water and less need for groundwater, all else equal. Increased precipitation will play a role in the mean reversion of groundwater depletion rates from the high depletion rates that occurred from 2000 to 2008. However, we still forecast depletion to occur, which will require increasingly deeper pumping.
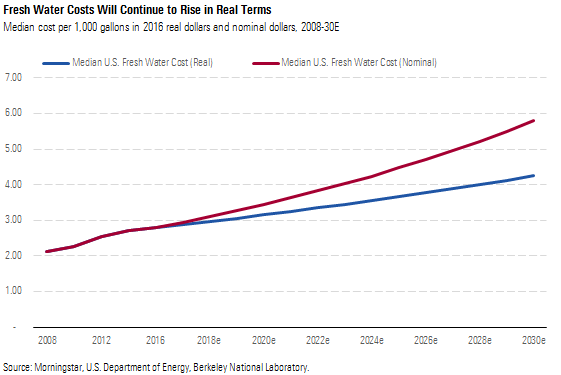
As the cost to pump water from greater depths increases, we expect water costs to double by 2030. As more groundwater is needed to meet demand, pumping expenses will increase from having to pump water out of the ground from deeper levels. Lower underground water levels require more energy to bring the same gallon of water to the surface.
We expect median fresh water costs to double from 2016 to 2030 in nominal terms. Berkeley National Laboratory estimates that it takes 2.05 kilowatt-hours of energy to pump an acre-foot (325,851 gallons) of water one foot of distance. Based on our $0.13 per kWh forecast for median U.S. electricity prices, we estimate that 1,000 gallons will cost around $0.0008 per foot pumped. Using our long-term depletion forecast of 103 feet per year, we calculate costs will rise $0.08 per 1,000 gallons, which translates into a 3.0% annual increase in real terms, or roughly 5.3% in nominal terms. Our forecast for fresh water costs lines up well with the 3.3% average annual real cost increase from 2008 to 2016, most of which we attribute to increased pumping expenses from groundwater depletion.
Industry Uses Roughly Half of U.S. and EU Fresh Water Industrial water use is the largest source of water demand in many developed economies, such as the U.S. and European Union. In the U.S., roughly 52% of all water is used for industrial purposes, which includes thermoelectric power generation, manufacturing, and mining. The EU's water use is similar, with 48% of water used by industrial and services companies. As a result, industrial water use is also the largest driver of water price increases as greater demand requires more costly water supply.
Different companies use varying amounts of water to manufacture similar products. Water use varies near 3 times for soft drink bottling between the lowest and highest plants. Water use in paper mills can vary by almost 12 times. These wide variances are primarily due to the current water reduction technologies (or lack thereof) that have been installed. Companies without water management systems likely sit at the high end of industry water use. For these companies, higher water prices will result in expenses rising faster than rivals that employ water reduction technologies.
Additionally, water use varies widely for lodging. While different amenities within hotel rooms, such as an in-room jacuzzi, may contribute to some of the difference, we think most of this variation is due to the water-intensive laundry and cleaning technologies used.
Rising Water Costs a Growing ESG Risk for Industrial Companies Management commentary across industrial companies that consume high volumes of water would seem to indicate that rising water costs have been overlooked. Currently, based on Sustainalytics data, the majority of companies do not have a strong plan in place for water management. While the majority of companies in water-intensive industries, such as food and beverage manufacturing, have some plan in place, data indicate that water management has not yet become a priority.
We expect this to change. As water costs continue to rise and have a greater impact on profits, companies across all industries will look to manage them more proactively. Water-related risks include rising water costs and the more extreme concern of water scarcity. Water scarcity issues could require a company to reduce or halt production in locations where supply is insufficient. This could lead to material profit declines and, in turn, shareholder value destruction. While we think water scarcity issues will be less impactful than water cost increases in most parts of the U.S., the risk is worth noting.
Value Proposition of Water Management Systems Will Improve As water costs continue to rise, demand for water management systems will grow. This is due to greater cost savings for companies that install and use water management systems. Using the current median U.S. fresh water cost, we estimate that the water and energy savings a company could achieve from using Ecolab's water management systems is slightly better than break-even. We calculate a 4% unit production cost reduction.
Currently, a representative business that employs a water management system should already enjoy modest savings. However, due to rising water costs, the value proposition of a water management system installation will improve further. In turn, this will drive greater demand. Given our outlook that water prices will double by 2030, the same manufacturer would ultimately be able to reduce unit production costs by 8% (in real terms).
Rising water costs would also fuel growth in desalination plants. Fresh water produced in a desalination plant can serve as a substitute for pumping groundwater. Fresh water from a desalination plant is currently around 30% more expensive than the current median U.S. fresh water cost. Using the same representative business mentioned earlier, we calculate a 7% cost savings when using desalinated water. This 7% cost savings increases the economics of using of a water management system for industrial companies located along the coasts.
Although water cost increases will vary widely by region, rising water costs will drive greater adoption of water management systems across the board. Our water forecast relies on the median U.S. water cost, which shows that water treatment systems can currently provide a 4% cost savings for a representative company. As such, we forecast positive cost savings for companies in any location once water costs are at or above the current median water price (in 2016 real dollars).
Regulations Could Play a Role in Demand A changing regulatory environment could boost demand for water management systems that would benefit water companies including Ecolab. While we do not see water management regulations as a likely outcome in the U.S., other governments across the globe are studying the issue. There is a regulatory risk to businesses without a management system that water use regulations could be created.
In 2016, the International Resource Panel of the United Nations forecast that by 2030, half of the world’s population will suffer from severe water stress. This would result in governments having to spend $200 billion per year on water supply versus the historical average of $45 billion-$50 billion. Increasing water stress in more regions is likely to pave the way for more stringent regulations that require industrial businesses to reduce water use. This would be akin to regulations that limit air emissions.
The sustainable management of water and sanitation for all is Goal 6 of the United Nations Sustainable Development Goals. The UN goal combined with rising fresh water costs will likely put water management on the radar of more regulators globally.
China is studying water management regulations to ensure the availability of its fresh water supply. Similarly, the EU is studying water scarcity issues and may ultimately set water use regulations by industry, which would likely force companies to adopt a water management system similar to the ones that Ecolab offers.
While we do not include the impact of regulations in our base-case forecast, increased regulation could serve as a long-term upside catalyst for Ecolab’s industrial water business.
Wide Moat Stems From Customer Switching Costs The most important driver of our wide moat rating is Ecolab's installed base and consumables model, commonly known as the razor-and-blade model. Ecolab leases proprietary cleaning equipment and devices to its customers. It then sells a steady stream of proprietary consumables required to keep the machines running. In addition to the cost savings that Ecolab's customers enjoy from lower energy and water costs, Ecolab minimizes downtime for key pieces of its customers' machinery, allowing business processes to proceed without costly interruptions.
Ecolab uses a direct selling model. The company employs a highly specialized salesforce that is segmented by industry. This industry-specific knowledge allows Ecolab’s sales team to act as a consultant for its customers across multiple areas of their business related to cleaning, sanitation, and water management. As a result, Ecolab is able to cross-sell products and services, which enhances customer switching costs. For a customer with cleaning, sanitation, and regulatory compliance needs, there is a fixed-cost component to the management of each supplier relationship. Accordingly, part of Ecolab’s value proposition is that its wide-ranging product offerings and global scale make it a one-stop shop for customers. Engaging solely with Ecolab saves customers time and money aggregating orders and reorders across a variety of high-volume products and critical services. For example, a hotel customer that uses Ecolab’s products for dishwashing, laundry, cleaning, food-service sanitation, pest control, and regulatory compliance would have to manage a far more complex and costly supply chain if it were to replace Ecolab with multiple suppliers. This dynamic supports pricing power for Ecolab.
Ecolab also benefits from traces of intangible assets and cost advantage from its scale. The company develops patented cleaning products that reduce its customers’ water and energy expenses. This allows Ecolab to add value to its customers through continual expense reduction from new, differentiated products. For its institutional business, Ecolab is one of only two global players. The company’s global scale allows restaurants and hotels with a global or national franchise model to ensure uniform cleaning standards and maintain the same cleaning processes among franchises. However, we do not see either of these moat sources as being strong enough in isolation to warrant a moat.
Institutional Business Benefits From Customer Savings and Favorable Trends Over the next decade, we expect Ecolab's institutional business to increase profits nearly 80%. The water, energy, and labor savings for its institutional customers are already meaningful at current water prices, which has propelled Ecolab to become the number-one supplier for this customer segment. The institutional segment is primarily food-service operators, hotels, hospitals, and long-term care facilities. The company's value proposition works for both single locations and restaurant or hotel chains. The total cost using Ecolab's products saves a single location money each year versus going through distributors or competitors that undercut Ecolab on prices.
The cost savings are also multiplied for chains. This is largely due to greater fixed-cost labor savings for chains as buying multiple products from Ecolab results in fewer employees being needed to manage orders and reorders.
While Ecolab’s products and services can add value through cost reductions, the company also benefits from two favorable trends: increased consumer preferences for fresh food and a rise in the number of long-term care facilities. From a cleaning and sanitation perspective, a rise in fresh food creates supply chain complexity that can lead to disastrous outcomes, such as the string of Chipotle food safety incidents that started in 2015. Shortly after the initial incidents, Chipotle hired Ecolab to help perform an overhaul of its food safety process.
In addition to food safety services, Ecolab has developed new systems that can track food safety measures, regulatory compliance, and cleaning and sanitation data at each location. For large-scale food-service providers preparing fresh food, this provides thousands of daily data points that can be used to prevent a food safety incident that can damage a food-service provider’s reputation. These technological innovations help to enhance Ecolab’s switching costs and promote pricing power as the technology further engrains Ecolab in its customers’ processes.
Additionally, a small but growing portion of Ecolab’s institutional customers are long-term healthcare facilities. As the baby boomer generation ages, the number of U.S. octogenarians will almost double over the next decade. This will create greater demand for long-term healthcare facilities, which in turn should benefit Ecolab as a critical supplier.
In recent years, Ecolab has been able to raise prices for its products sold to institutional customers. However, raw materials inflation has recently slowed the pace of operating profit growth. As raw materials headwinds abate this year, we expect materially higher profits in the institutional segment as Ecolab will realize higher prices with stable to declining input costs. Over the long term, due to favorable trends for the institutional business, we forecast operating profits to grow from just over $1 billion in 2018 to around $1.8 billion by 2028.
We Are in Favor of the Energy Business Spin-Off Our outlook for oil production is that increased production of low-cost U.S. shale-based oil has reduced the need to develop higher-cost sources such as deep-water drilling. Ecolab's upstream energy business sells products directly to oil producers and oilfield services providers, and its sales and profits are closely tied to the type of oil well. Ecolab generates average revenue of $0.45 per barrel of oil produced from ultra-deep-water projects, yet just $0.25 per barrel from low-cost shale projects. As more oil production growth comes from low-cost shale and less from deep water, we forecast this will weigh on the upstream energy business' results. This underpins our outlook that the consolidated energy business will not be able to achieve management's goal of high teens margins in line with the industrial segment.
Conversely, sales and profits in the downstream portion, which services refiners and petrochemical producers, operate more like Ecolab’s industrial business. For its downstream energy customers, Ecolab can offer water and energy cost savings as well as reduced maintenance downtime, which adds significant value and provides Ecolab with pricing power.
These different business model dynamics show up in the operating margins as well. Downstream margins are in line with the midteens margins from the industrial segment, while the upstream energy business has suffered in recent years from a decline in deep-water oil production. Due to the different margin structures, the upstream energy business generated nearly 70% of total energy segment revenue but less than half of operating profits in 2018.
In early 2019, Ecolab announced plans to spin off its upstream energy business, which generated roughly $2.4 billion in sales and $170 million in operating profits during 2018. The transaction is expected to take place in 2020. We are in favor of the spin-off, as the upstream energy business has a different operating model than the rest of Ecolab. We think it would run better as a stand-alone business that allows for greater management focus and optimization.
/cloudfront-us-east-1.images.arcpublishing.com/morningstar/PLMEDIM3Z5AF7FI5MVLOQXYPMM.jpg)
/cloudfront-us-east-1.images.arcpublishing.com/morningstar/I53I52PGOBAHLOFRMZXFRK5HDA.jpg)
/cloudfront-us-east-1.images.arcpublishing.com/morningstar/CEWZOFDBCVCIPJZDCUJLTQLFXA.jpg)
:quality(80)/s3.amazonaws.com/arc-authors/morningstar/ca8d2ce1-cd0f-433b-a52b-d163be882398.jpg)