
How Rare Was December's Stock Market Loss?
What history suggests about last month's decline.
/s3.amazonaws.com/arc-authors/morningstar/1aafbfcc-e9cb-40cc-afaa-43cada43a932.jpg)
Something Different December brought an unfamiliar emotion: investment dismay. For the first time in a long while, stock market problems made the headlines. Few U.S. adults entered the New Year without realizing that equities were slumping. Most, however, shared my position: I knew that stocks were down, but not by how much, nor how the month rated among stock market history.
So, here we are. The S&P 500, it turns out, had a total return of negative 9.03% in December 2018. That places the month as the 11th worst over the past half century, from 1969 through 2018. Which sounds a bit worse than the reality.
Although only 11 months had monthly losses of at least 9%, another seven fell between 8% and 9%. Here are those 18 cases:
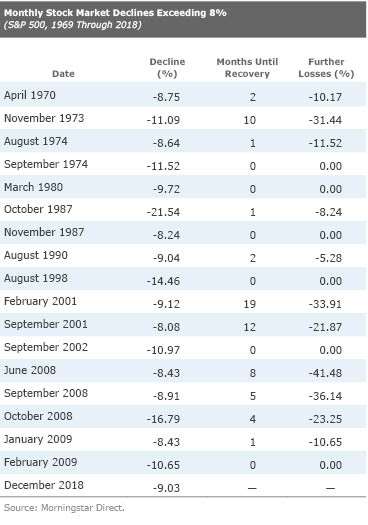
The Largest Flops Only three times during the 50-year period did the S&P 500 drop more than 12% during a calendar month: October 1987, August 1998, and October 2008. The first and third dates made the investment-history books, one being the month that contained "Black Monday" and the other occupying the center of the financial crisis. In contrast, the August 1998 downturn is less-remembered.
In fact, I did not recall it at all. When I first saw that date, I said to myself, "Aha, the Asian financial crisis"--when traders hounded several Asian countries into devaluing their currencies, thereby leading to massive stock market sell-offs within those countries and ripple effects across the globe. Wrong. That occurred the year before, in 1997. The reasons for August 1998's problems lay elsewhere.
The surface explanation is clear. Russia devalued its currency and the giant hedge fund Long-Term Capital Management went kaput. Less obvious is why those events damaged U.S. stocks so severely. Russia was an isolated economy, and Long-Term Capital Management a single investment fund. Those butterflies flapped, but they did not greatly affect the global weather.
Consequently, domestic equities immediately recovered--and then some. The S&P 500 gained 6% in September 1998, another 8% in October, 6% in November, and 6% yet again in December. What bothered investors greatly in August, quickly bothered them not at all. It is difficult not to arrive at the conclusion that August's sell-off represented a fine buying opportunity. Stock shareholders overreacted.
Looking Ahead Which leads to this column's second half. When stocks do suffer sharp sell-offs, what are their subsequent performances? Do sudden losses typically signal future problems, as with October 2008 (which was followed by four additional months of pain)? Or, as was the case with Black Monday and in the summer of 1998, do equities tend to rebound quickly?
Those questions are addressed by the table's last two columns, which list: 1) the number of additional months before equities resumed their upward climb, and 2) the cumulative additional losses posted by the S&P 500 for those months that weren't promptly followed by bull markets.
Most of the time, buying on the dips proved profitable. Setting aside December 2018, where of course we do not know the ultimate outcome, the S&P 500 fell by at least 8% on 17 occasions. Six times, stocks immediately rose. On another five occasions, the ultimate recovery didn't occur for another month or two, but the incremental losses were modest, at 5% to 10%. Staying invested would have been the correct decision.
The Bad News The remaining six cases, however, are worrisome.
1) November 1973 Stocks had been slumping all year, then fell another 11% in November. A buying opportunity it was not. Those who put money to work at month's end, sensing a bargain, had to wait almost a year before stocks began to right themselves--and considerably longer than that to break even. That inflation was rising, thereby eroding real returns, made a bad story even worse.
2) February 2001 This downturn was a full year old. It was tempting to think of February's 9% decline as the bear market's final blowout. (As a matter of fact, I was tempted.) Such was not the case. This was merely one bad month of a long series. Before all was said and done, an S&P 500 portfolio would lose an additional 33% of its value, and the upturn would not begin until late 2002. Ouch.
3) September 2001 Another false alarm. The bottom remained 12 months away.
4) June 2008 In the summer of 2008, the housing market had been troubled for a while, by rising defaults from subprime real estate loans. Although these problems had caused occasional problems for equities, the damage had not been large because the housing market's woes were viewed as being mostly self-contained. That view began to change in June--correctly, as it turned out. The stock market's losses were the direct opposite of a buy signal. They were instead an omen.
5) September 2008 See above. The housing market continued to unravel. The month's sell-off was a precursor. More pain would follow.
6) October 2008 In the midst, once again. After October, an argument could be made that stocks' losses had created a genuine opportunity. Equities would struggle for the next four months, and lose another 23% before righting themselves, but in the grand scheme of things, those costs would be dwarfed by stocks' huge gains from spring 2009 through autumn 2018. But who views schemes that grandly? Few would have been happy during 2008's long, long winter.
Wrapping Up In summary, there have been only three prolonged bear markets during the past half century: 1) 1973-74, 2) 2000-02, and 3) 2008. Each time, stocks posted at least one steep monthly loss early in the downturn. Thus, to address this column's second set of questions, although buying after stocks take large monthly damage has mostly proved profitable, the tactic has not been foolproof. About one third of the time, it would have caused significant regret, at least for the short term.
John Rekenthaler has been researching the fund industry since 1988. He is now a columnist for Morningstar.com and a member of Morningstar's investment research department. John is quick to point out that while Morningstar typically agrees with the views of the Rekenthaler Report, his views are his own.
The opinions expressed here are the author’s. Morningstar values diversity of thought and publishes a broad range of viewpoints.
/cloudfront-us-east-1.images.arcpublishing.com/morningstar/MFL6LHZXFVFYFOAVQBMECBG6RM.png)
/cloudfront-us-east-1.images.arcpublishing.com/morningstar/HCVXKY35QNVZ4AHAWI2N4JWONA.png)
/cloudfront-us-east-1.images.arcpublishing.com/morningstar/EGA35LGTJFBVTDK3OCMQCHW7XQ.png)
:quality(80)/s3.amazonaws.com/arc-authors/morningstar/1aafbfcc-e9cb-40cc-afaa-43cada43a932.jpg)