
What’s the Right Asset Allocation for Retirement?
A new study illustrates that if volatility is high or stock returns muted, a heavy equity allocation fails.
/s3.amazonaws.com/arc-authors/morningstar/1aafbfcc-e9cb-40cc-afaa-43cada43a932.jpg)
The Hard Problem Investing for retirement is straightforward: Place as much in equities as is comfortable, contribute regularly, keep costs low, and let time do the work. Investing during retirement is far more complex. Additional considerations include establishing the withdrawal rate, determining the time horizon, and deciding how flexibly to manage both the portfolio and withdrawal rate in response to stock-market meltdowns.
Computers are untroubled by such complications. A routine solves the equations, and out spits an answer. The difficulty lies in making the answer feel real, as opposed to a parlor trick. How was that figure generated? What are its limitations? The computer is silent on that subject. It can do the math, but it can explain neither the process nor the result.
Such occasions call for scenario analysis, or, to use a less-technical term, asking "What if?" Underlying the computer's calculations are a series of assumptions. Changing the most important of those assumptions, to learn how deeply a recommendation depends upon its key inputs, creates insight. Investors won't ever calculate multidimensionally, as the computer does, but by tinkering with the parts, they can develop a sense of how the whole comes together.
Enter: Estrada and Kritzman Thus, this column, which examines how retirement asset-allocation proposals are affected by stock-market projections. The source is a working paper entitled "Toward Determining the Optimal Investment Strategy for Retirement,"[1] by IESE Business School's Javier Estrada and--a name appearing in the Chartered Financial Analyst curriculum--Mark Kritzman of Windham Capital Management.
The authors employ a useful new measure they call the coverage ratio to gauge an investment strategy's success. Further below, I will outline its properties, but for purposes of this discussion, those details aren't necessary. What matters is that the coverage ratio is a sound, reasonable way to score a retirement strategy's investment success and that it operates conservatively, by penalizing failure more than rewarding success. Therefore, it does not arrive at high equity positions lightly.
For all analyses, the time horizon is fixed at 30 years. (Friday's column will illustrate how reducing the time horizon affects the asset allocation.) The withdrawal rate is similarly stable, at 4% in real terms. That is, the first year's payout is set at 4% of the initial investment, with each subsequent withdrawal matching the previous year's after being adjusted for inflation. The portfolios are rebalanced annually.
What Did Happen? The analysis begins by looking backward. What would have worked in the past? For that exercise, the authors use a comprehensive data source, which provides 86 periods of rolling 30-year total returns for 1) equities and 2) bonds, starting with 1900-29 and finishing with 1985-2014, from 21 countries. The upshot: stocks, stocks, stocks! According to the coverage ratio, the best-performing asset allocation for 12 of the 21 nations, since 1900, would have been 100% equities. The lowest allocations are for Sweden (!) and Portugal, at 60%.
Those figures seem high, obviously. As the coverage-ratio calculation uses risk tolerance as an input, the suspicion arises that the authors modeled unusually aggressive investors. However, they dispel that qualm by increasing the shortfall penalty and decreasing the reward for creating legacy assets. No matter their adjustments, the U.S. equity recommendations never fall below 80%.
The authors explain: "We suspect that our approach yields relatively aggressive strategies for two reasons. First, the equity-risk premium was relatively high in most markets in our sample; and second, we use a 30-year retirement period, and for such long investment horizons stocks have far more than not outperformed bonds."
That's all well and good. As the authors note, though, investors cannot avail themselves of the past. They must instead experience the unknown, which could bring lower stock-market profits, higher volatility, and/or less friendly performance sequences. It is useful to know the history but rash to rely solely upon it.
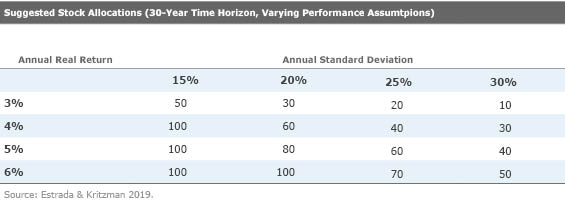
What Might Happen? The authors therefore considered the unpleasantries. They fixed bond-market performance at an average annual return of 2% real (the historic U.S. norm) and an average standard deviation of 3% (optimistically low). Then they shaved the stock market's long-term average annual return of 6.4% real. In addition, they boosted volatility. The U.S. stock market's long-term annual standard deviation is 18%; the authors test figures that range up to 30%. Then they ran their Monte Carlo simulations.
Both sets of changes, those for return and those for risk, had strong effects.
Halving the real stock-market return, to 3% from a bit more than 6%, slashes the equity weighting at every level of volatility. At the calmest standard deviation evaluated, an annual average of 15%, the suggested equity position drops to 50% from 100%. For all other levels of volatility, it declines even further, as a percentage of the initial recommendation. If stocks don't make considerably more than bonds, they don't much help a portfolio.
You probably suspected as much, although it is useful to see the specific numbers to put scale to the intuition. What you may not have realized is that volatility damages stocks' attractiveness as much as does reduced total returns. Doubling volatility while keeping returns fixed has a similar effect to halving returns while keeping volatility fixed. The return and risk levers have equal strength.
This can come as a surprise, as returns are generally regarded as tangible, while risk is psychological. But that dichotomy does not hold for withdrawal strategies, wherein removing monies from a depleting portfolio can lead to a vicious circle, whereby the withdrawals become such a large percentage of portfolio assets that the investment enters a death spiral. It cannot replace with market appreciation what it loses while funding retirement benefits.
In summary: If history at least somewhat repeats itself, retirees who truly possess 30-year time horizons (one can sometimes be optimistic about such things) will thrive with equity-heavy portfolios. However, if returns are substantially lower, or risk substantially higher, then a 50/50 allocation will perform better. Should both events occur, well … just own bonds!
Postscript: The Coverage Ratio In its basic form, the coverage ratio graphs as a straight line. It divides the length of time that a portfolio allocation can sustain its withdrawal rate by the length of the retirement period considered. For example, if the portfolio survives for 27 years before depleting, and the retirement period is established at 30 years, then the coverage ratio = 27/30 = 0.9. Similarly, if the portfolio lasts for 33 years (meaning that it leaves legacy assets if the retiree dies at the 30-year mark), then the coverage ratio = 33/30 = 1.1.
This straight line is then modified by a risk-tolerance factor, such that shortfalls are penalized more than windfalls are rewarded. In practice, therefore, the coverage ratio for a portfolio that survives 27 years might be calculated at 0.85, or even 0.80. Conversely, the portfolio that lasts 33 years would not receive a ratio of 1.1. That amount would be discounted to reflect the fact that excess assets are less important than not suffering a shortfall.
[1] Estrada, J., & Kritzman, M. 2019. "Toward Determining the Optimal Investment Strategy for Retirement." J. Investing, submitted. https://papers.ssrn.com/sol3/papers.cfm?abstract_id=3303153
John Rekenthaler has been researching the fund industry since 1988. He is now a columnist for Morningstar.com and a member of Morningstar's investment research department. John is quick to point out that while Morningstar typically agrees with the views of the Rekenthaler Report, his views are his own.
Document 678500 was successfully saved.
The opinions expressed here are the author’s. Morningstar values diversity of thought and publishes a broad range of viewpoints.
:quality(80)/cloudfront-us-east-1.images.arcpublishing.com/morningstar/MFL6LHZXFVFYFOAVQBMECBG6RM.png)
:quality(80)/cloudfront-us-east-1.images.arcpublishing.com/morningstar/HCVXKY35QNVZ4AHAWI2N4JWONA.png)
:quality(80)/cloudfront-us-east-1.images.arcpublishing.com/morningstar/EGA35LGTJFBVTDK3OCMQCHW7XQ.png)