
Default Investments: Made to Stick?
Plan participants stay with some types of vehicles longer than others.

By David Blanchett and Dan Bruns
The Pension Protection Act of 2006 provided safeharbor for three types of qualified defaultinvestment alternatives, or QDIAs, in defined-contributionplans: target-date funds, target-risk(or balanced) funds, and managed accounts.Since 2006, target-date funds have emerged as thepredominant default choice among plansponsors. However, there is little researchexploring the likelihood of the participants stayingin various default investment options. In thisarticle, we explore the demographics associatedwith default acceptance and which default optionappears to be the “stickiest” among defined-contributionparticipants.
The Rise of Defaults There has been a significant increase in the useof "intelligent" defaults in defined-contributionplans over the past decade. Previously, thedecision to participate in a defined-contributionplan was voluntary; the participant had to opt inthe plan and determine things such as theappropriate savings rate and portfolio allocation.Today, smarter defaults allow the participant toautomatically enroll in the plan at a deferral rateand an investment solution determined by the plansponsor. This small change in decision architectureresulted in a meaningful increase in participation(Madrian and Shea, 2001, and Choi et al., 2002).
While a robust body of research explores featuressuch as automatic enrollment, there is limitedliterature on who is more likely to accept thedefault. Auto-investing presents a differentset of considerations versus automatic enrollmentand default savings.
Of the three types of QDIAs that were introducedin 2006, target-date funds have become theclear favorite among plan sponsors and, as such,have seen a tremendous growth in assets.According to research by Callan (2018), 91% ofplans offer a target-date fund and 85% ofplans use it as the default (versus 5% for managedaccounts and 6% for a target-risk or balancedfund). Assets in target-date mutual fundshave increased roughly sevenfold, from $180billion to $1.3 trillion, from December 2007 toDecember 2017.[1]
Overall, the shift away from participant-directedportfolios, where each employee is effectively aportfolio manager, to professionally managedinvestment solutions is likely to improve participantoutcomes. Therefore, it would appear prudentto study the stickiness of various defaultinvestment solutions; naturally, stickier investmentdefaults would appear to improve participantoutcomes because they reduce the numberof participants selecting investments themselves.
The Data Set To better understand default acceptance,we conducted an analysis from a data set providedby a recordkeeper of U.S. defined-contributionplans as of Dec. 31, 2017. The data includeswhether the participant was defaulted into his orher portfolio and the date the decision was made.
The default option varies by plan and couldbe a balanced fund, target-date fund, or managedaccount. Demographic variables includingage, date of participation in the plan, deferral rate,salary, and plan balance are also included. Ouranalysis excludes any plans where less than 25%of the participants were not invested in thedefault investment (because it is unlikely theseplans have consistently made the default availableto all participants). Data was also scrubbed forreasonableness (negative salaries, missingbirthdays, etc.). Combined, these filters reduce thetest data set to 264,411 participants across 318401(k) plans.
Who Accepts the Default Investment? In our analysis, we find that age is the predominantvariable used to determine the default investmentfor a participant, especially when atarget-date fund is the default. Target-date fundsare most commonly available in five-yearvintages, and a participant is defaulted to the fundthat corresponds closest to his or her expectedretirement age.
In Exhibit 1 , we see that default acceptancedeclines from about 80% of participants at age 25(and about 60% of assets) to around 60% ofparticipants by age 65 (and about 40% of assets).These estimates are similar to the defaultacceptance estimates noted by Clark and Young(2018), based on defined-contribution plansat Vanguard. They note that 84% of participantsare 100% invested in the default option after oneyear, 82% by two years, 77% by three years.
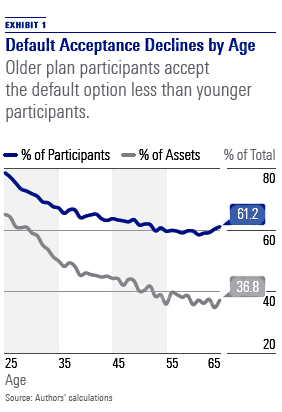
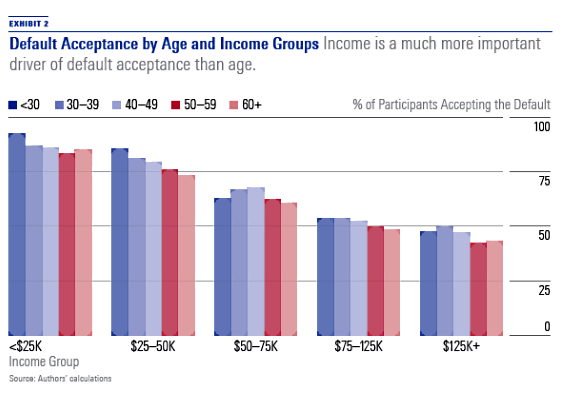
Exhibit 1 provides clear evidence that defaultusage is lower for older participants. What is notclear, though, is the extent to which age and yearsof plan participation are related to the decisionto accept the default. It could be a differentattribute associated with age is driving this effect,such as income. To demonstrate this potentialeffect, we first separate participants into five salarygroups that roughly correspond to the quintileincome break points across the data set (less than$25,000, $25,000 to $49,999, $50,000–$74,999,$75,000–$124,999, and greater than or equalto $125,000). We then put them in five age groups(less than 30, 30–39, 40–49, 50–59, and greaterthan or equal to 60), for a total of 25 groups.For each group, we determine the percentage ofparticipants who are invested in the default.
The results in Exhibit 2 clearly demonstrate thatincome is a much more important driver ofdefault acceptance than age. The average range indefault acceptance within an income groupis about 8 percentage points, while the averagerange across income groups is about 40percentage points. This suggests that a person’sincome has a much stronger relation than doesage when it comes to default acceptance. Whileit’s true that older participants tend to havelower default usage, it appears the predominantdriver of this effect is their higher levels ofcompensation, not simply because they are older.
These initial findings suggest that to trulyunderstand the drivers of the default acceptance,a more robust analysis is necessary. Therefore,a series of logistic regressions are performed. Forthose readers not familiar with a logistic regression,it is a statistical model used when the variablebeing explored is binary. For our study, thedependent variable for the logistic regressionsis a binary variable that is set to 1 if the participantis invested in the default; otherwise it’s zero. Theindependent variables are age, years ofparticipation in the plan, total deferral rate, salary,plan balance, and default type. For defaulttype, managed accounts and balanced funds areboth dummy variables and target-date usageis the omitted variable.
We perform two logistic regressions. The firstdoes not include any kind of weights, andthe second is weighted. A weighted regression isincluded to reduce the potential impact largerplans may have on the analysis, especially because certain plans may have unique aspectsor characteristics driving the default that we areunable to capture in the model. To be includedin the weighted regression, the plan must have atleast 30 participants, which eliminates 33 plansfrom the weighted logistic regressions. The resultsof the logistic regressions can be obtained bycontacting the authors. The coefficients are similarfor the two logistic regressions. The most notabledifference is that the coefficient for age is notstatistically significant for the weighted logisticregression. This suggests that default acceptancedoes not change based on age.
The negative coefficient for plan balance suggeststhat the probability of accepting the defaultdecreases as the balance increases. It is worthnoting that plan balance is also a proxy fora number of the variables included in the analysis.(It has the highest correlation with the othervariables included in the regression, although notto the point that multicollinearity would be anissue for the regressions.2) For example,participants with higher salaries are likely to havehigher balances, as are those who havehigher deferral rates and those who have beenparticipating in the plan longer.
The negative coefficients for deferral rate,salary, and plan balance each suggest thatparticipants who are more likely to accept thedefault would generally be described as lesssophisticated and are, therefore, the participantswhom we most want to see using the default.
These differences in demographics can haveimportant implications for a plan sponsor whenbuilding or selecting a default investment. Forexample, participants with lower incomes are morelikely to accept the default. Participants withlower incomes also typically have Social Securitybenefits replace a higher percentage of theirincome during retirement, which suggests theyhave an increased risk capacity with theirinvestments. Taken together, the demographicfindings suggest participants who are likelyto accept the default are not the “average”defined-contribution participant.
Default Acceptance by Type
We also note significantly different rates of defaultacceptance by default type. Default type wasactually the variable that had the greatest impacton the likelihood of default acceptance. Defaultacceptance among managed accounts is thehighest, followed by target-date funds and thenbalanced funds. Exhibit 3 provides insightinto the likelihood of default acceptance for themedian participant by age. We include thesevalues, versus the actual median values, to controlfor potential differences in plan demographics thatcould be driving differences in default usage.
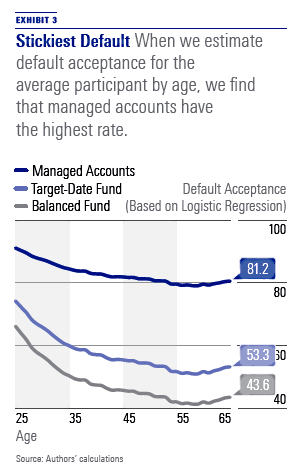
Among the three default investments, managedaccounts are the stickiest. While we don’t haveempirical evidence as to why this is the case,we found the level of stickiness to be consistentwith the personalization associated with eachdefault solution. Managed accounts offerthe highest level of personalization, and balancedfunds are the least personalized (everyone ownsthe same portfolio, regardless of age).
Broadening the Focus Historically, when evaluating plan defaultinvestments, plan sponsors focus onfees, performance, and to an extent, the"appropriateness" of the default investmentsolution's "fit" with plan participants.While we believe these criteria are important,we also believe it is important to considerthe likelihood that participants will continueto use the default investment solution.
We found that default acceptance wasmeaningfully influenced by the type of defaultoffered and participant demographics.Further, participants who are more likely to acceptthe default are not the “average” participant,which has important implications when designingand selecting a default investment for aplan. We also found that managed accounts arethe stickiest default option, followed by target-datefunds and then balanced funds. We speculatedthis was a result of the increased personalizationassociated with managed accounts.
As managed accounts continue to becomemore popular, both as opt-in and opt-outarrangements, it will be important to continueresearching this topic.
References Callan. 2018. "2018 Defined Contribution Trends."White Paper.
Choi, J.J., Laibson, D., Madrian, B.C., et al. 2002.“Defined Contribution Pensions: Plan Rules, ParticipantChoices, and the Path of Least Resistance.” Tax Policyand the Economy, Vol. 16, pp. 67–113.
Clark, J.W. & Young, J. A. 2018. “Automatic Enrollment:The Power of the Default.” White Paper.
Madrian, B.C. & Shea, D.F. 2001. “The Power ofSuggestion: Inertia in 401(k) Participation and SavingsBehavior.” The Quarterly Journal of Economics, Vol. 116,No. 4, pp. 1149–1187.
[1] Data from Morningstar Direct. Mutual fund assets are an incomplete metric of target-date fund assets given the growth incustom target-date solutions and collective investment trusts; therefore, these figures likely understate the growth in assets.
[2] The highest correlation is 0.57, between balance and salary, and the second highest is 0.53, between tenure and balance.
David Blanchett, Ph.D., CFA, CFP, is head of retirementresearch with Morningstar Investment Management. He isa member of the editorial board of Morningstar magazine.
Dan Bruns is vice president, product strategy, withMorningstar Investment Management.
This article originally appeared in the December/January 2019 issue of Morningstar magazine. To learn more about Morningstar magazine, please visit our corporate website.
The author or authors do not own shares in any securities mentioned in this article. Find out about Morningstar’s editorial policies.
/cloudfront-us-east-1.images.arcpublishing.com/morningstar/HDPMMDGUA5CUHI254MRUHYEFWU.png)
/cloudfront-us-east-1.images.arcpublishing.com/morningstar/OMVK3XQEVFDRHGPHSQPIBDENQE.jpg)