
Why Active Funds Have Outperformed in Theory But Fallen Short in Practice
Managers have shown skill over the last twenty years, but on the whole have failed to deliver value for investors.
/s3.amazonaws.com/arc-authors/morningstar/550ce300-3ec1-4055-a24a-ba3a0b7abbdf.png)
Summary
- Conventional wisdom holds that markets are zero-sum.
- However, over the trailing 20 years ended Sept. 30, 2018, the average dollar invested in U.S. stock funds outperformed its blended index and 80% of other funds before fees.
- This phenomenon was not exploitable, as investors couldn't purchase every fund and fees consumed all of the alpha the average dollar generated.
- In addition, the average dollar's outperformance margin narrowed through the years.
- This serves as a reminder that active managers can be skilled in aggregate yet still fail to deliver value. In some respects, the best way to beat the index is to act like the index.
Conventional Wisdom Conventional wisdom holds that markets are zero-sum: For every winning dollar before fees there must be a losing dollar. By this principle, investors effectively start at zero and, after paying expenses of various kinds, finish underwater. This, coupled with the practical reality that most active stock funds have failed to keep pace with their benchmarks, is how the case for indexing has tended to be made.
But what if the U.S. stock fund market were not zero-sum? More precisely, what if U.S. equity funds generated better returns than their benchmarks before fees? Is this conceivable? And if so, could investors hope to turn this to their advantage? In this piece we examine those questions.
Methodology We compiled the monthly gross returns, net returns, net assets, and Morningstar Category classifications for all U.S. stock funds (including dead funds) that were available for sale at some point during the 20-year period ended Sept. 30, 2018.
We used this data set to form a monthly asset-weighted average return for each category as well as an overall average for all U.S. stock funds. An asset-weighted average--which weights funds based on their net assets and category classification--approximates the return of the average dollar invested in funds. We calculated two versions of each category average: one before fees (that is, using monthly gross returns), the other after fees (that is, using monthly net returns), reconstituting each month.
We compared these averages against the relevant Morningstar Category indexes. For instance, we compared the large-value average versus the Russell 1000 Value Index, mid-blend versus the Russell Mid-Cap Index, small-growth versus the Russell 2000 Growth Index, and so on. For the overall average, we compared against a blended Russell index that mirrored the composition of all U.S. stock funds by net assets.
Not Zero We found that the average dollar invested in U.S. stock funds outperformed before fees.
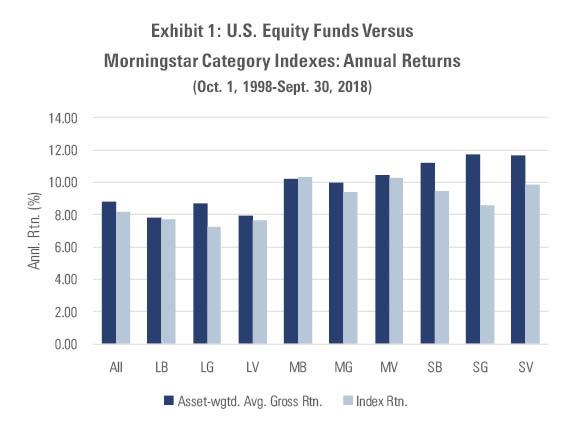
To illustrate, in Exhibit 1 we compare the average asset-weighted annual gross returns of each U.S. stock fund category to its corresponding index over the 20 years ended Sept. 30, 2018. All but one category topped its index, with the small-cap and large-growth categories outperforming by the largest margins.
- Source: Morningstar
(Note: We derived the asset-weighted average gross returns above using monthly gross returns and net assets, not daily figures. Given that this method doesn't capture intramonth changes in net assets, one should view the asset-weighted average gross returns as estimates, not precise measures, of how the average dollar performed over the 20-year period.)
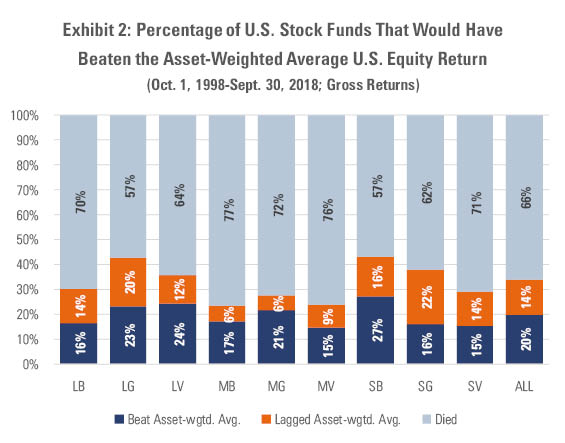
To put this performance in perspective, if an investor hypothetically invested in every U.S. stock fund on Oct. 1, 1998, and rebalanced each month thereafter (weighting each fund investment by its assets), her gross returns over the subsequent 20 years would have exceeded all but 20% of the U.S. equity funds that began the period.
- Source: Morningstar
The whole (the asset-weighted average) exceeded the sum of its parts (all U.S. stock funds), largely because the whole didn't die while two thirds of the parts did. There's an indirect lesson in this: The indexes can be hard to beat for the simple reason that they keep on ticking, compounding all the way.
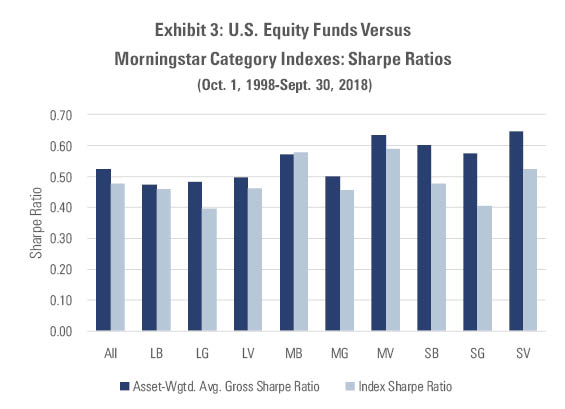
Given that these performance measures don't consider risk, it's worth conducting the same analysis using risk-adjusted returns. To that end, we compared each category's asset-weighted average pre-fee Sharpe ratio to that of its index. We found that the asset-weighted average would have trumped the index in nearly every category and overall, as shown in Exhibit 3.
- Source: Morningstar
Buttressing these results, we also found that the asset-weighted average would have generated a statistically significant 0.64% annual alpha before fees after controlling for market risk as well as size and value. (This was also true when we controlled for momentum and other factors, though the statistical significance varied.)
To the question of whether it's conceivable for U.S. equity funds to generate better returns than their benchmarks before fees, the answer appears to be yes: The average dollar invested in such funds outperformed over the 20-year period we examined, before and after accounting for risk.
(Note: Some will ask how it's possible for the sum of a market to be anything other than zero. The answer is that it comes down to how one defines "market." The U.S. equity mutual fund market and the U.S. stock market aren't the same thing; the latter is far larger than the former, with other participants including pensions, hedge funds, and individual investors who purchase stocks directly. That would explain how it's possible for some submarkets like mutual funds to outperform the index--which is a proxy for the broad stock market--while others like individuals underperform by an offsetting amount.)
Actually… The rub, of course, is that this advantage doesn't appear to be exploitable. After all, one can't easily invest across all funds, let alone avoid fees in doing so.
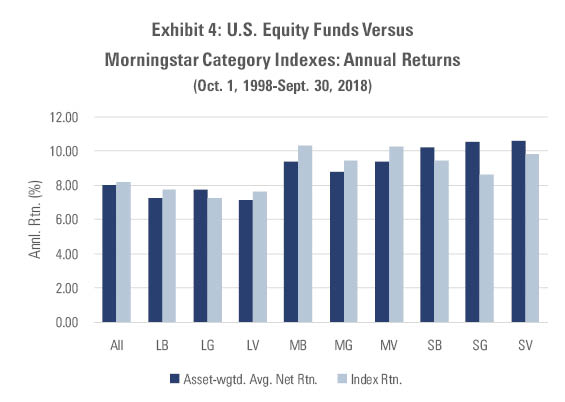
And those fees certainly take a bite. To illustrate, here's what the picture looks like when we compare U.S. stock funds' average asset-weighted net returns over the 20 years ended Sept. 30, 2018, with those of the costless indexes.
- Source: Morningstar
Fees snatched defeat from the jaws of victory, with six of the nine categories failing to keep up with the benchmark's returns after costs were figured in. Overall, the average dollar slightly underperformed the blended index, with 82 basis points of annual costs swamping the 0.61% of average annual pre-fee excess returns.
This same story held after risk, too: The asset-weighted average Sharpe ratios went from beating the index in nearly every category before fees to lagging in five of the nine categories and overall after fees.
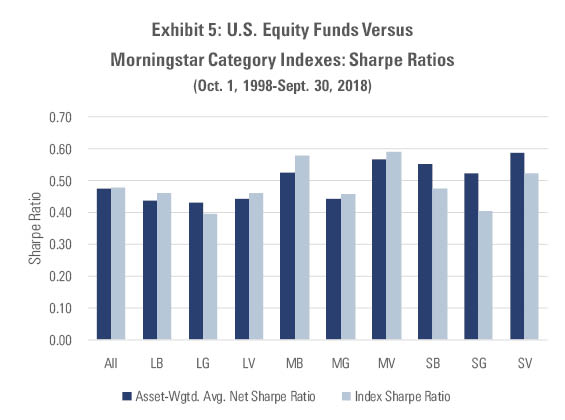
- Source: Morningstar
It's also important to consider the trend in excess returns and Sharpe ratios. Indeed, while the average dollar outperformed over the 20-year period we examined, it did so by a gradually shrinking margin, as shown in Exhibit 6.

- Source: Morningstar
This also held true for risk-adjusted returns, as evidenced by the narrowing differential between the asset-weighted average Sharpe ratio and that of the blended index.
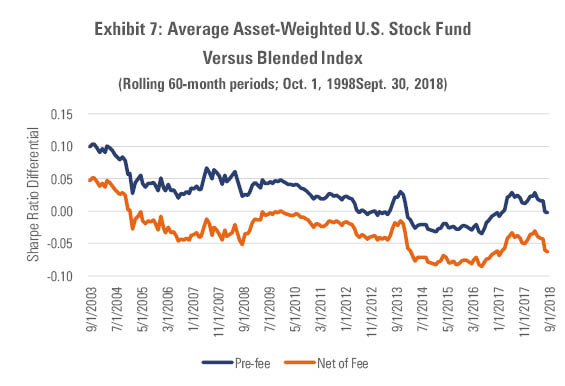
- Source: Morningstar
In short, it appears that the payoff on the average dollar in active funds has been grinding lower. Consequently, there has been less and less left over for investors once fees are deducted.
In sum, an investor could have turned the asset-weighted average's pre-fee outperformance to her advantage only if she was able to invest across thousands of funds in one fell swoop, rebalancing each month, and then somehow avoid fees. This isn't practically possible, and therein lies the paradox.
Lessons But that doesn't mean there aren't useful lessons to be gleaned from the average dollar's success (before fees) and failure (after costs).
For starters, it seems to underscore that, in aggregate, active stock fund managers possess skill. (It's difficult to definitively say why or how, but it seems plausible that this edge stems from trading with less-skilled investors who reside outside the mutual fund industry.) The problem is that this doesn't often translate at the individual fund level, where investors live, because funds die in droves and, when they don't, too often charge excessive fees. In that sense, active wins the battle but loses the war.
Then let's consider that the average dollar outperformed not because it picked a standout manager in October 1998 and rode it to glory, but because it owned all of the managers and never wavered. Unlike many funds in real life, it also stayed alive and kept fees low (more accurately, it incurred no fees, as we're referring to its pre-fee performance).
Widely diversified, doesn't budge, doesn't die, minimizes fees…does that sound like anything we know? If you said "the index," ding, ding, ding! You got it! In a sense, the average dollar's success before fees mirrors some of the very qualities that have made indexing tough to beat: It owns everything in the "market," it never loses its nerve or fades away, and it avoids costs.
It can seem contradictory to assert that active funds have outperformed in theory but fallen short in practice; that their success came in aggregate, and their failure at the individual fund level; and that the average dollar's alpha arose from factors--spreading out, never going away, avoiding fees--that seem to come straight out of the indexing playbook. But it reflects a reality that isn't nearly as binary as the eternal active-passive debate would lead one to believe.
Two things can be true at once. Investors can succeed with active, as they appear to have in aggregate before fees, and yet still fail to invest in winning active funds. And they can "fail" with passive, forgoing the theoretical excess returns they stand to reap with active in aggregate, only to leg ahead by sticking with it and pocketing the fee savings that indexing confers.
What matters most is that investors choose their "truth" thoughtfully, seeing their limitations in a clear-eyed way and managing what they can.
/cloudfront-us-east-1.images.arcpublishing.com/morningstar/ZKOY2ZAHLJVJJMCLXHIVFME56M.jpg)
/cloudfront-us-east-1.images.arcpublishing.com/morningstar/IGTBIPRO7NEEVJCDNBPNUYEKEY.png)
/cloudfront-us-east-1.images.arcpublishing.com/morningstar/HDPMMDGUA5CUHI254MRUHYEFWU.png)
:quality(80)/s3.amazonaws.com/arc-authors/morningstar/550ce300-3ec1-4055-a24a-ba3a0b7abbdf.png)