
2 Dividend ETFs That Highlight the Importance of Index Construction
Seemingly small differences in index methodology can drive outsize investment performance outcomes.
/s3.amazonaws.com/arc-authors/morningstar/64dafa24-41b3-4a5e-aade-5d471358063f.jpg)
From May 2006 through September 2018, VIG's annual return of 8.9 percentage points topped PFM's annualized returns by 1.9 percentage points, with similar risk. To contextualize this difference, an investment of $1,000 in VIG in May 2006 would have been worth $2,865 at the end of September 2018. Meanwhile, a $1,000 investment in PFM would have been worth $2,321.
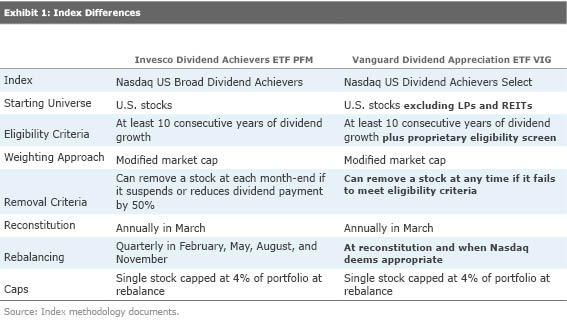
Both of these dividend-focused exchange-traded funds target U.S. stocks that have raised their dividend payments for at least 10 consecutive years and market-cap-weight those that pass muster. But there are some meaningful differences between their indexes' methodologies. The main ones being VIG's 1) proprietary eligibility screen, 2) exclusion of limited partnerships and REITs, and 3) discretion over stock removal and portfolio rebalancing.
Exhibit 1 provides a more detailed look at these differences:
I'm Different, Yeah I'm Different
Although these differences seem small, they have meaningfully impacted the relative performance of these funds. To quantify the differences in the two funds' portfolios, I examined the active share of VIG relative to PFM. Active share quantifies how much a fund's portfolio differs from a reference point--typically an index. For instance, if VIG has a 3% weighting in
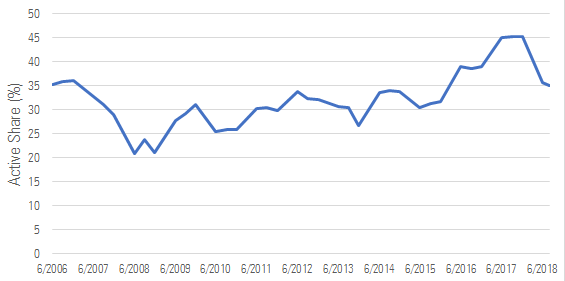
Exhibit 2 shows the active share of VIG relative to PFM on a quarterly basis from VIG's inception in April 2006 through August 2018.
Exhibit 2: Active Share Between VIG and PFM
Source: Quarterly active share from Morningstar Direct.
VIG's active share relative to PFM averaged 33% over this time frame with minimum and maximum values of 21% and 46%, respectively. Even though the differences between these funds' portfolios have--as measured by active share--been fairly small, they have yielded meaningfully different performance.
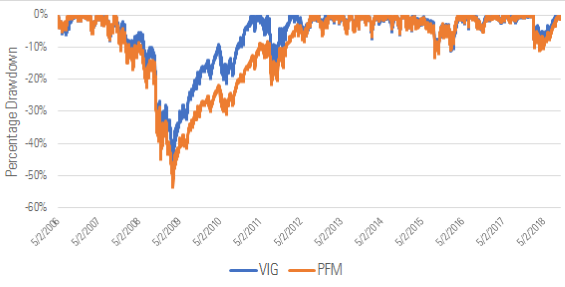
The main driver of the differences between these two funds is the proprietary eligibility screen that VIG applies after having screened its beginning universe for stocks with 10-plus consecutive years of dividend growth. Also, VIG's bogy can remove stocks between rebalance dates if they no longer pass this proprietary eligibility screen. This has helped the fund avoid the major sector drawdowns that have sideswiped PFM, which does not employ the same screen. PFM has to wait until the end of the month to kick out stocks that have cut their dividends. VIG's performance from October 2007 through March 2009 serves as evidence of the advantages lent by this proprietary screen. During this span, VIG benefited from being relatively underweight financials versus PFM. Exhibit 3 shows the cumulative drawdown of both funds from May 2006 through September 2018.
Exhibit 3: Max Drawdown of VIG and PFM
Sources: Morningstar Direct and analyst calculations.
From May 2006 through September 2018, VIG posted a maximum drawdown of 46.6% while PFM's maximum drawdown measured 53.3%. It's easier to recover from shallower drawdowns. Investors that held on through VIG's max drawdown in March 2009 were back to even by February 2011. Those that held PFM through its max drawdown didn't recover until August 2012.
Dig Into Index Differences
The main benefit of VIG's proprietary screen isn't that it only picks high-quality dividend payers, but that it avoids stocks that meaningfully detract from performance. For example, a regression of the funds' return data shows that each carries a statistically significant exposure to quality. But VIG does not have a statistically significant value factor exposure while PFM does. VIG's ability to avoid the riskiest
stocks has contributed to its outperformance.
Seemingly small differences in index methodologies can drive large differences in long-run performance. Digging into the details of index construction and understanding the potential costs and benefits of different methodologies can help differentiate among index funds that are great, good, just OK, or not worthy of your investment. In this case, we think that VIG is a great fund. It earns a Morningstar Analyst Rating of Gold for its sound investment process, low fee, and broad diversification.
Disclosure: Morningstar, Inc. licenses indexes to financial institutions as the tracking indexes for investable products, such as exchange-traded funds, sponsored by the financial institution. The license fee for such use is paid by the sponsoring financial institution based mainly on the total assets of the investable product. Please click
for a list of investable products that track or have tracked a Morningstar index. Neither Morningstar, Inc. nor its investment management division markets,
or makes any representations regarding the advisability of investing in any investable product that tracks a Morningstar index.
/d10o6nnig0wrdw.cloudfront.net/04-18-2024/t_34ccafe52c7c46979f1073e515ef92d4_name_file_960x540_1600_v4_.jpg)
/d10o6nnig0wrdw.cloudfront.net/04-09-2024/t_e87d9a06e6904d6f97765a0784117913_name_file_960x540_1600_v4_.jpg)
/cloudfront-us-east-1.images.arcpublishing.com/morningstar/T2LGZCEHBZBJJPPKHO7Y4EEKSM.png)
:quality(80)/s3.amazonaws.com/arc-authors/morningstar/64dafa24-41b3-4a5e-aade-5d471358063f.jpg)