
What If? The Liquid Alternatives Edition
We address some questions about our recent study on liquid alternatives’ performance.
/s3.amazonaws.com/arc-authors/morningstar/af89071a-fa91-434d-a760-d1277f0432b6.jpg)
/s3.amazonaws.com/arc-authors/morningstar/fadee740-dfeb-494d-95b1-c462d0ac1f59.jpg)
In August, we published a study looking at how liquid alternative funds have performed using a methodology that considers not only returns, but also the diversification benefits these funds have offered, as captured by their correlations to other asset classes. The goal of the study was to encourage investors to think about liquid alternative funds' performance within the context of a broader portfolio. This means looking past absolute returns and considering how those return streams fit into a broader portfolio.
When we applied this performance metric to existing liquid alternatives funds, we found that most weren't offering much benefit to a generic 60/40 portfolio of stocks and bonds. The findings generated questions from investors, fund companies, and even colleagues at Morningstar. Most of these questions revolved around two topics: The sensitivity of the results to the time period and fees. To address these questions, let's take a page from Marvel Comics and tackle two What If? alternate reality (pun intended) scenarios.
What If...the Past Five Years Weren't a Bull Market? The most common questions concerned the five-year period we used to run our analysis. Those five years, from 2013 through the end of 2017, were great for stocks and, until recently, pretty good for bonds as well. If we ran the same exercise over different market environments, would our results meaningfully change?
We wish we had more data to run, too! But less than half the liquid alternative funds that existed at the end of 2017 didn’t have five-year track records. Of the 415 funds available then, only 134 had five-year track records, 101 had seven-year track records, and only 53 had 10-year track records.
To address this, we went back to the pre-financial-crisis stock market peak in October 2007. At the time, there were 65 liquid alternative funds (for comparison, there are more than 400 today). We subjected those funds to same performance test we used in the original study. Our time frame spanned from the October 2007 peak through March 2012. These dates bookend a full peak-to-previous-peak market cycle.
Of the 65 funds we examined, 16 died before the end of the period. The results of the survivors are shown in Exhibit 1.
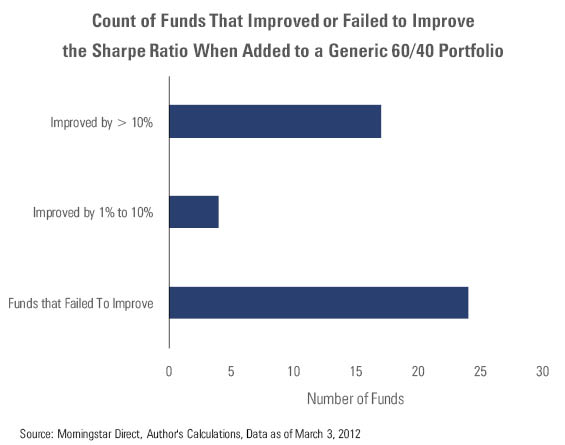
The odds of selecting a liquid alternative fund that would have improved a generic 60/40 portfolio’s risk-adjusted returns were much better over this span than they were for the five-year period we looked at in the original study. Over this period, 17 of the 45 (or 37%) liquid alternative funds that survived the period would have improved the generic portfolio’s Sharpe ratio by more than 10%. By comparison, only eight of the 134 (or 6%) funds in our five-year study would have done that. Still, the fact remains that when the markets turned sour, less than half of liquid alternative funds that survived the period delivered on their promise of providing diversification.
What If...Liquid Alternatives Were Free? We were also asked whether these funds' high fees negatively affected their ability to serve as worthwhile diversifiers. To test the impact of fees on our original result, we ran the study using both gross returns, which do not include a fund's operating expenses like management fees, and net-of-fees returns and compared the two over the five-year period ended June 30 (we moved forward to make the results more timely). The gross returns use Morningstar's prior methodology for calculating expense ratios (for details, read this).
Exhibit 2 shows the results for all liquid alternative funds that survived the full period, and Exhibit 3 shows the results by Morningstar Category. The sample size at the beginning of the period was 430, and 250 of those funds survived the entire period. As we’ve pointed out before, death has been a quite common occurrence in liquid alternatives, but this death rate is somewhat shocking. For the net-of-fees returns we used the institutional shares, which tend to have the most assets and are the cheapest available. Note the bar charts have been scaled to 100%, so it’s easier to see the change before and after fees for the universe and by category.
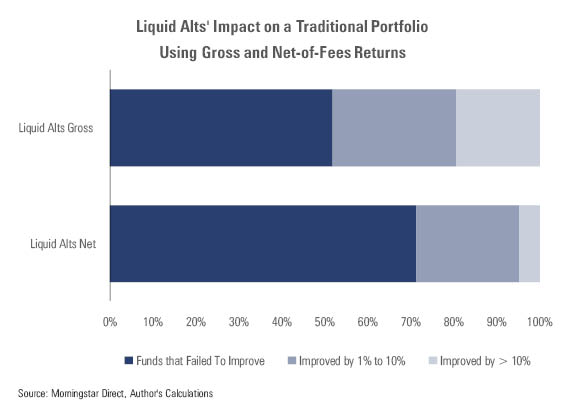
At the broadest level, half of liquid alternatives could have pulled a Fidelity five years ago and wiped out their operating costs and still not delivered an improvement at the portfolio level. As is the case with our original analysis, results might look slightly better over a full market cycle, but given our analysis of alternatives’ crisis-period achievement, it is hard to expect a huge improvement here. As for the other half of funds that did offer improvement before fees, clearly there is room for those fees to come down to improve their chances of delivering for investors.
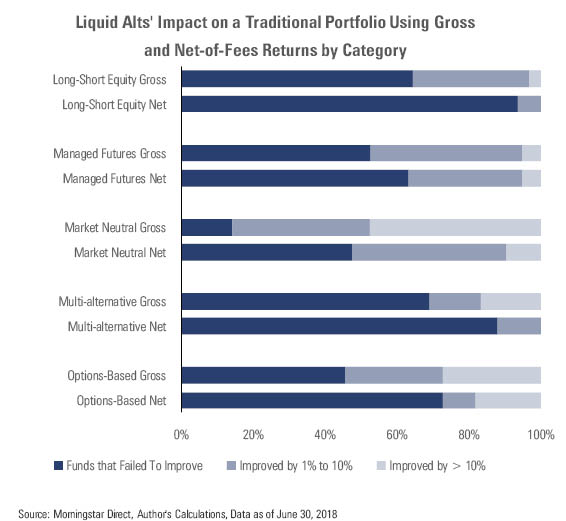
Liquid alternatives funds within almost every category appear to have a chance to improve investor outcomes by means of reducing their take. Managed futures is the only category that didn’t see much of a change in success rates when toggling between gross and net returns. This is somewhat ironic, given that the category has the highest average fee of any alternatives category; the median institutionally distributed fund charges 1.64%. That said, the result isn’t entirely surprising considering that these funds tend to have no correlation to broader markets like equities, making them excellent diversifiers. When correlations to traditional markets are near zero over a long period, the funds need only to generate a positive risk-adjusted return to add value.
What If...I Still Want to Diversify My Portfolio? The last question returns us to our reality. Do our findings mean investors should abandon all hope when looking at liquid alternatives? No! We still think there are some solid funds in the group, but--as always--it behooves investors to be choosy. As of the end of August 2018, there were 36 Morningstar Medalists scattered across a variety of categories. A Positive (Gold, Silver, or Bronze) Morningstar Analyst Rating indicates we have conviction in a fund's ability to outpace peers on a risk-adjusted basis over a full market cycle. To improve the odds of getting a better outcome at the overall portfolio level, investors should focus on strategies that aren't expected to have a high correlation to a traditional portfolio, which is most likely going to have its direction driven by equities. Like market-neutral funds, managed-futures, and a handful of multi-alternative, options-based, and long-short credit funds have behaved within those expectations over time. The Morningstar Style Box for Alternatives, which is available to Morningstar Direct users and will be available on Morningstar.com this year, is one tool investors can use to see a fund's diversification benefit and how it has changed over time.
Associate analyst Stefan Sayre contributed to this article.
/cloudfront-us-east-1.images.arcpublishing.com/morningstar/ZKOY2ZAHLJVJJMCLXHIVFME56M.jpg)
/cloudfront-us-east-1.images.arcpublishing.com/morningstar/IGTBIPRO7NEEVJCDNBPNUYEKEY.png)
/cloudfront-us-east-1.images.arcpublishing.com/morningstar/HDPMMDGUA5CUHI254MRUHYEFWU.png)
:quality(80)/s3.amazonaws.com/arc-authors/morningstar/af89071a-fa91-434d-a760-d1277f0432b6.jpg)
:quality(80)/s3.amazonaws.com/arc-authors/morningstar/fadee740-dfeb-494d-95b1-c462d0ac1f59.jpg)