
Are Falling Fund Fees Too Much of a Good Thing?
Our research finds that fees are likely to remain as reliable a guide to future performance as any.
/s3.amazonaws.com/arc-authors/morningstar/550ce300-3ec1-4055-a24a-ba3a0b7abbdf.png)
Key Takeaways
- Fund fees continue to decline, a big win for investors.
- The question is whether narrowing fee differences between funds will make fees less predictive of future performance than before.
- We examined the rolling returns and fees of all U.S. equity funds over the period September 1998-August 2018.
- We found that funds are performing more alike and fee differences are narrowing.
- However, we find no evidence that fees are having less of an impact on performance as they decline; to the contrary, they appear to be more significant to performance than before.
- This argues for continuing to weigh fees heavily when assessing funds.
Good News: Fund Fees are Falling! Whether by anecdote or data, it's clear that fund fees are falling. For instance, Fidelity recently made headlines by launching index funds that are free to investors (now a quartet; the firm has since launched two more "zero" funds). More broadly, our research has found that fund expenses are trending lower.
This is great. Fund fees reduce returns basis point for basis point, ensuring that investors literally don't get what they pay for. And that simple principle likely explains why fees, of all the variables we've tested in the past, have tended to do the best job of predicting future performance. That is, all things being equal (or at least similar), the cheapest funds are likeliest to succeed, the priciest the likeliest to fail, and so forth.
Too Much of a Good Thing? But here's a question: Could falling fees turn out to be too much of a good thing? Is it possible that as fees converge toward zero they'll lose some of their predictive power in the process? After all, if it's fee differences that have created the narrow spaces separating funds' net-of-fee returns, isn't it possible that falling fees will shrink those gaps and, in so doing, dull fees' power in predicting future performance differences?
To address those questions, we compiled the rolling 60-month net and gross returns of all U.S. stock funds from Sept. 1, 1998 through Aug. 31, 2018, including dead funds. We also tallied the annual fees those funds deducted over the rolling periods, which we derived by deducting each fund’s net returns from its gross returns, the difference approximating annual fund costs. We analyzed more than 16,500 funds in this fashion.
Using that data, we sought to capture the historical trend in a few measures:
- The return difference between the best-performing funds and 1) average-performing funds and 2) the worst-performing funds.
- The cost difference between the cheapest funds and 1) average-cost funds and 2) the priciest funds.
- The cost difference between the best-performing funds and 1) average-performing funds and 2) the worst-performing funds.
- The portion of the performance advantage attributable to fees.
This would yield a sense of how wide or narrow the performance differences between funds have been over time and how much of that performance differential has been explained by cost differences. Using that information, we can then compare recent performance and cost differences to the past and determine whether falling fund fees and narrowing fee differences could sap fees’ predictive power going forward.
Performance Trends In examining the return data, we found a pretty dramatic narrowing of the performance gaps between funds. Whereas it wasn't uncommon to find double-digit annual returns differences between the best and worst (or even mediocre) funds in the five-year periods ended in the early 2000s, returns are much more clustered now.
To illustrate, the chart below compares the average annual return differences between top- and third-quintile U.S. stock funds.
Exhibit 1: Average Annual Return Differences Between Top-Quintile and Third-Quintile U.S. Stock Funds, by Category (Rolling 60-Month Periods 9/1/98-8/31/18)
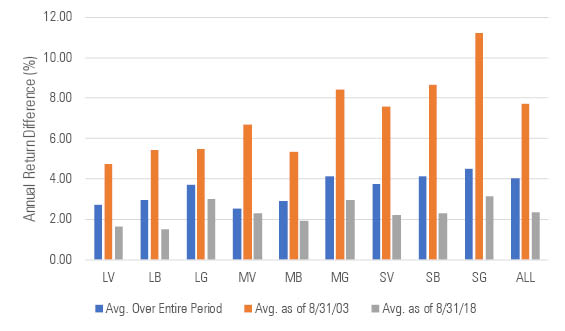
Source: Morningstar Direct
As of Aug. 31, 2018, the average top-quintile fund had bested the average third-quintile (that is, mediocre) fund by around 2.4% per year. That’s a shadow of the difference that separated the average top- and third-quintile fund as of Aug. 31, 2003 (7.7% annualized) and is well below the average annual difference for the entire 20-year period we examined (4.0%). It’s even more dramatic when we compare the average top-quintile fund to the average bottom-quintile (that is, worst) fund, as shown below.
Exhibit 2: Average Annual Return Differences Between Top-Quintile and Bottom-Quintile U.S. Stock Funds, by Category (Rolling 60-Month Periods 9/1/98-8/31/18)
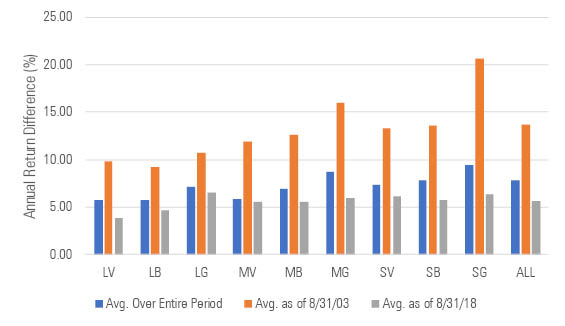
Source: Morningstar Direct
As one would expect, the gaps are wider when comparing the top and bottom quintiles. But the most recent gap for the five years ended Aug. 31, 2018--5.6% per year--is less than half that of Aug. 31, 2003 (13.7% per year) and meaningfully below the average for the full two-decade period (7.9% annualized).
In summary, funds are performing more alike.
Fee Trends As expected, we found that fees have fallen through the years. However, the gap between the cheapest and priciest isn't dramatically narrower. To illustrate, the chart below compares the average annual fee levied by funds in the cheapest quintile of U.S. stock funds and those levied by funds in the third-cheapest quintile.
Exhibit 3: Average Annual Fee Differences Between Cheapest and Third-Cheapest Quintile U.S. Stock Funds, by Category (Rolling 60-Month Periods 9/1/98-8/31/18)
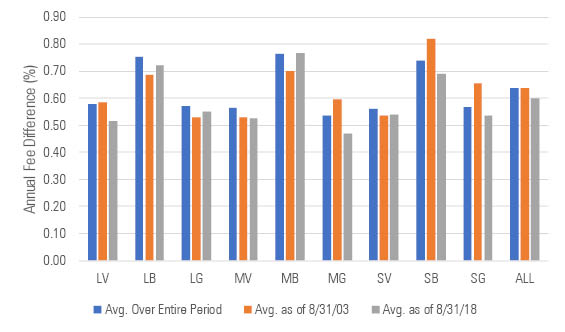
Source: Morningstar Direct
In the five years ended Aug. 31, 2018, the average fund in the cheapest quintile levied around 0.60% less in annual expenses than the average fund in the third-cheapest quintile. That’s less than the 0.64% in annual expenses that separated the average fund in the cheapest quintile from the average fund in the third-cheapest quintile during the five years ended Aug. 31, 2003, and a tad lower than the average fee difference for all rolling 60-month periods during this 20-year span (also 0.64% annually).
What about the cheapest versus the most expensive? The chart below compares the cheapest quintile to the priciest quintile.
Exhibit 4: Average Annual Fee Differences Between Cheapest- and Priciest-Quintile U.S. Stock Funds, by Category (Rolling 60-Month Periods 9/1/98-8/31/18)
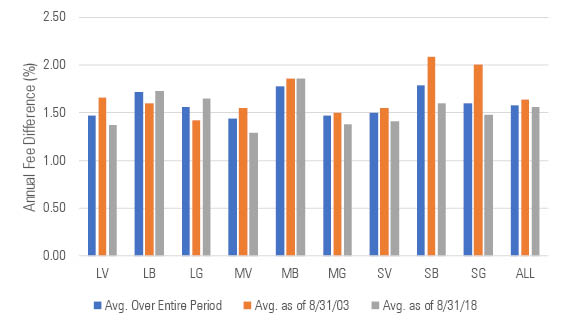
Source: Morningstar Direct
In the 60 months ended Aug. 31, 2018, the average fund in the lowest-cost quintile charged about 1.56% less annually than the average fund in the highest-cost quintile. Again, that’s a smaller fee difference than we saw in the five years ended Aug. 31, 2003 (1.63%) and across the full two-decade period (1.58%), but not dramatically so.
How is it possible that fee differences didn’t compress more given that fees have been falling in general? The short answer is that the average fee in every cost-quintile drifted lower over this 20-year period, as shown in the chart below.
Exhibit 5: Average Annual Cost of U.S. Stock Funds by Cost Quintile (Rolling 60-Month Periods; 9/1/98-8/31/18)
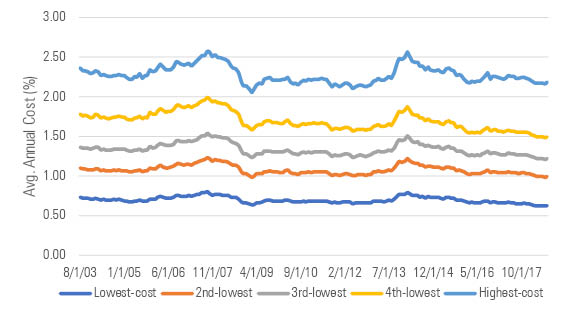
Source: Morningstar Direct
Performance and Fee Trends We've examined trends in return differences between funds (much narrower now than in the past) and fee differences between funds (slightly narrower), but what about the two taken together?
To examine this, we calculated the average fee charged by funds in the five return quintiles over time, and then compared the differences in their fees to the differences in their returns. In this way, we could estimate how much of the best-performing funds’ return advantage stemmed from fee differences and how that has trended over time.
As shown in the chart below, fees haven’t become less important to outperformance over time. To the contrary, they’ve become more vital!
Exhibit 6: Average Percentage of Performance Advantage Attributable to Fee Differences (Rolling 60-Month Periods 9/1/98-8/31/18)
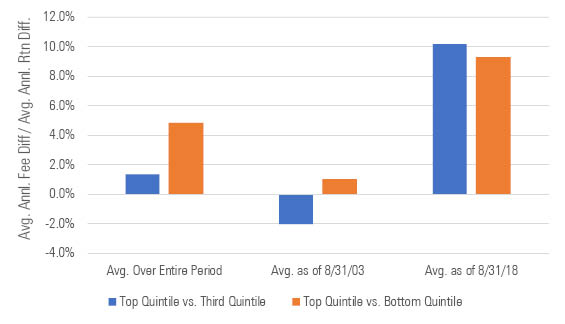
Source: Morningstar Direct
In the five-year period ended Aug. 31, 2018, the average fund in the top-performing quintile cost around 0.24% per year less than the average fund in the third-highest quintile by performance. Over that five-year period, the average fund in the top-performing quintile outperformed the average fund in the third quintile by about 2.40% annually. Thus, the fee difference accounted for around 10% of the overall return advantage.
That might not seem like much but it’s far larger than before. For instance, in the five years ended Aug. 31, 2003, the average fund in the top-performing quintile cost slightly more than that in the third-highest-performing quintile, meaning that fees didn’t explain the performance advantage. Over all rolling 60-month periods that make up the 20-year span we found that the average fee advantage between the top- and third- highest-performing quintiles was around 1% of the return advantage.
The same trend held when we compared the top-performing quintile of funds with the lowest-performing quintile: Fees have come to account for a bigger chunk of the performance advantage than before.
What this suggests is that fees have become many times more important to performance differences than before. And why? As performance gaps have narrowed, fee differences have been magnified, driving performance advantages to a greater degree than before.
This argues for continuing to factor fees heavily into fund assessments. They’ve been reliable in the past and, significantly as they appear to figure into performance differences today, are likely to remain useful going forward.
Conclusion Fund fees continue to decline and as they converge toward zero that might raise questions about whether fee differences will be as reliably predictive of future performance as they've been in the past. However, while fee differences do indeed appear to have narrowed slightly, funds are performing more alike, which translates to smaller performance gaps. Consequently, fee differences appear to account for an even greater share of performance differences than before, suggesting that investors are well advised to continue to factor cost heavily into their fund assessments.
/cloudfront-us-east-1.images.arcpublishing.com/morningstar/HDPMMDGUA5CUHI254MRUHYEFWU.png)
/cloudfront-us-east-1.images.arcpublishing.com/morningstar/OMVK3XQEVFDRHGPHSQPIBDENQE.jpg)
:quality(80)/s3.amazonaws.com/arc-authors/morningstar/550ce300-3ec1-4055-a24a-ba3a0b7abbdf.png)