
Some Bonds Are Better Diversifiers Than Others
Bonds' diversification potential occupies a spectrum from great to lousy.
/s3.amazonaws.com/arc-authors/morningstar/a90ba90e-1da2-48a4-98bf-a476620dbff0.jpg)
In the context of portfolio construction, the best thing about bonds is that they are not stocks. Their cash flows are generally far more certain, their lives finite, their terms transparent, and their rank in the pecking order of companies' capital structures higher than common equity. All these attributes lend themselves to bonds being less than perfectly correlated with stocks, making them good diversifiers of equity risk. But not all bonds are created equal. Their diversification potential occupies a spectrum from great to lousy. The best diversifiers are the most boring.
As stocks continue to chug along and interest rates have lifted off from their recent lows and could climb higher still, now is a good time to revisit bonds’ role in a diversified portfolio. Here I will look at the degrees of diversification potential offered by various segments of the bond market. Then I will share a peek at recent trends in exchange-traded fund flows among the largest categories of fixed-income ETFs to assess how investors are positioning themselves to cope with the confluence of full stock-market valuations and the possibility of further interest-rate increases.
The Spectrum of Fixed-Income Securities' Diversification Potential While bonds share many common features, they are not created equal. Bondholders are lenders, and as such, bonds' characteristics will vary depending chiefly on the borrower and the length of the loan in question. If your dependable twin sister/next-door neighbor--let's call her Trish Bills--asked you to spot her a bit of money for a brief period, you probably wouldn't hesitate and might not even charge her interest (she's blood after all). But if you lent money to an out-of-state college buddy with a bad luck streak--let's call him Hugh Yeeld--you would likely limit the amount you were willing to let him borrow, ask that he return that money sooner rather than later, and require a higher interest rate--all as means of limiting and compensating for the level of risk you would be assuming. Of course, what I'm describing here are the two risk factors that are the primary drivers of returns of fixed-income securities: credit and duration risk. These same factors also drive the varying degrees of diversification potential across fixed-income sectors.
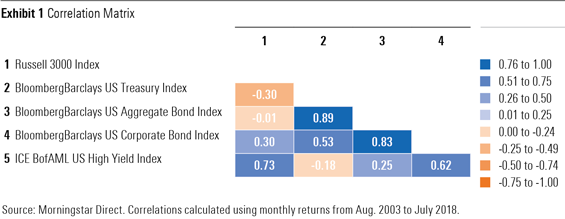
Exhibit 1 shows the correlations between U.S. stocks (as represented by the Russell 3000 Index) and various bond benchmarks over the 15-year period through July 2018. It is immediately apparent that some types of bonds are better diversifiers of equity risk than others. For example, U.S. Treasuries had a negative 0.30 correlation with stocks over this period, indicating that they tended to zig when stocks zagged. Thus, lending to the U.S. government has proved to be a good way for investors to balance equity risk in their portfolios. On the other end of the spectrum, high-yield bonds had a high and positive correlation (0.73) to U.S. stocks over this span. Lending to less-creditworthy borrowers (like your old buddy Hugh) is risky business. Credit risk correlates positively with equity risk. So investing in more credit-risky segments of the bond market like high-yield bonds and corporate credit won’t provide the same diversification benefits as investing in safer bets like Treasuries.
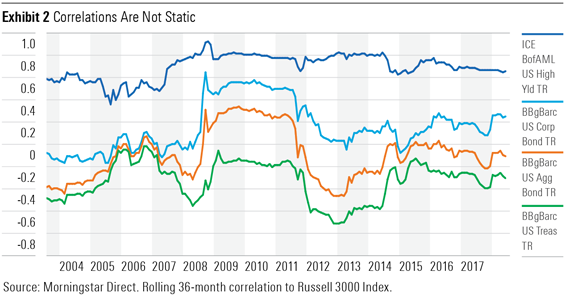
Variation in Correlation Its important to note that Exhibit 1 reflects a snapshot in time. Correlations between different corners of the global market will vary over time. Exhibit 2 shows the rolling 36-month correlations for the same bond benchmarks featured in Exhibit 1 versus the Russell 3000 Index over the trailing 15 years through July 2018. While the rank order of diversification potential for these indexes remains intact, it's clear there is a good degree of variation in correlations over time. For example, the rolling 36-month correlation between the Russell 3000 Index and the Bloomberg Barclays U.S. Treasury Index ranged from negative 0.03 to negative 0.72 over this period. The same figure for the ICE BofAML U.S. High Yield Index went as low as 0.35 and as high as 0.92. In my opinion, the most important takeaway from this exhibit is that correlations between bonds and stocks tend to jump in tumultuous times. This is most evident in the spike seen around the time Lehman Brothers went bust in September 2008. When markets crash, correlations converge.
Buy the Dip It's important to understand correlations between segments of the market and how they vary over time, but they don't tell the full story. Yes, bonds are ballast for your portfolio. But they can also serve as a source of dry powder for use in implementing a simple portfolio rebalance or ratcheting up your equity risk during stock-market drawdowns.
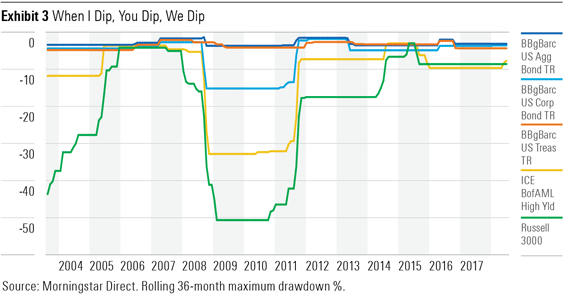
Exhibit 3 shows the rolling 36-month maximum drawdowns for the Russell 3000 Index as well as the bond benchmarks featured in Exhibits 1 and 2. The exhibit is intended to show that when stocks drop, some bond types will keep your powder drier than others. The starkest example, which should be little surprise, came during the depths of the financial crisis. The Russell 3000 Index experienced a maximum drawdown of 51.2% during the period. During the same time frame, the ICE BofAML U.S. High Yield Index had a 33.2% drawdown. The drawdown for the Bloomberg Barclays U.S. Treasury Index was a relatively muted 4.3%. So, while correlations spiked as investors feared the worst, some segments of the market felt the sting more acutely than others. The most important lesson in all of this is that bonds’ usefulness as ballast and a source of dry powder is positively correlated to their credit quality and negatively correlated to their duration.
What Do the Flows Show?
How are investors adjusting their fixed-income exposures in light of today’s stock-market valuations and the potential for further increases in interest rates? Exhibit 4 plots trailing 12-month flows into ETFs across the five largest fixed-income Morningstar Categories as measured by their combined assets under management as of the end of July. Overall, I would say that the signs here are encouraging.
First, it is clear that investors have been shying away from taking too much interest-rate risk. This is evidenced by steady inflows into short-term bond ETFs and the surge of new money heading into ETFs in the ultrashort-bond category. Over the 12 months through July, investors poured $37 billion into ETFs in these two categories. Among these funds,
Investors’ recent aversion to credit risk is apparent in the direction of ETF flows in the corporate-bond and high-yield categories. Corporate-bond ETFs took in $25 billion of new money during the trailing 12 months through December 2017. Over the 12 months through July, the pace of inflows had slowed to $6 billion. The pattern is even more pronounced in the case of high-yield ETFs. Trailing 12-month inflows into high-yield ETFs recently peaked at $11 billion in October 2017. Since then, the tide has turned. Over the year through July, these funds witnessed $2 billion in outflows.
Meanwhile, ETFs in the intermediate-bond category have continued to see sizable inflows, amounting to $18 billion over the year through July. This group includes a pair of Silver-rated stalwarts,
All told, the trends in fixed-income ETF flows are heartening. Investors appear to be dialing down both interest-rate and credit risk. New money has been headed to those segments of the bond market that provide the best ballast and could prove a good source of dry powder if stocks stumble.
Disclosure: Morningstar, Inc. licenses indexes to financial institutions as the tracking indexes for investable products, such as exchange-traded funds, sponsored by the financial institution. The license fee for such use is paid by the sponsoring financial institution based mainly on the total assets of the investable product. Please click here for a list of investable products that track or have tracked a Morningstar index. Neither Morningstar, Inc. nor its investment management division markets, sells, or makes any representations regarding the advisability of investing in any investable product that tracks a Morningstar index.
/d10o6nnig0wrdw.cloudfront.net/09-25-2023/t_f3a19a3382db4855b642d8e3207aba10_name_file_960x540_1600_v4_.jpg)
/d10o6nnig0wrdw.cloudfront.net/04-09-2024/t_e87d9a06e6904d6f97765a0784117913_name_file_960x540_1600_v4_.jpg)
/cloudfront-us-east-1.images.arcpublishing.com/morningstar/T2LGZCEHBZBJJPPKHO7Y4EEKSM.png)
:quality(80)/s3.amazonaws.com/arc-authors/morningstar/a90ba90e-1da2-48a4-98bf-a476620dbff0.jpg)