
Is the Flattening Yield Curve a Cause for Concern?
Though it may not be signaling that a recession is imminent, the Fed should proceed with caution.
/s3.amazonaws.com/arc-authors/morningstar/3a6abec7-a233-42a7-bcb0-b2efd54d751d.jpg)
The yield curve started 2018 sort of flat. And, as you can see from the chart below, short-term yields have risen from where they started the year, but long-term yields continue to be sluggish.
Should we be concerned about this?
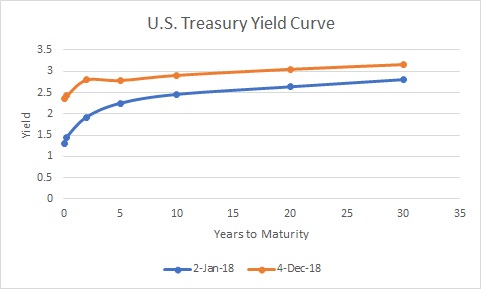
- source: Treasury.gov
In a "normal" yield curve, short-term yields are lower than long-term yields, because you would expect to be compensated for taking on more risk in the form of longer bond maturity.
When the yield curve flattens, the spread between shorter-term bonds and bonds of longer maturities shrinks. This is often measured as the spread or difference between the yield on the 10-year Treasury and the 2-year Treasury. At the start of 2018, the spread was 0.54, and as of Dec. 4 it was 0.11.
A Closer Look at What's Going On It's not so difficult to understand what's going on at the short end of the curve: This is the part over which the Fed exercises more direct control. We started the year with the fed funds rate at a range of 1.25%-1.50%. The Federal Reserve has raised rates three times so far in 2018--in March (to a range of 1.50%-1.75%); in June (to 1.75%-2.00%); and in September (to 2.00%-2.25%).
What's going on at the long end of the yield curve gets complicated, though. This is the part of the curve that is more influenced by investors' expectations, including market sentiment and inflation expectations. As for the market, the S&P 500 is dipping into negative territory for the year, and it's been a bumpy ride with three months in the red.
And inflation expectations have held pretty flat, from around 2% at the start of the year to 1.96% on Dec. 3, according to the break-even inflation rate, which compares the yield on nominal Treasuries to the yield on Treasury Inflation-Protected Securities of a similar maturity to estimate the market's inflation expectations.
Also, importantly, even though the yields on Treasuries might look measly to a U.S. investor, low interest rates on global developed debt is helping to anchor the long end of the curve.
A Flattening Curve Is Hard to Read Many market-watchers interpret the flattening yield curve as a signal that winter is coming for this bull market. In actuality, though, it's closer to the truth to say that a flattening yield curve indicates that many investors believe we're headed toward recession.
But, maybe the net result of those statements is the same anyway. A flatter yield curve can hurt lenders' profits and stability and their willingness to lend. If long-term and short-term rates are close, markets must be expecting little growth or lenders would demand a bigger time premium. This, in turn, (theoretically) slows down the business cycle.
Yield curves sometimes flatten on the way to inversions, which tend to precede recessions. The graphic below from the St. Louis Fed shows the spread between the 10-year and 2-year Treasuries--the peaks are periods when the yield curve was steepest, while the dips below the zero line indicate that the yield curve was inverted. The shaded vertical lines represent recessions. (To see a larger version of the image below, click here.)
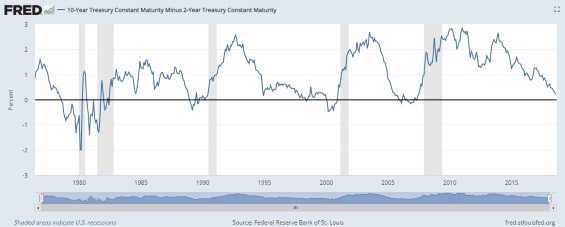
- source: St. Louis Fed
But as you can see from the chart, the yield curve can flatten for years without tipping into inversion. Further, comparisons to past cycles may not be all that relevant: The current environment is unique in the wake of the historic zero interest-rate policy.
The Fed Should Proceed with Caution In a speech on Nov. 28, Fed chairman Jerome Powell outlined the Fed's new approach to monitoring financial stability. Quoting the line "eternal vigilance is the price of financial stability," he explained that the first part of the new approach will focus on building up the strength and resilience of the financial system through stress tests and minimum requirements for high-quality liquid assets.
The second part will consist of monitoring for vulnerabilities and risks that would trigger financial distress in the "complex and rapidly evolving" U.S. financial system.
The third part, Powell said, is to "explain the new approach as transparently as possible." This is in keeping with current Fed's modus operandi of widely telegraphing its moves and not surprising the market. Surprises are best avoided, as evidenced by 2013's surge in U.S. Treasury yields in response to then-Fed chairman Ben Bernanke's statement that the Fed would begin tapering the pace of its bond purchases later that year, conditional on continuing good economic news.
What will this mean in terms of monetary policy? The Fed "dot plots," seen here on Page 3, show the expectations that each member of the FMOC has for the target fed funds rate through the end of the year and over the next several years. It can give a sense of how many rate hikes might be in the offing. In the most recent release (Sept. 26), the dot plots show the median member anticipating one more quarter-point rate increase in 2018 and three more in 2019, which would bring us slightly above the Fed's long-term 3% target.
The Fed is in a precarious position. Even if the flattening yield curve on its own doesn't herald imminent danger, it's an indication that uncertainty abounds. On the one hand, the central bank has indicated that it's proceeding with its plan toward gradual rate normalization. But the Fed chairman's comments underscore that it's also keeping a sharply focused eye out for anything that could throw the financial system off balance.
/cloudfront-us-east-1.images.arcpublishing.com/morningstar/G3DCA6SF2FAR5PKHPEXOIB6CWQ.jpg)
/cloudfront-us-east-1.images.arcpublishing.com/morningstar/6ZMXY4RCRNEADPDWYQVTTWALWM.jpg)
:quality(80)/s3.amazonaws.com/arc-authors/morningstar/3a6abec7-a233-42a7-bcb0-b2efd54d751d.jpg)