
How Can Investors Improve Their Chances of Picking Winning Fund Managers?
Taking the outside view can help investors better measure their odds of investing with the best.
/s3.amazonaws.com/arc-authors/morningstar/a90ba90e-1da2-48a4-98bf-a476620dbff0.jpg)
In his book “Thinking, Fast and Slow,” [1] Nobel Prize winning psychologist Daniel Kahneman discusses how he stumbled upon two different approaches to forecasting while working for Israel’s Ministry of Education to write a high school textbook about judgment and decision-making. Kahneman and his longtime collaborator, Amos Tversky, ultimately branded these two schools of forecasting “the inside view” and “the outside view.” The inside view is deeply personal. In constructing a forecast based on the inside view, we focus very narrowly on our own unique experiences and situation and extrapolate from there. (For example, I’m an above-average driver with a squeaky-clean driving history about to go on a short trip in fair weather. The odds of me getting in a fender bender are almost nil.) On the other hand, a forecast based on the outside view starts with a survey of the broader population and is refined based on any specifics regarding the circumstances. (Start with the odds of any driver getting in a fender bender regardless of driving history, the distance traveled, or weather conditions, and go from there.) The outside view is anchored to a base rate. Kahneman explains the concept of base rates in “Thinking, Fast and Slow”:
"…[I]t provided a reasonable basis for a baseline prediction: the prediction you make about a case if you know nothing except the category to which it belongs. This should be the anchor for further adjustments. If you are asked to guess the height of a woman and all you know is that she lives in New York City, for example, your baseline prediction is your best guess of the average height of women in the city. If you are now given case-specific information—that the woman's son is the starting center of his high school basketball team—you will adjust your estimate."
Depending on the problem at hand, starting from the outside and working in may be a recipe for better predictions and, thus, better decisions. I would argue that this approach has a multitude of applications within the realm of investing. I’ll share with you some base-rate data that is specific to success rates among active fund managers, and how investors can work from the outside to begin to zero in on winners.
Morningstar Active/Passive Barometer In 2014 I, along with some of my colleagues in our manager research group, began working on a project that would more systematically measure base rates on investors' behalf with respect to selecting successful active managers in a given Morningstar Category. Specifically, we were looking to answer this question: If an investor were to select an actively managed fund at random from a particular category, what are the odds that fund will survive and outperform its passive peers in any given time period? The product of our efforts is the Morningstar Active/Passive Barometer.
The Active/Passive Barometer is a semiannual report that measures the performance of U.S. active managers against their passive peers within their respective categories. The Active/Passive Barometer report is unique in the way it measures active managers’ success relative to the actual, net-of-fee performance of passive funds rather than an index, which isn’t investable.
We measure active managers’ success relative to investable passive alternatives in the same category. For example, an active manager in the U.S. large blend Morningstar Category is measured against a composite of the performance of its index mutual fund and exchange-traded fund peers (
We believe this is a better benchmark because it reflects the performance of actual investable options and not an index. Indexes are not directly investable. Their performance does not account for the real costs associated with replicating their performance and packaging and distributing them in an investable format. In addition, the success rate for active managers can vary depending on one’s choice of benchmark. For example, the rate of success among U.S. small-blend managers may vary depending on whether one uses the S&P SmallCap 600 or the Russell 2000 Index as their basis for comparison. By using a composite of investable alternatives within funds’ relevant categories as our benchmark, we account for the frictions involved in index investing (such as fees) and we mitigate the effects that might stem from cherry-picking a single index as a benchmark. The net result is a far more fair comparison of how investors in actively managed funds have fared relative to those who opted for a passive approach.
We measure each fund’s performance based on the asset-weighted average performance of all of its share classes in calculating success rates. This approach reflects the experience of the average dollar invested in each fund. We then rank these composite fund returns from highest to lowest and count the number of funds whose returns exceed the equal-weighted average of the passive funds in the category. The success rates are defined as the ratio of these figures to the number of funds that existed at the beginning of the period. Given this unique approach, our field of study is narrower than others, as the universe of categories that contained a sufficient set of investable index-tracking funds was fairly narrow at the end of June 2008, the starting point for our latest study. We expect that the number of categories we include in this study will expand over time. In this latest iteration we have added seven new categories.
We also cut categories along the lines of cost. Cost matters. Fees are the one of the best predictors of future fund performance. We have sliced our universe into fee quartiles to highlight this relationship.
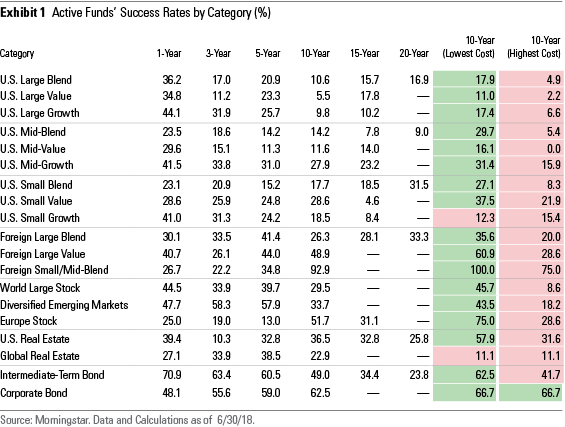
As is apparent in the accompanying table, actively managed funds have generally underperformed their passive counterparts, especially over longer time horizons. In addition, we found that failure tended to be positively correlated with fees. Higher cost funds were more likely to underperform or be shuttered or merged away, and lower-cost funds were likelier to survive and enjoyed greater odds of success. This is marked by the shading in the far right-hand columns of the accompanying exhibits. The second column from the far right contains the 10-year success rates for the lowest-cost quartile of active funds across the categories we examined. The green shading represents instances where funds in a given cohort had above-average (though maybe not great) odds of succeeding. The red shading represents cases where funds’ success rates were worse than average. The picture these figures paint is clear: Fees matter. They are one of the only reliable predictors of success.
I think the Active/Passive Barometer is a useful starting point for investors looking to take the outside view when it comes to picking successful active managers. As for working from the outside in, it is little surprise that focusing on fees is the best way to boost your base rate.
You can find the full mid-year 2018 Morningstar Active/Passive Barometer report here.
[1] Kahneman, D. 2011. “Thinking, Fast and Slow.” (New York: Farrar, Straus and Giroux).
Disclosure: Morningstar, Inc. licenses indexes to financial institutions as the tracking indexes for investable products, such as exchange-traded funds, sponsored by the financial institution. The license fee for such use is paid by the sponsoring financial institution based mainly on the total assets of the investable product. Please click here for a list of investable products that track or have tracked a Morningstar index. Neither Morningstar, Inc. nor its investment management division markets, sells, or makes any representations regarding the advisability of investing in any investable product that tracks a Morningstar index.
:quality(80)/cloudfront-us-east-1.images.arcpublishing.com/morningstar/T2LGZCEHBZBJJPPKHO7Y4EEKSM.png)
:quality(80)/cloudfront-us-east-1.images.arcpublishing.com/morningstar/HDPMMDGUA5CUHI254MRUHYEFWU.png)