
No One Way to Assess a Fund's Liquidity
Investors who care about how a fund will perform under pressure need to look across multiple dimensions of liquidity.
/s3.amazonaws.com/arc-authors/morningstar/4fee84cd-dfe7-4e42-8e83-05484be1844f.jpg)
Takeaways
- Liquidity is best assessed by looking through multiple lenses at multiple angles.
- Liquidity's primary dimensions are size, time, cost, and resiliency.
- To assess a portfolio's liquidity, investors should look at the fund from an investment process perspective relative to its investment universe and not to a broadly defined market.
What Is Liquidity? In "Cash Is Not Always King," I explained why a fund's cash allocation can't be the only criteria used to assess mutual funds' liquidity. If cash is always helpful to meet redemptions, relying exclusively on cash to pay investors back is an active decision that has a direct impact on a portfolio, increasing its concentration. When cash has been used and the most liquid positions have been sold, a fund becomes concentrated in its most illiquid investments and vulnerable to any pressure on both its assets (volatility and sell-offs) and its liabilities (redemptions).
If the amount of cash--the most liquid asset in a portfolio--can’t help in ranking funds by their liquidity level, what measure can? In and by itself, nothing. Indeed, liquidity is a multifaceted, protean, and abstract concept. Its measure is at best ex ante and theoretical. At worst, it is incomplete, misleading, and subjective. Liquidity depends on the angle taken to examine it and the lens through which you look at it. Like a dispersive prism can be used to break light up into its constituent spectral colors, it is possible to imagine a prism that breaks liquidity into multiple dimensions. Simply put, perfect liquidity implies the ability to trade large volumes, immediately, at no cost, and without price impact. Therefore, we can view size, time, cost, and resiliency as four key dimensions of liquidity. They are interdependent, though, and can contain multiple factors.
Size The first and most broadly understood dimension of a market's liquidity is its size. Indeed, a market is presumed liquid if buyers and sellers are actively and frequently putting out large orders, resulting in a large volume of continuous trading. Trading volume is a typical measure of a market's depth.
Another factor that affects the size dimension is the distribution uniformity of liquidity. For instance, for a given total trading volume, a market with an equally large number of buyers and sellers is more liquid than a market with only one buyer facing many sellers. What is generally called the “breadth” of a market can be described as the degree of homogeneity of liquidity for comparable securities. Taking the fixed-income market as an example, the so-called on/off-the-run spread highlights how consistently liquidity is distributed. For a given issuer, off-the-run securities (older issues) are usually traded less frequently than on-the-run ones (most recently issued) and the spread represents the premium investors demand to take that liquidity risk. Consequently, when this spread is atypically high, an issuer’s market homogeneity is low and the liquidity of its securities or market is degraded. The U.S. Treasury market during the 2008 financial crisis is a good example of this phenomenon: Off-the-run/on-the-run ten-year Treasury spreads went from roughly 10 basis points in mid-2007 to 60 basis points at the end of 2008.
Time The ability to trade large volumes is a necessary but insufficient condition to qualify a market or a security as liquid. Seamless execution is key: transacting fast and at a minimal cost. For a given total trading volume, a market with a higher turnover rate is more liquid than a market where only one transaction was completed. Everything that contributes to a decrease in market latency and to an increase in trading frequency improves its liquidity. On the contrary, everything that constitutes friction degrades market liquidity. For instance, bank-loan transactions are typically settled seven days after their execution making them less liquid than items such as certificates of deposit (same-day settlement), U.S. Treasuries (next-day settlement), or foreign exchange (T+2 settlement).
Cost The financial cost of completing a transaction constitutes a third dimension of liquidity. Its most obvious representation—after a broker commission or trading fee—is the bid-ask spread quoted by market makers. In this case, anything contributing to an increase in that spread will degrade liquidity. For example, regulations that increased the minimum amount of regulatory capital dealers must maintain have pushed up the cost of funding market-making inventories. Running a trading business became less profitable and some players downsized or closed their desk, while others increased their prices in the form of wider bid-ask spreads.
Another aspect of the cost dimension is the premium or discount applied when timing is a higher priority for one side of a trade than the other. For instance, a buyer trying to acquire a large block of shares will pay a premium either to a broker who sold him the full block, or to the market since his appetite will push the price up as he rides the order book. The reciprocal is true when an investor wants to sell a large position in a short amount of time. In both cases, the broker or the broader market reaps the liquidity premium.
Resiliency The cost impact an order has on the market highlights the fourth dimension of liquidity. In a world of perfect liquidity, even a very large order does not affect the market. Consequently, volatility is minimal, and liquidity does not materially change after a transaction is completed. Markets are said to be resilient when a transaction does not affect any of the other three dimensions of liquidity. For instance, after a large trade is executed, the order book and the market size should remain virtually unchanged, and the ability for another trade to be executed should not suffer from a higher execution time or a change in the associated cost.
Why should fund investors care? To assess a portfolio's liquidity, investors should use a mosaic of metrics for each liquidity dimension and look at a fund from the perspective of its investment process relative to its investment universe and not its broadly defined market.
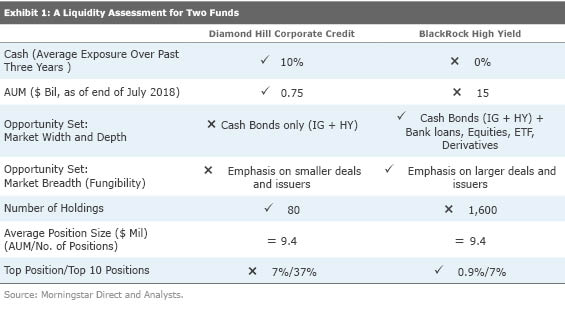
For example, using some of the numerous metrics, we can compare the liquidity of two very different funds in the high-yield Morningstar Category: Bronze-rated
However, those metrics only consider the “size” dimension of liquidity and are not considered relative to each fund’s opportunity set. For instance, Diamond Hill’s managers focus only on cash bonds, while BlackRock’s team attempts to overcome the challenge of its large asset base by broadening the fund’s scope to include bank loans, investment-grade corporates, equities, exchange-traded funds, and also derivatives such as credit default swaps and total return swaps. By the market size metrics, BlackRock appears to be the most liquid of the two. Indeed, despite being 20 times larger, the depth of its investment universe—represented by the total trading volume of securities within its scope—makes its relative footprint lower than Diamond Hill’s. Additionally, the managers of Diamond Hill Corporate Credit tend to focus on fairly small deals and comparatively smaller issuers, which decreases the breadth of its target market.
In addition to a larger, deeper, and more fungible opportunity set, BlackRock High Yield has a much more diversified portfolio. With nearly 1,400 bonds and close to 200 other holdings, the $15 billion fund has an average position size of $9.4 million. In comparison, Diamond Hill’s team runs a concentrated portfolio with only 80 positions. Despite a much smaller asset base, this results in the same $9.4 million average position. Looking closer at the portfolio’s concentration, investors can see that Diamond Hill’s largest cash bond position represents over 7% of assets compared with 0.9% for BlackRock’s, and the amount of assets concentrated in the top 10 positions adds up to 37% versus 7%, respectively.
Depending on the angle investors take and the metric they use to look at those two funds, one fund will appear more liquid than the other. But even with the information above, it is not possible to rank them with certainty.
Ultimately, it is vain to try to establish a ranking of funds based on any single liquidity metric. The key is to accept the abstraction of the concept and embrace a multidimensional analysis which aims to inform rather than rank or grade.
/cloudfront-us-east-1.images.arcpublishing.com/morningstar/ZKOY2ZAHLJVJJMCLXHIVFME56M.jpg)
/cloudfront-us-east-1.images.arcpublishing.com/morningstar/IGTBIPRO7NEEVJCDNBPNUYEKEY.png)
/cloudfront-us-east-1.images.arcpublishing.com/morningstar/HDPMMDGUA5CUHI254MRUHYEFWU.png)
:quality(80)/s3.amazonaws.com/arc-authors/morningstar/4fee84cd-dfe7-4e42-8e83-05484be1844f.jpg)