
Raising the Bar for Active Bond Managers
There’s more than meets the eye when assessing funds’ performance.
/s3.amazonaws.com/arc-authors/morningstar/56fe790f-bc99-4dfe-ac84-e187d7f817af.jpg)
Active managers in the intermediate-term bond category have fared much better against their Morningstar Category index over the past decade than their counterparts in most U.S. equity categories. That’s largely because the category benchmark, the Bloomberg Barclays US Aggregate Bond Index (commonly called the Agg), does not adequately represent the depth and breadth of the pond where active managers in this category fish. The Agg skews heavily toward low-yielding U.S. Treasuries and agency mortgage-backed securities, or MBS, which have little credit risk.
It doesn’t take a genius to take greater credit risk to boost returns, as many active managers do. These managers shouldn’t get credit for beating their benchmarks by simply taking greater risk, especially because investors can do so more cheaply on their own with exchange-traded funds that cover riskier segments of the bond market.
Because there are often differences between the amount and types of risk active managers take and the risk in the Agg, it isn’t necessarily fair to compare their returns. It is necessary to raise the bar to assess whether an active fund is delivering a differentiated source of return that can justify its fee. That is the aim of this article.
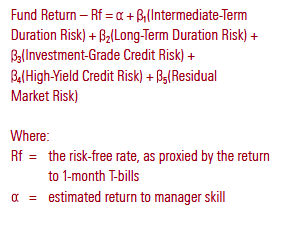
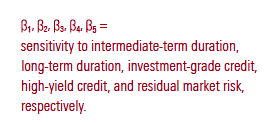
A Better Way to Assess Performance To determine whether active managers are doing more than earning compensation for building exposure to common risk factors, I constructed a regression model. This model attempts to explain each fund's return as a function of credit, duration, and residual market risk. Anything left over is attributed to manager skill, or alpha.
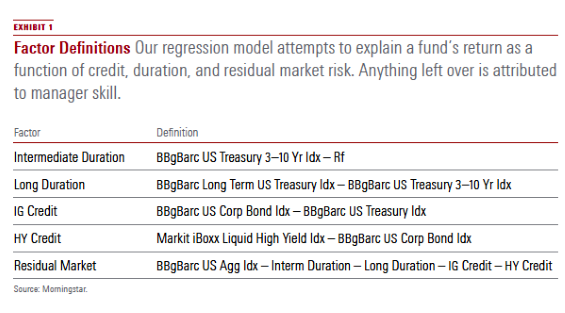
The payoff to credit and duration risk is often not linear. To address this, the model includes two duration and credit-risk factors. The duration factors break the yield curve into two, accounting for the payoff to intermediate-term and longterm interest-rate risk. Similarly, the credit factors control for the payoff to investment-grade corporate credit risk and high-yield credit risk. While credit and duration risk are the primary return drivers in the bond market, they don’t capture everything. To account for bond market returns that aren’t attributable to the credit and duration risk factors in the model, I added a residual market risk factor, which strips out the returns from those other factors from the Agg.[1] This factor may pick up convexity and interest-rate and credit risk that the other factors don’t fully capture. The residual market factor was negatively correlated with the Agg and had a negative return over the sample period.
The factor definitions are shown in EXHIBIT 1. The ETFs listed in EXHIBIT 2 either track or offer very similar exposure to each of the indexes used to construct the factors.
Formally, the regression model is expressed as:
I applied this model to every surviving actively managed mutual fund in the intermediate-term bond category over the trailing five, 10, and 15 years through April.
Controlling for Risk, Fewer Funds Outperform Before controlling for risk, active managers in the intermediate-term bond category have a respectable record over the past five and 10 years (EXHIBIT 3 ). About 47% of the actively managed funds in the intermediate-term bond category that were available to investors 10 years ago (at the beginning of May 2008) went on to survive and beat the Agg. Of the funds that survived that period, 75% beat that bogy. That said, investors didn’t know which funds would survive ahead of time, and those that did not were more likely to have poor performance. The beat rate was lower over the 15-year window and higher over the past five years, partially due to differences in survivorship rates over those periods.
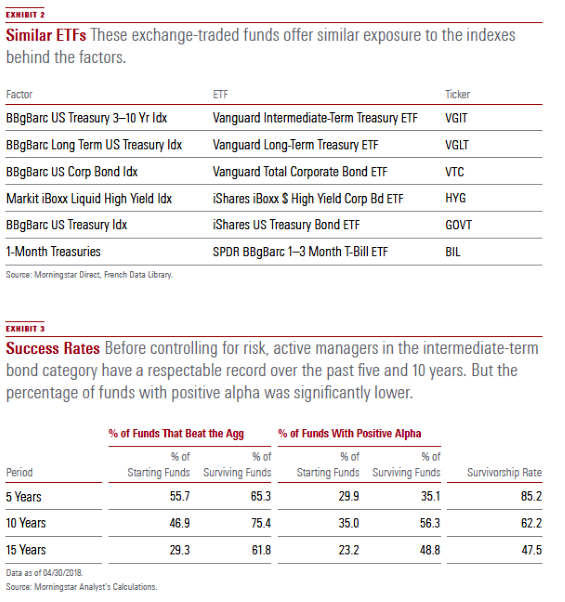
This data doesn’t tell the whole story, because some managers may have taken greater risk than the benchmark to beat it. The regression model revealed that fewer funds in each window outperformed after controlling for their exposure to common risk factors. For example, the rate of outperformance for surviving funds over the past 10 years dropped to 56% in the regression model from 75% in the simple index comparison exercise. This suggests that many active managers who beat the Agg did so by taking greater risk, which can be done more cheaply through passive alternatives.
How Do Active Managers' Risk Profiles Differ From the Agg's? EXHIBIT 4 shows the median results of the regression analysis for the active managers in the intermediate-term bond category over the trailing five, 10, and 15 years through April. The figures next to the risk factors show how sensitive the median fund is to those risks. A value of 1 would indicate that the median active fund has the same exposure to that risk as the Agg. Larger values indicate greater risk, while smaller values indicate less risk. The model fits the data fairly well, explaining 90% of the variance of the median active manager's returns over the past 10 and 15 years and 96% of the variance of those returns over the past five years.
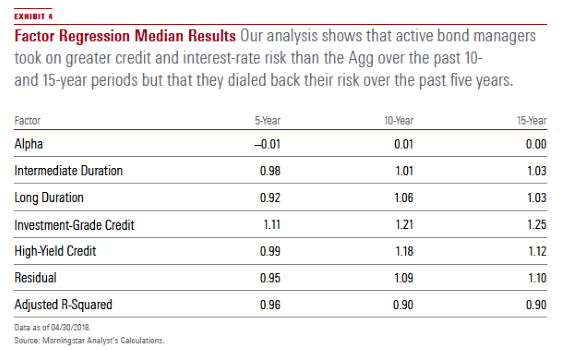
Not surprisingly, active managers in the category tended to take greater credit risk than the Agg. Over the 10- and 15-year windows, they had greater exposure to both investment-grade and high-yield credit risk, while they reined in high-yield credit risk over the past five years. Similarly, active managers tended to take greater interest-rate risk than the Agg over the past 10 and 15 years but dialed down that risk over the past five years, as concerns grew over the specter of rising rates. Residual market risk followed the same pattern.
Taken together, these results suggest that active managers took less risk over the past five years than they had over the past 10 and 15 years. That said, fewer managers had a positive alpha (returns from manager skill) over the past five years than over those longer periods, even as the percentage of funds that beat the Agg was the highest during that time. Underweighting residual market risk helped active managers’ performance during this period.
This analysis also suggests that the median actively managed fund in the intermediate-term bond category didn’t generate significant returns (positive or negative) after controlling for its risks. Of course, there are many managers who do have positive alphas. But that information is only useful if it is predictive of future performance.
Does Manager Skill Persist? Several studies, including one by Morningstar,[2] suggest that there is credence to the warning that past performance is not indicative of future results. Each fund's returns come from a combination of luck, skill (or lack thereof), and risk. Risk-taking often pays off, but not always, and it is difficult to predict when the tide will turn. Focusing on alpha from the regression analysis largely strips out the returns from risk, leaving returns from luck and skill, which are more difficult to disentangle. Luck is fleeting, while the returns from skill should be more likely to persist, at least in theory. The key question is whether managers with higher alphas in one period tend to do better in the next.
To answer that question, I sorted all funds in the category on their alphas over the trailing five years through April 2008, grouped them into quartiles, and measured their alphas over the subsequent five years. I repeated that exercise for the trailing five years through April 2013 and subsequent five-year holding period. The results are shown in EXHIBIT 5.
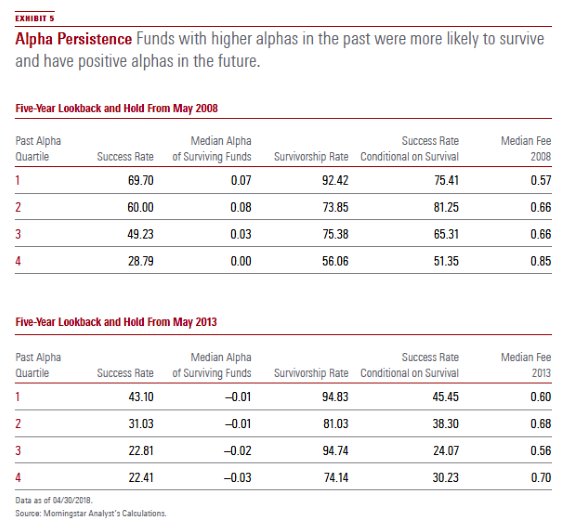
Over these two windows, managers with higher alphas in the past were more likely to survive and have positive alphas in the future (counted as success). The difference in the median alpha of surviving funds in the top and bottom quartiles over the holding periods was only modest, so it’s important to interpret these results with caution. That said, they suggest that investors have a better chance of success by investing with managers who have been successful with a differentiated strategy.
This finding is partially due to differences in fees. Managers with higher alphas in the past tended to have lower fees.
Fees Matter To test the impact of fees more directly, I grouped all intermediate-term bond funds listed at the end of April 2003 into quartiles based on their 2003 annual report expense ratio and tracked their performance over the next 15 years. I repeated this exercise (with the 2008 and 2013 expense ratios) for all funds listed at the end of April 2008 and 2013 and tracked their performance over the next five and 10 years, respectively. The results are shown in EXHIBIT 6.
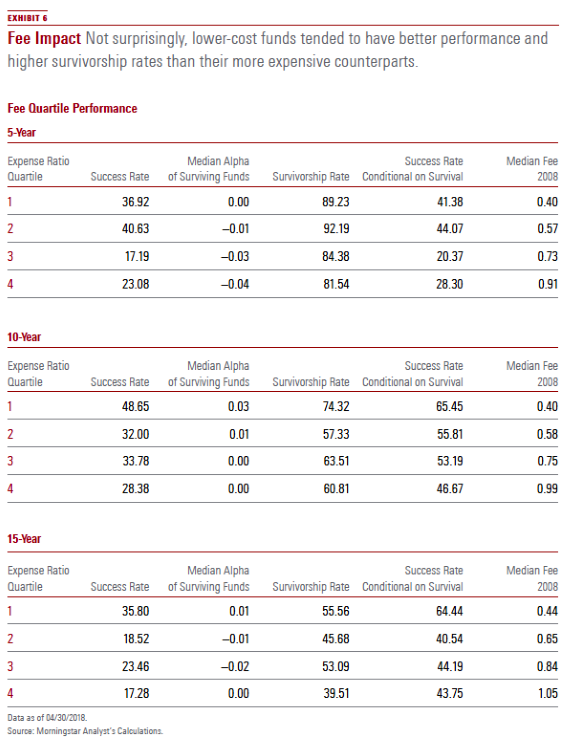
Not surprisingly, lower-cost funds tended to have better performance and higher survivorship rates than their more expensive counterparts.
Active or Passive? The investment-grade bond market isn't rife with mispricing. While the Agg is an easier benchmark to beat than most broad U.S. equity indexes, many managers who earn higher returns than that index do so by taking greater risk—often fishing outside the Agg. That risk doesn't always pay off, and investors can often get it more cheaply through low-cost ETFs that track riskier areas of the investment-grade universe, like corporate bonds. After controlling for risk, most active managers have not survived and outperformed the Agg over the long term, and that pattern will likely continue. So, indexing isn't a bad starting point.
Yet, there are many active managers who do outperform, even after controlling for exposure to common sources of risk. While they may be taking other types of risks, it is difficult to replicate their performance with passive options.
Investors who decide to hire an active manager can improve their odds of success by screening for those with low fees and strong performance that doesn’t come from loading up on credit, duration, and other forms of market risk. Screening for Morningstar medalists with positive Process and Price pillar ratings is a good place to start.
[1] This term slightly reduced most funds’ alphas, though its inclusion didn’t significantly affect the results. Its inclusion has the benefit of giving the Agg an alpha of 0 and rescaling that benchmark’s other risk coefficients to 1, making it easier to compare the results of the other funds.
[2] Bryan, A. & Li, J. 2016. “Performance Persistence Among U.S. Mutual Funds.” Morningstar White Paper, January.
This article originally appeared in the August/September 2018 issue of Morningstar magazine. To learn more about Morningstar magazine, please visit our corporate website.
:quality(80)/cloudfront-us-east-1.images.arcpublishing.com/morningstar/OMVK3XQEVFDRHGPHSQPIBDENQE.jpg)
:quality(80)/cloudfront-us-east-1.images.arcpublishing.com/morningstar/WJS7WXEWB5GVXMAD4CEAM5FE4A.png)
:quality(80)/cloudfront-us-east-1.images.arcpublishing.com/morningstar/NOBU6DPVYRBQPCDFK3WJ45RH3Q.png)