
Mind the Gap 2018
Investors made good use of mutual funds in an up market.
/s3.amazonaws.com/arc-authors/morningstar/fcc1768d-a037-447d-8b7d-b44a20e0fcf2.jpg)
These are good days for investors. The last bear market was nearly a decade ago. Socking money away in mutual funds and then watching it grow has worked quite nicely.
We see the proof not only in strong market returns but also in solid Morningstar Investor Returns. Investor returns, or dollar-weighted returns, measure return on investments for the typical investor by factoring in cash flows and fund size. When the markets move up steadily, investors are part of a positive feedback mechanism that encourages continued investment.
When markets lurch, investors do worse because they make timing mistakes. Investors large and small tend to sell after downturns only to buy back in after rallies. But times have been good lately, as we can see in our latest look at aggregate investor return data through the first quarter.
A second factor in the shrinking gap is industry assets under management. They have grown dramatically because of equity appreciation, overshadowing fund flows over the period.
We looked at investor returns over the trailing three-, five-, and 10-year periods by asset class and by Morningstar Category. Our data set included U.S.-domiciled open-end mutual funds, but not exchange-traded funds because short-term trades and shorting make it difficult to calculate returns on investment.
The data shows when investors tend to use funds well and when they do not. There are some limitations to the granular data, however, so we find that broad trends are most telling. In this article, we home in on the 10-year results broken down by asset class.
Inside the Data To calculate fund investor returns, we adjust a fund's official returns using monthly cash flows in and out of the fund. Thus, we calculate a rate of return generated by a fund's investors. As with an internal rate of return calculation, investor return is the constant monthly rate of return that makes the beginning assets equal to the ending assets, with all monthly cash flows accounted for.
We aggregate this data across a larger peer group by asset-weighting investor returns among the group’s constituents, thus emphasizing the results of the peer group’s largest funds and better representing the typical investor’s experience. We then compare the peer group’s results with those of the average fund to see whether investors timed their investments well.
You can find Morningstar Investor Returns for a fund on its Morningstar.com page or in Morningstar Direct. The investor return is essentially the aggregate investor’s bottom line. All single-fund investor returns come with the caveat that there is a fair amount of randomness in them that is beyond the fund manager’s control. Two funds doing the same thing might have different investor returns just because they are in different sales channels or had different launch dates. Some factors are more within the fund company’s control than others, such as how a fund is positioned in ads and other marketing, the soundness of the strategy, and the volatility of a fund. All of these things play key roles in how well investors use a fund.
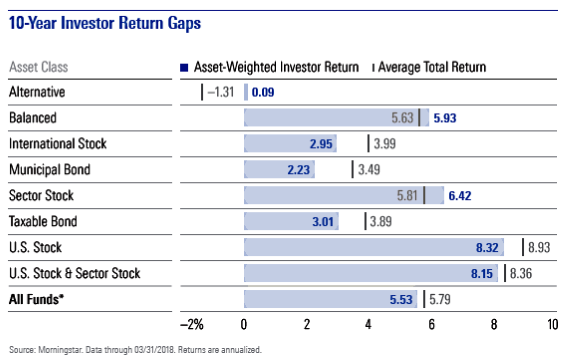
Narrowing Gaps As seen in the exhibit, the typical investor (as represented by asset-weighted investor returns) in diversified domestic-equity funds earned a robust 8.32% annualized return for the 10 years ended March 31. That compares with 8.93% for the average fund, making for a shortfall of 0.61 percentage points. That is a modest improvement over our previous report. It is worth noting that the gap might be different if we included ETFs in the study. Although it is hard to know whether short-term traders in ETFs generated strong returns, long-term investors have been steadily building positions in low-cost large-cap equity funds.
Balanced funds, a group that includes allocation funds, target-date funds, and traditional balanced funds, saw a positive gap of 0.30 percentage points, with the average investor enjoying a 5.93% annualized return. That is also an improvement over our last measurement. It reflects the continued strength of target-date funds, both in terms of investor behavior and strong gains among well-diversified funds. Target-date funds are easy for investors to use because performance swings are muted, and most investors buy in through 401(k) retirement plans with automated savings processes, which creates a disciplined track of continued savings.
The gap for municipal-bond funds shrank slightly to a 1.26-percentage-point annualized shortfall based on asset-weighted investor returns of 2.23%. It is encouraging that the gap shrank, but it still seems pretty high for a fairly tame low-return asset class. Outflows corresponded with headline scares over the past decade, driving investors away from munis at the wrong time—specifically, the Puerto Rico debt debacle and the wildly inaccurate prediction of doom by influential market researcher Meredith Whitney.
In other asset classes, the gap worsened. The gap among international-equity funds grew to 104 basis points, with investor returns of 2.95% annualized. Investors’ timing in regional funds dedicated to Europe and Asia, and in more diversified foreign large-growth funds, has been particularly poor.
The gap in taxable-bond funds grew to 88 basis points annualized with an asset-weighted investor return of 3.01% annualized. It is not too surprising that investor timing has been off in morespeculative categories like emerging-markets bond and bank-loan funds, but even core intermediatebond funds show a gap of 87 basis points.
Alternatives show the worst investor returns but the best investor returns gap. The investor return is a dismal 9 basis points, but the gap is a positive 140 basis points. Those two results are related rather than contradictory: When a fund has poor returns for an extended period of time, then just about any time is a good time to sell. It is worth noting, though, that bear-market funds are in our alts group, and they drag down returns while boosting the positive gap.
The alts funds’ results also are affected by survivorship bias. Our figures only include funds that were in existence at the end of the period. Given the asset weighting, that likely has a very small effect in more-established asset classes, but it likely has an outsize impact in alts, which was quite small 10 years ago.
In the aggregate, the average investor trailed the average fund by 26 basis points annualized over the past 10 years. The asset-weighted investor return for the period was 5.53% annualized versus 5.79% for the average fund.
This aggregate figure included only funds that hold individual securities, and excluded funds of funds. The separate asset-class returns include funds of funds to capture investors’ experiences in areas where that structure is common, like balanced funds. As target-date funds, which are usually funds of funds, are the largest and fastest-growing subset of balanced funds, we thought it was important to include that structure.
Recent Trends A comparison with five-year investor return gaps illustrates a key trend: Diversified U.S. equities showed a positive gap over that period, with a robust asset-weighted investor return of 11.73%, 0.67 percentage points higher than the average return. The market has been relatively stable and consistently rising, and thus the best of both worlds for U.S. equity fund investors.
The gap for balanced funds was smaller for the five-year period, only 2 basis points, but still positive. For international equity, muni bonds, and taxable bonds, the gaps also shrank relative to the 10-year period, though they remained negative.
The gap for alternatives funds also narrowed, but it flipped from positive to negative territory: There was a 46-basis-point gap on asset-weighted investor returns of 1.21% annualized. As mentioned, the 10-year figures were likely boosted by survivorship bias, but the number of alts funds with investor return figures triples when we go to the five-year record. As a result, the survivorship bias is likely smaller and reflects the fact that investors have had a hard time picking winning funds. Also, they tend to give up on alts funds more quickly than those in other asset classes.
Looking at the longer-term gaps for individual alternatives categories, we found that dismal investor returns were not limited to bear-market funds. Multialternative funds produced a poor investor return of 0.00% over 10 years. Marketneutral funds made only 0.32% for investors, while long-short had a more tolerable 3.07% annualized figure. All three had a gap of greater than 100 basis points per year. So, the funds produced poor returns, and investors did a pretty poor job of timing them, too.
Lessons Learned Over the years, we've seen some strong themes emerge among funds with strong investor returns. Low-cost and relatively low-risk funds tend to work better for investors: Low costs bolster returns, and lower risk makes extreme performance less likely.
Understanding your fund will also go a long way to ensuring you make the most of it. Trailing returns can mask some highs and lows. Simply going back over calendar-year returns to see if you can handle a repeat of the worst year (usually, that’s 2008) can be useful.
Finally, knowing a fund’s strategy and when to expect it to fare well or poorly will help you know when to sell and when to hold on. The better you know your funds, the better you’ll do.
This article originally appeared in the August/September 2018 issue of Morningstar magazine. To learn more about Morningstar magazine, please visit our corporate website.
/cloudfront-us-east-1.images.arcpublishing.com/morningstar/ZKOY2ZAHLJVJJMCLXHIVFME56M.jpg)
/cloudfront-us-east-1.images.arcpublishing.com/morningstar/IGTBIPRO7NEEVJCDNBPNUYEKEY.png)
/cloudfront-us-east-1.images.arcpublishing.com/morningstar/HDPMMDGUA5CUHI254MRUHYEFWU.png)
:quality(80)/s3.amazonaws.com/arc-authors/morningstar/fcc1768d-a037-447d-8b7d-b44a20e0fcf2.jpg)