
The Evolution of the Chinese Market
As they open their doors to foreign investors, Chinese capital markets are entering the next stage of their evolution.
/s3.amazonaws.com/arc-authors/morningstar/4350bbc4-9f7e-4cd7-ab9d-ff0490158cb6.jpg)
/s3.amazonaws.com/arc-authors/morningstar/a90ba90e-1da2-48a4-98bf-a476620dbff0.jpg)
This article was published in the June 2018 issue of Morningstar ETFInvestor. Download a complimentary copy of Morningstar ETFInvestor by visiting the website.
In "The Evolution of Emerging Markets," we discussed the past, present, and future of the composition and drivers of emerging-markets stocks. One of the more noteworthy developments that we highlighted was China's rise to prominence among emerging stock markets. When Chinese stocks were first included in the MSCI Emerging Markets Index in September 1996, they accounted for just 0.46% of the benchmark's value. As of March 2018, Chinese stocks made up 29.9% of the index's total market cap. Here, I will explore how the Chinese market has changed in the past 20-plus years.
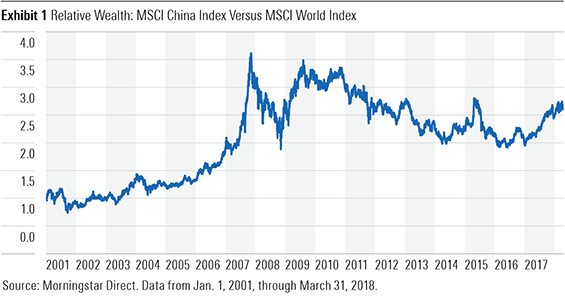
Strong Performance, Gut-Wrenching Volatility The MSCI China Index was launched on Oct. 31, 1995, some seven years after the launch of the MSCI Emerging Markets Index. From March 2001 through the end of March 2018, the MSCI China Index generated annualized total returns of 12.2% versus 6.0% for the MSCI World Index--a measure of the performance of developed-markets stocks. During that same span, the MSCI Emerging Markets Index gained 10.7% annually. As illustrated in Exhibit 1, beginning in mid-2003, the performance of the MSCI China Index started to deviate positively from the MSCI World Index. Chinese stocks' cumulative relative returns versus developed-markets stocks peaked in 2007, just prior to the global financial crisis. This was followed by a sharp drawdown and, subsequently, an extended period of underperformance that ended around mid-2014. More recently, Chinese stocks have been strong relative performers. In 2017, the MSCI China Index surged 54.1% while the MSCI World Index advanced 22.4%.
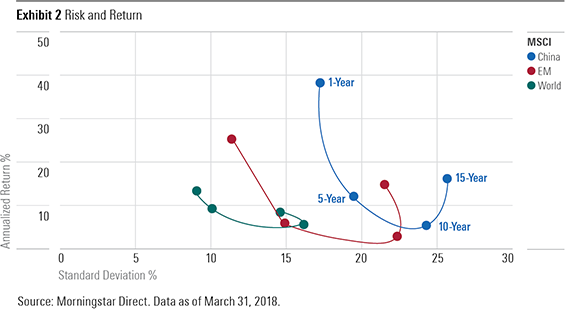
Chinese stocks' strong absolute and relative performance has come with a heaping helping of volatility. The MSCI China Index has experienced much greater volatility (as measured by the standard deviation of its monthly returns) than the MSCI World Index. In Exhibit 2, I plotted the annualized returns and standard deviations of the MSCI China, MSCI Emerging Markets, and MSCI World indexes for the 15-year period ended March 31, 2018. During this span, the MSCI China Index experienced an annualized standard deviation of 25.7% with an annualized return of 16.3%. The MSCI World Index's annualized standard deviation was just more than half of that of the MSCI China Index, at 14.5%, while the benchmark generated an annualized return of 9.2%.
Changes in Definition and Composition China was not included in the MSCI Emerging Markets Index at its January 1988 inception, nor did MSCI recognize it as a stand-alone country at that time. Back then Malaysia was the country with the highest weighting in the index, at 33.8%.
On Sept. 3, 1996, China was added to the MSCI Emerging Markets Index at a weighting of 0.46%. This was negligible in the context of the emerging-markets benchmark and even more so within the MSCI All-Country World Index. In the past two-plus decades, the definition and composition of the Chinese stock market has changed dramatically. In the early days, the market was made up of a number of B-shares and H-shares. [1] Eventually, more Chinese red-chips and H-shares were added to the mix as they listed their shares in Hong Kong in the early 2000s. Most recently, U.S.-listed ADRs were included in MSCI's index in November 2015.
As of March 2018, China's weighting in the MSCI Emerging Markets Index had increased to 29.9%. This is significantly greater than the next three largest countries included in the benchmark: South Korea (15.1%), Taiwan (11.8%), and India (8.1%).
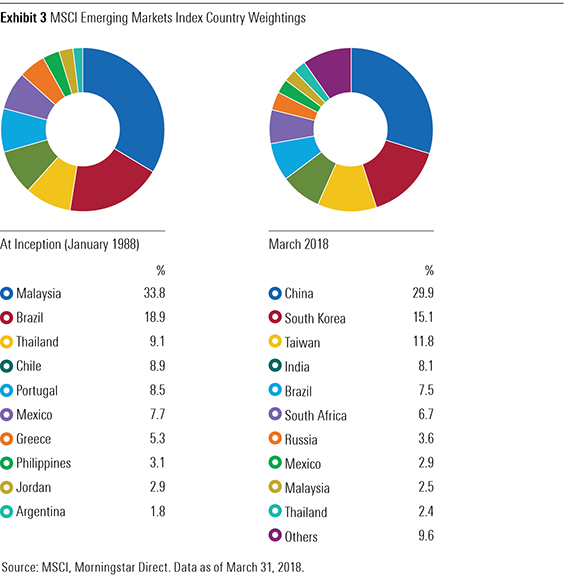
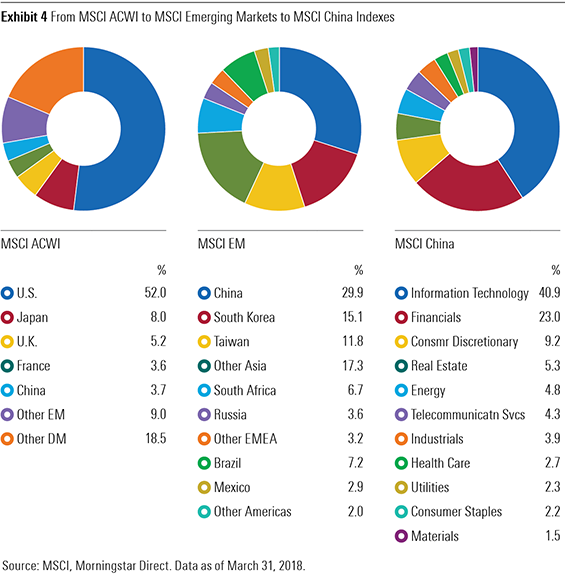
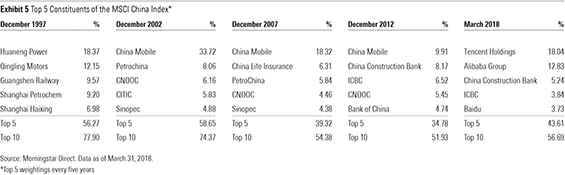
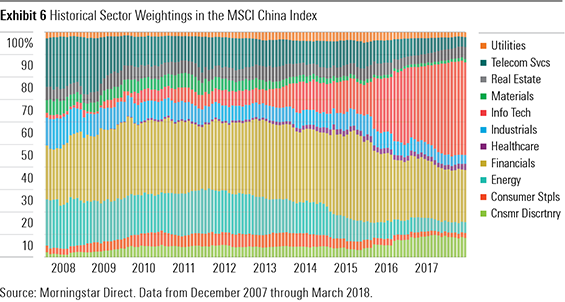
Exhibit 5 shows the changes among the top five constituents of the MSCI China Index every five years over the past two decades. Exhibit 6 shows the change in the index's sector weightings over the past 10 years. These changes are attributable to a combination of 1) changes to the index's inclusion rules; 2) new listings and IPOs being added to the index; and 3) the structural transformation of the Chinese economy. In Exhibit 6, we can see that the information technology sector went from representing just 2% of the index in 2007 to becoming its largest sector by the end of March 2018, making up 41% of the benchmark's value. The telecommunications sector has shriveled to 4% of the index's value from 21%. This is, in part, evidence of the diminishing footprint of the traditional telecommunications industry and the rise of newer and more innovative communication, commerce, and entertainment platforms. Most notably, it reflects the emergence of a pair of tech giants: Tencent Holdings (listed in Hong Kong) and
Tencent was the first Internet company to list on the Stock Exchange of Hong Kong, when it made its debut in June 2004. It was added to the MSCI Hong Kong Index in May 2007 and subsequently transitioned to the MSCI China Index in May 2008. During the 10 years that Tencent has been a member of the MSCI China Index, its total market cap has risen 174-fold, to $525 billion from $3 billion. Its weighting within the MSCI China Index increased to 18% as of the end of March 2018 from just under 2% at the time of its inclusion. The other tech giant, Alibaba, listed on the New York Stock Exchange in September 2014. Despite its size (a $168 billion market cap at its IPO), Alibaba was not initially included in the MSCI China Index. In November 2015, MSCI decided to include foreign listings of Chinese companies in the index. This decision resulted in U.S.-listed ADRs (for example, Alibaba,
In addition to the expansion of the tech sector, we have also seen the consumer staples and consumer discretionary sectors expand their share of the benchmark's value to 11% from 6%. This has been driven by growth in the consumer discretionary sector, which, in turn, is linked to the Chinese domestic-consumption growth story.
What Might the Future Hold? Change is the only constant. Indexes are living, breathing creatures that evolve in sync with the economy and the markets. Nonetheless, some changes are "man-made" and, in the case of the MSCI China Index, one such series of changes is well-known (announced in June 2017) and recently became effective. On June 1, 2018, MSCI added 234 China A-shares to the MSCI Emerging Markets Index in a two-step process, up from 222 as announced last year, owing to subsequent index reviews and stock suspension conditions. Using figures in MSCI's May 2018 Index Review, China A-shares would make up 0.78% of the MSCI Emerging Markets Index once they've been folded in. All the remaining Chinese shares would represent just under 30% of the index's value. China A-shares would represent 2.5% of the MSCI China Index (again using figures in MSCI's May 2018 Index Review) once all is said and done.
This is just the start. MSCI has provided a road map, though no specific timelines, outlining the next milestones for China A-shares inclusion. These could include increasing the 5% inclusion factor and the addition of China A-shares mid-cap stocks. While the timing is unknown, it seems all but certain that China A-shares' representation within the MSCI Emerging Markets and MSCI China indexes will increase.
As Chinese stocks' footprint continues to expand in equity indexes to more closely align with the footprint of the nation's capital markets and its economy, some investors may be asking, among other things, "How large will China's share of these indexes become?" As of the end of March 2018, China's 3.6% share of the MSCI ACWI represented a large disconnect relative to its 14.8% share of global gross domestic product (per 2016 data from the World Bank). By way of comparison, U.S. stocks made up 52.0% of the MSCI ACWI, and its share of global GDP was 24.6% (per 2016 data). Thus, it seems the best answer to the above question is "larger" and potentially "much larger."
Given the expanding influence of China A-shares in Chinese equity indexes, investors should work to better understand the fundamentals of the China A-share market. Morningstar Global Exchange-Traded Product Reports have a "Fundamental View" section that provides a broad overview of the underlying macroeconomic fundamentals that will affect an exchange-traded fund's performance. These reports on ETFs with China A-share exposures should help investors navigate through some of the nuances in this asset class. Our equity analysts' research on specific China A-share companies can also assist investors in understanding the fundamentals of the individual stocks as well as the relevant sectors. Investors should also note that as China A-shares are added to the existing MSCI China Index, industry weightings will also change, especially if mid-cap stocks are added to the mix.
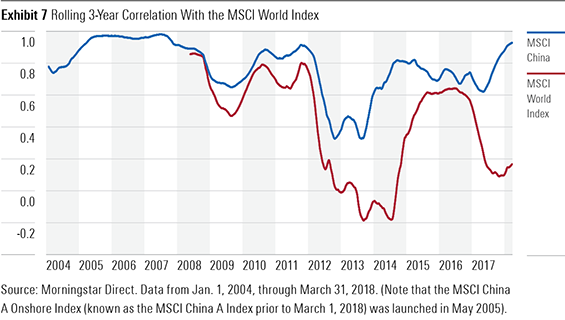
Exhibit 7 shows the rolling three-year correlation of the MSCI China and MSCI China A Onshore indexes versus the MSCI World Index dating back to January 2004. The MSCI China Index's correlation with the MSCI World Index averaged 0.77 during this period. This is indicative of some degree of potential diversification benefit for global investors. However, the future direction of this relationship is difficult to predict given the addition of China A-shares. This is because those shares have historically experienced a lower level of correlation to the MSCI World Index compared with that of the MSCI China Index. Over the past nine and a half years, the correlation between the MSCI China A Onshore and MSCI World indexes was 0.40. If we simply extrapolate this historical relationship into the future, the increasing portion of China A-shares in the MSCI China Index would, in theory, reduce the correlation of the MSCI China Index with the MSCI World Index, implying greater diversification benefits. However, from a broader perspective, the further opening up of the Chinese equity markets, as well as continued globalization and expansion of trade between China and the rest of the world, will make China ever more global. These factors will likely increase the correlation of the MSCI China and MSCI World indexes in the long run, hence reducing the diversification benefit for global investors.
Key Takeaways 1) The Chinese equity market has evolved and will continue to do so. With the inclusion of China A-shares and possible future inclusion of mid-cap stocks, emerging-markets indexes will likely further increase their concentration in the Asia region, and China in particular.
2) How large will China's share of these indexes become? The further opening up and evolution of the Chinese market will help China's weighting within international indexes to grow into the nation’s true economic footprint. Thus, it seems that the best answer to the above question is "larger" and potentially, "much larger."
3) The further opening up of the Chinese equity markets, as well as continued globalization and expansion of trade between China and the rest of the world, will make China ever more global. These factors will likely serve to increase the correlation of the MSCI China Index with the MSCI World Index in the long run, hence reducing the diversification benefit for global investors.
[1] Chinese equities are composed of A-shares, B-shares, H-shares, red-chips, P-chips, and foreign listings (such as ADRs). China A-shares are companies incorporated in mainland China, listed on the Shanghai Stock Exchange or the Shenzhen Stock Exchange, quoted in renminbi, and only available to mainland investors and qualified foreign institutional investors. B-shares are companies incorporated in mainland China, listed on the Shanghai Stock Exchange or Shenzhen Stock Exchange, quoted in U.S. or Hong Kong dollars, respectively, and available to foreign investors. H-shares are companies incorporated in mainland China and traded in Hong Kong. Red-chips are companies incorporated outside of China and controlled by the state, provinces, or municipalities of the People's Republic of China and traded in Hong Kong. P-chips are companies incorporated outside of China and controlled by PRC individuals and traded in Hong Kong. Foreign listings are companies with significant Chinese operations listed outside of China or Hong Kong, for example, ADRs listed in the United States.
Disclosure: Morningstar, Inc. licenses indexes to financial institutions as the tracking indexes for investable products, such as exchange-traded funds, sponsored by the financial institution. The license fee for such use is paid by the sponsoring financial institution based mainly on the total assets of the investable product. Please click here for a list of investable products that track or have tracked a Morningstar index. Neither Morningstar, Inc. nor its investment management division markets, sells, or makes any representations regarding the advisability of investing in any investable product that tracks a Morningstar index.
/d10o6nnig0wrdw.cloudfront.net/04-18-2024/t_34ccafe52c7c46979f1073e515ef92d4_name_file_960x540_1600_v4_.jpg)
/d10o6nnig0wrdw.cloudfront.net/04-09-2024/t_e87d9a06e6904d6f97765a0784117913_name_file_960x540_1600_v4_.jpg)
/cloudfront-us-east-1.images.arcpublishing.com/morningstar/T2LGZCEHBZBJJPPKHO7Y4EEKSM.png)
:quality(80)/s3.amazonaws.com/arc-authors/morningstar/4350bbc4-9f7e-4cd7-ab9d-ff0490158cb6.jpg)
:quality(80)/s3.amazonaws.com/arc-authors/morningstar/a90ba90e-1da2-48a4-98bf-a476620dbff0.jpg)