
Credit Markets: Investment Grade Struggles While High Yield Strengthens
Most fixed-income indexes declined in the second quarter as rising interest rates took their toll.
/s3.amazonaws.com/arc-authors/morningstar/54f9f69f-0232-435e-9557-5edc4b17c660.jpg)
- The yield curve continues to flatten.
- Outflows among high-yield open-end funds overwhelm ETF inflows.
- Downgrades edge out upgrades during the second quarter
Summary
Most fixed indexes continued their declines over the course of the second quarter as interest rates rose and investment-grade corporate credit spreads widened out. However, with its shorter duration and higher correlation to economic growth, the high-yield sector was one of the few standouts that registered gains this quarter.
Morningstar's Core Bond Index, our broadest measure of the fixed-income universe, declined 0.42% in the second quarter through June 25 and has fallen a total of 1.94% year to date. The decline was mainly driven by the increase in interest rates across the entire yield curve but was also under pressure from widening investment-grade corporate credit spreads. Underlying the Core Bond Index, Morningstar's Short-Term Core Bond Index was able to post a small gain of 0.15% even as short-term rates rose to their highest levels in over a decade. This gain in the second quarter helped to offset earlier losses and this index is now down only 0.24% for the year. The Intermediate Core Bond Index declined 0.11% during the quarter and has dropped 1.39% year to date. With its longer duration and greater price sensitivity to interest rates, the Long-Term Core Bond Index fell by 1.63% this quarter and had registered a 4.75% loss this year as falling bond prices from rising rates more than offset the yield carry from the underlying bonds in this index.
In the Treasury market, the Morningstar U.S. Government Bond index fell by 0.14% and has declined 1.34% thus far this year. Similarly, the Morningstar Agency Bond Index declined 0.16% in the quarter and 0.70% year to date. One of the bright spots this quarter was in the Treasury Inflation Protected Securities market. As inflation measures edge up, investors looked to TIPS, which led the Morningstar TIPS Index to a gain of 0.42%; however, that gain was not enough to offset the losses incurred in the first quarter and the index remains in the red to the tune of 0.35% for the year.
During the second quarter, through June 25, the yield on the 2-year Treasury bond rose another 26 basis points on top of the 38 basis points it rose in the first quarter. At its current yield of 2.53%, the 2-year is trading at its highest yield since August 2008. The yield on the 5-year Treasury bond rose 19 basis points to 2.75%, which rivals its highest yield since 2010. Along the long end of the curve, the yield in the 10-year Treasury rose 14 basis points to 2.88%. The yield on the 10-year briefly broke through the psychological ceiling at 3% but was quickly driven back down as concerns that a global trade war would emerge drove a flight to safety. At the longest end of the curve, the 30-year rose only 5 basis points to 3.02%. As short-term rates have continued to rise faster than long-term rates, the spread between the 2-year Treasury and the 10-year Treasury has since compressed to 35 basis points, representing the flattest the yield curve has registered since fall 2007.
In the corporate bond market, the Morningstar Corporate Bond Index (our proxy for the investment-grade bond market) declined 1.25% this quarter as the combination of higher interest rates and wider credit spreads pushed bond prices down. Year to date, our corporate bond index has lost 3.46%. In contrast, in the high-yield market, the Bank of America Merrill Lynch High Yield Master Index rose 0.48% in the second quarter as credit spreads tightened and the higher yield carry of the index more than offset the impact of higher interest rates. Year to date, the high-yield market has risen 1.43%. Among European fixed-income markets, the Morningstar Euro Corporate Bond Index rose 0.11% as the benefit from the decline in underlying interest rates on benchmark German bonds offset the amount that corporate credit spreads widened. Year to date, the European Corporate Bond Index has registered a loss of 0.19%.
Once again, the emerging-markets fixed-income indexes were among the worst-performing fixed-income asset classes following significant losses in the first quarter. Quarter to date, the Morningstar Emerging Market Composite Index fell 2.60%, as the underlying Morningstar Emerging Market Sovereign Index declined 4.03% and the Morningstar Emerging Market Corporate Index fell 1.79%. Morningstar's Emerging Market High Yield Index dropped by 4.68%. Year to date, the composite index has fallen 4.23%, the sovereign index has dropped 5.96%, the corporate index has declined 3.24%, and the high-yield index has plunged by 5.88%.
Fixed-Income Index Returns
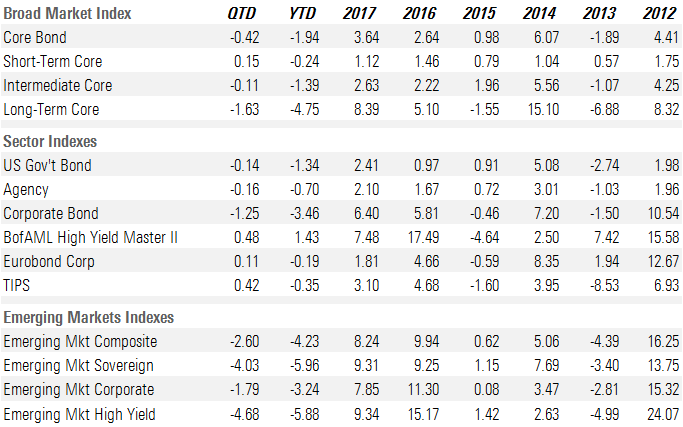
Source: Morningstar, Inc., Bank of America Merrill Lynch Global Indexes. Data as of June 25, 2018.
A Tale of Two Bond Markets: Investment Grade Struggles While High Yield Strengthens It's been a tale of two cities across the corporate bond markets thus far this year. Since the end of last quarter, through June 25, the average credit spread of the Morningstar Corporate Bond Index, our proxy for the investment-grade bond market, widened 13 basis points to +128; however, in the high-yield market, over the same time period, the Bank of America Merrill Lynch High Yield Master Index has tightened 32 basis points to +347. Year to date, the investment-grade index has widened 32 basis points, whereas the high-yield index has tightened 16 basis points.
At its current level, the average credit spread in the investment-grade market is at its widest level this year and is at its highest level since the beginning of 2017. At that time, the corporate bond markets were still recovering from an earlier plunge in oil prices which bottomed out in 2016. In contrast, the average credit spread of the high-yield index is not that far off of its tightest levels since prior to the 2008−09 credit crisis. Since the beginning of 2000, the high-yield index has only ever traded below the current level approximately 12% of the time.
Corporate Bond Credit Spreads
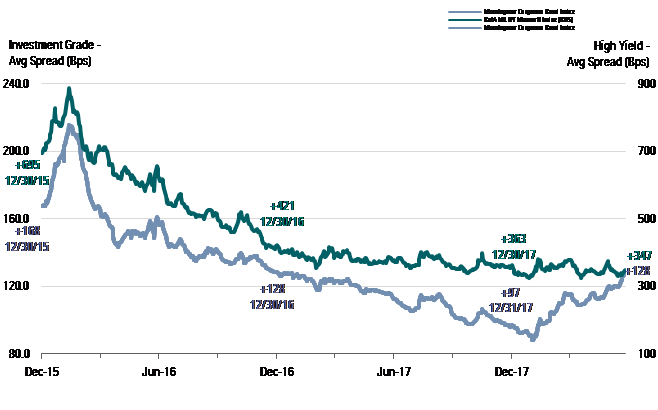
Source: Morningstar, Inc., Bank of America Merrill Lynch Global Indexes. Data as of June 25, 2018.
There are several factors in play that have led to this divergence. Investment-grade credit spreads are more susceptible to sell-offs in relation to debt-leveraged mergers and acquisitions than are high-yield spreads. Following a recent court ruling in which the Justice Department lost its attempt to block the proposed merger between AT&T T and Time Warner, investment-grade portfolio managers have become increasingly concerned that the potential for mega-mergers and acquisitions that may not have passed antitrust regulators in the past, may now be possible. For example, as soon as the Department of Justice announcement was made, Comcast CMCSA commenced a bidding war by making a counter offer to acquire certain assets from Twenty-First Century Fox FOX, for which Walt Disney DIS had made a prior offer. Typically, mergers and acquisitions are funded with significant amounts of newly issued debt, which heighten default risk and often lead to rating downgrades. However, more often than not, high-yield companies are purchased by larger, investment-grade companies and the outstanding debt of those acquired high-yield companies are upgraded to the same rating as the acquirer.
While investment-grade has struggled, the high-yield market has outperformed thus far this year as the performance of the underlying companies in the high-yield universe are more affected by changes in economic activity, which has been robust this quarter. Whether it has been driven by the implementation of the tax cuts earlier this year, or some other reason, economic activity has been on a tear recently and is much stronger than was expected at the beginning of the quarter. In its most recent GDPNow estimate based on current economic metrics, the Federal Reserve Bank of Atlanta is projecting that second-quarter GDP growth will be 4.7%. This rate of growth would represent the second strongest quarterly growth rate over the past four years, surpassed only in third-quarter 2014.
Rising interest rates have also played a significant part in the divergence between the performance of the investment-grade and high-yield markets. With their lower credit spread and longer average duration, investment-grade bond performance is more closely correlated to movements in interest rates than high-yield bonds. High-yield bonds typically have shorter durations and wider credit spreads, which are more closely tied to the performance of the underlying companies. Similar to the credit spread widening that occurred during the "taper tantrum" in mid-2013, investors are requiring additional credit spread to compensate for the risk that interest rates rise further.
The impact to corporate credit spreads on the investment-grade market from issuers that engage in large, debt-funded M&A can be seen in the performance of Disney and Comcast notes. As the bidding war for the Fox assets between the two rages on, the credit spreads for those company's bonds have widened out as investors price in a higher probability that debt leverage will increase significantly for whichever firm emerges as the winner. With its higher credit rating, Disney's notes had been outperforming the market earlier this year, but this month Disney's 2027 notes widened 18 basis points and are 33 basis points wider than at the end of 2017. While the credit spread on Comcast's 2028 notes was unchanged in June, the notes have widened 48 basis points since the end of last year. This compares with the index, which widened 8 basis points in June and 32 basis points year to date.
Among the winners and losers this quarter, those companies with a significant amount of cash that had previously been held overseas to avoid tax payments upon repatriation, performed well as the new tax laws took effect. Both the healthcare and technology sectors outperformed the overall investment-grade index thus far this year as both sectors have a high percentage of issuers that fit this description. To the downside, the media sector has far underperformed the overall market as debt-financed M&A ravages the credit quality for many of the issuers within that sector.
Morningstar Corporate
Credit Index YTD Spread Change
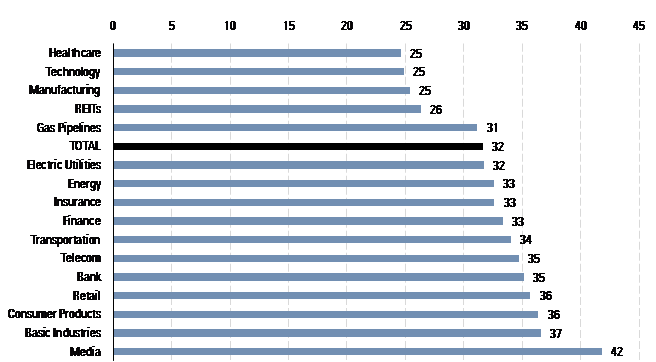
Source: Morningstar, Inc. Data as of June 25, 2018.
Yield Curve Continues to Flatten as Rates Rise In conjunction with the hikes in the federal funds rate, short term rates have continued their march higher. However, the rise in long term rates has lagged the rise in short-term rates, which has led to further flattening of the yield curve. On the shorter end of the curve, the yield on the 2-year Treasury bond rose 26 basis points this quarter to 2.53%, rivaling the highest yield it has traded at this year and the highest yield the 2-year has registered since mid-2008. Along the longer end of the curve, after breaking above the 3% psychological barrier a few weeks ago, the 10-year has rallied once again and sunk below that threshold to 2.88%. The bid for longer-term U.S. Treasuries coincided with the increasing rhetoric surrounding global trade re-negotiations and the rising risk that new tariffs will be imposed and the responding retaliatory tariffs will impede global economic growth. This drove the spread between the 2-year and 10-year Treasury to 35 basis points, representing the flattest the yield curve has been since fall 2007.
10-Year Treasury Constant Maturity Minus 2-Year Treasury Constant Maturity

Source: Morningstar, Inc. Data as of June 25, 2018
The yield curve has been on a multiyear flattening trend since the Fed began to raise short-term rates in its pursuit to normalize monetary policy and this trend may not yet have fully run its course. According to the CME FedWatch Tool, the market is pricing in additional hikes to the federal funds rate (currently 1.75%−2.00%) over the course of the year. The probability that the federal funds rate at the end of 2018 will be greater than 2.00% is 91% and the probability that the federal funds will be 2.25% or higher is 50%. At the beginning of the year those probabilities were 44% and 13%, respectively.
In the past, it has often been an indicator of a weakening economy and in many cases portended an impending recession when the yield curve has been flattening and then inverting. This time around, this signal may not be foreshadowing a near-term recession risk, as it is being heavily influenced by global central bank actions and current economic activity hasn't shown any indications of slowing down. In fact, as an indication of the current economic strength, the Atlanta Fed's GDPNow model forecast for second-quarter 2018 real GDP growth has risen throughout the second quarter to 4.7%, which would be a strong acceleration from the 2.3% GDP growth rate in the first quarter and would be the strongest quarterly growth rate since the third quarter of 2014.
GDPNow—Federal Reserve Bank of Atlanta
Source: Federal Reserve Bank of Atlanta as of June 19, 2018.
While the Fed's monetary policy actions have been directly impacting short-term rates in the U.S., rates in other developed markets continue to be influenced by their central bank interventions. For example, at its most recent news conference, the ECB disclosed its plans to keep its deposit rate at a negative yield of (0.40)% through summer 2019. Furthermore, although the ECB announced that it will begin to taper its asset purchases this fall, it will continue to purchase EUR 30 billion of debt securities per month through September and then reduce the purchases to EUR 15 billion per month until the end of the year. Even though the 10-year U.S. Treasury is yielding only 2.88%, that yield has been attractive to global bond investors as the yield on Germany's 10-year bond is only 0.33% and the yield on Japan's 10-year bond is only barely positive at 0.04%.
Supporting the Atlanta Fed's GDP forecast, the level of the National Financial Conditions Index remains near the strongest readings it has ever registered and is currently indicating that financial conditions remain near their loosest since October 1994. This index is published by the Federal Reserve Bank of Chicago and measures more than 105 variables to gauge how "loose" or "tight" financial conditions are among U.S. capital markets, as well as the traditional and shadow banking systems. These variables include credit availability and cost, leverage, risk, interest rates, and credit spreads. Index levels above zero indicate tighter than average conditions, whereas levels below zero represent looser-than-average conditions.
Chicago Fed National Financial Conditions Index

Source: Federal Reserve Bank of Chicago. Data as of June 25, 2018.
/cloudfront-us-east-1.images.arcpublishing.com/morningstar/G3DCA6SF2FAR5PKHPEXOIB6CWQ.jpg)
/cloudfront-us-east-1.images.arcpublishing.com/morningstar/6ZMXY4RCRNEADPDWYQVTTWALWM.jpg)
:quality(80)/s3.amazonaws.com/arc-authors/morningstar/54f9f69f-0232-435e-9557-5edc4b17c660.jpg)