
How Do Expenses Change in Retirement?
The CPI-E statistic provides a window into how older adults spend their money and how they're affected by inflation.
/s3.amazonaws.com/arc-authors/morningstar/66112c3a-1edc-4f2a-ad8e-317f22d64dd3.jpg)
Note: This article was originally published on June 28, 2018.
"What's your retirement 'number'?"
That question has been floating around in retirement circles for a while. The "number" in question relates to how much money a worker deems sufficient for his or her retirement years.
Gauging financial wherewithal is, of course, central to figuring out retirement readiness, and for more and more retirees, their portfolio balances--not pensions--are the central determinant of whether retiring is financially viable. Hence the focus on amassing the right "number."
But I find the idea of a "number" problematic from a couple of angles.
The first is that it implies that there's a precise answer to a question that's immutably open-ended: Given uncertain life spans and markets, retirement planning is a game of probabilities, not precision. Investors' portfolios will absolutely fluctuate over their retirement time horizons, so focusing too much on a single number sounds like a recipe for anxiety.
Moreover, people are inclined to pull their target retirement amounts out of thin air, or to anchor on numbers that seemed like a lot of money many years ago but are now wildly insufficient thanks to the ravages of inflation. (The target amount that I thought would be more than enough when I started my career is, sadly, not going to cut it over my own retirement.)
A better approach is to gauge retirement readiness in a highly customized way, factoring in sources of nonportfolio income, asset allocation, and anticipated in-retirement spending. Your budget during your preretirement years can be a good starting point when determining how much you'll spend in retirement per year or per month, but it's also valuable to consider how that spending might change in retirement.
One data set that may be useful as you think through that last question is a statistic called CPI-E--an experimental Consumer Price Index that captures the spending of adults who are age 62 and above. The Bureau of Labor Statistics has been calculating CPI-E since 1982, so there are now 35 years' worth of data. By comparing CPI-E to the two published CPI measures--CPI-U (Consumer Price Index for All Urban Consumers) and CPI-W (Consumer Price Index for Urban Wage Earners and Clerical Workers)--it's possible to see how people post-age 62 spend their money relative to those broader populations. Those spending patterns, combined with what we know about inflation trends for various consumer expenditures, can help you assess how your in-retirement spending might change in retirement relative to your working years.
Here's a look at the expenditure weightings for CPI-E (for older adults) versus that of CPI-U and CPI-W, as well as the most recent inflation readings for those categories.
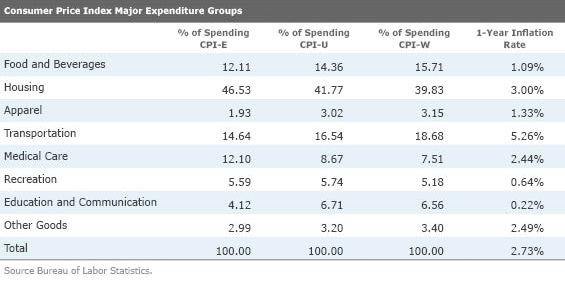
Medical Care Historically, medical care has been an area where older adults have tended to spend more than the broad population, and the recent CPI data bear that out. For example, the CPI-E data for December 2017 show a 12.1% expenditure on medical-related costs, versus 8.7% for CPI-U and 7.5% for CPI-W. Note that all of those medical care outlays, as a percentage of budgets, were higher in 2012 than they were five years ago. In 2012, CPI-E showed that older adults spent 11.3% of their total outlays on medical care, versus 6.9% for the CPI-U and 5.6% for CPI-W. Yet even as the 2017 medical care expenditures were higher, the outlay gap between older adults and the broad population narrowed over the past five years. In other words, medical spending as a percentage of total spending edged up for both older adults and the broader population, but the broader population saw the bigger jump.
Historically, a related pain point for older adults was that not only were medical care expenditures a bigger share of their budgets, but medical care inflation was also higher. Between 1948 and 2012, medical care inflation averaged 5.42%. That figured declined to an average of 1.1% annually between 2014 and 2016, but more recently medical care inflation showed signs of ticking back up: The one-year reading was 2.44%.
Housing At first blush, the CPI-E data on housing as a percentage of total expenditures is eye-popping: Per CPI-E, older adults spent 47% of their total outlays on housing over the past year--more than 5 percentage points higher than the housing outlay for CPI-U and CPI-W. But it's important to unpack how the BLS arrives at that housing expenditure, as discussed here. Given that many older adults own their homes rather than rent them, it's likely that CPI-E overstates housing-related costs for many older consumers. Thus, pre-retirees should rely exclusively on their own current/planned housing-related outlays to determine how much to budget for housing costs.
Food Food expenses have historically been a smaller amount of older adults' budgets, as reflected in CPI-E, and that's true in the most recent data set, too. Older adults spend less on food they prepare at home, and they also spend less on dining out than the broad populations reflected in CPI-U and CPI-W data. That syncs with reality for many retirees, who have more time to strategize and economize on food, and who have less need to eat out for reasons of convenience than they did when they were working.
Transportation Older adults spend less on transportation--both autos and fuel--than is the case for the broader population groups reflected in CPI-U and CPI-W. In periods of higher gas prices--as has been the case over the past year--older adults tend to be hurt less, but their budgets also benefit less when fuel prices are declining, as was the case from 2014 through early 2016.
Overall CPI-E Inflation The most recent reading of CPI-E--for the one-year period through May 2018--shows that inflation for older adults was 2.73%--a hair lower than the 2.8% reading for CPI-U. However, that's a shift from historical trends in CPI-E, when rising medical costs--and the fact that those costs are typically a bigger share of older adults' outlays than is the case for the broad population--drove CPI-E higher than CPI-U. From 1982 through December 2012, for example, CPI-E was 3.07% versus 2.92% for CPI-U. That underscores that retirees ought to remain watchful for signs of inflation and work to preserve their purchasing power from their portfolio withdrawals by embedding inflation hedges into their portfolio holdings.
/cloudfront-us-east-1.images.arcpublishing.com/morningstar/O26WRUD25T72CBHU6ONJ676P24.png)
/cloudfront-us-east-1.images.arcpublishing.com/morningstar/WDFTRL6URNGHXPS3HJKPTTEHHU.png)
/cloudfront-us-east-1.images.arcpublishing.com/morningstar/EC7LK4HAG4BRKAYRRDWZ2NF3TY.jpg)
:quality(80)/s3.amazonaws.com/arc-authors/morningstar/66112c3a-1edc-4f2a-ad8e-317f22d64dd3.jpg)